India-Pakistan Trade A Case Study of the Automobile Sector - SDPI
←
→
Page content transcription
If your browser does not render page correctly, please read the page content below

India-Pakistan Trade A Case Study of the Automobile Sector
Study Objectives

• To analyze the competitiveness of the auto-industry vis-à-vis
  India

• To explore automobile import and export patterns of India
  and Pakistan

• To identify various hindrances impeding cross-border trade in
  automobiles

• To see whether India and Pakistan can be potential import
  partners in automobiles
                                                                  2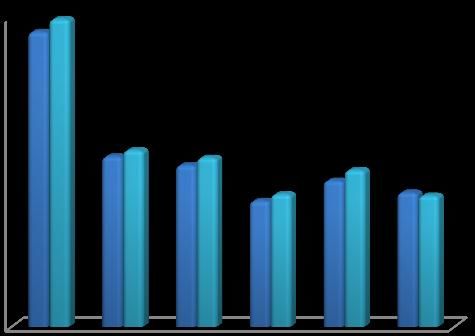
Background

• Auto sector annual growth rate from 6.2% in 2007-08 to
  18.2% in 2011-12

• Auto-industry’s annual contribution to GDP amounts to $3.6
  billion

• Contributes 16% to value addition in the manufacturing sector

• It also generates 215,000 direct job opportunities

• Contributes $0.82 billion to the revenue collection through
  indirect taxes (CCP 2012).                                    3
Evolution of Pakistan’s Automotive Industry

             • Establishment of National Motors Limited (NML)
1950s

             • Nationalization
1970s        • Establishment of Pakistan Automobile Corporation (PACO)

             • De-Nationalization
             • Initiation of joint projects between PACO and private enterprises, development of automotive
1980s          parts industry

             • Post Privatization
             • Re-emergence of private sector: Pak Suzuki Motors, Indus Motors, Honda Atlas Cars, Dewan
1990s          Farooq Motors, Adam Motors, Proton, Nexus Auto

Based on JICO (2011) and CCP (2012)                                                                     4
Firm-level Specifications of Automobile Sector in Pakistan

Manufacturers           Installed     Turnover      Contribution to
                        Capacity      2011-12         Exchequer
                        (Nos. per   (PKR Million)    (PKR Million)
                         annum)
Pak Suzuki Motor         150,000       58,531           17,302

Indus Motor              54,800        77,000           24,700

Honda Atlas Cars         50,000        30,275           10,664

Dewan Farooque Motors    20,000           -               8

Sigma Motors             1,320          998              236

Source: PAMA, 2013

                                                                      5
Production and Sales Position
Year-wise production and sale of cars Year-wise production and sale of buses
1200
200000
1000
150000 Units of cars 800
Units of buses
produced
Units
Units
600 produced
100000
Units of cars sold 400
50000 200 Units of buses sold
0
0 2008 2009 2010 2011 2012 2013
2008
2009
2010
2011
2012
2013
Year-wise production and sale of trucks
Year-wise production and sale of 2/3 wheelers
6000
1000000
5000
Units of 2/3 Units of trucks
800000 wheeler produced 4000 produced
Units
600000
Units
3000
400000 2000
Units of 2/3 Units of truks sold
200000 wheeler sold 1000
0
0
2008
2009
2010
2011
2012
2013
2008 2009 2010 2011 2012 2013
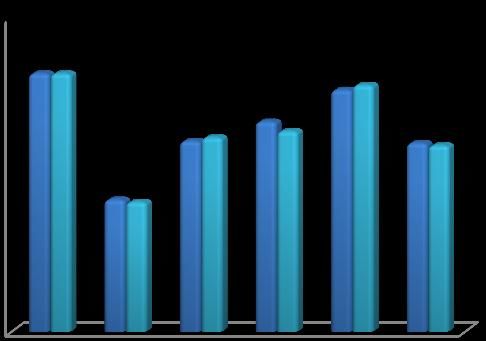
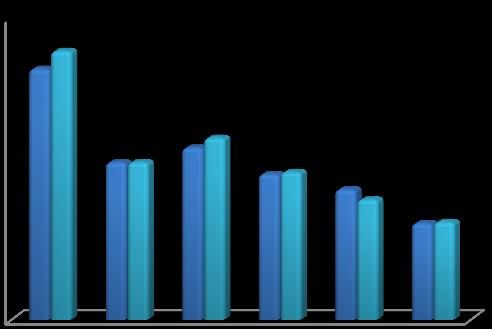
Data source: PAMA, 2013 6Automobile Imports and Exports of Pakistan
2000
1,502 1,596
1500 1,308
1,184
$ Million
969
1000
500
99 66 84 82 72
0
2008 2009 2010 2011 2012
Automobile imports Automobile Exports
Source: ITC Trade Map, 2013
7Auto Sector Import Policy in Pakistan
• Despite discouraging policies regarding import of used cars, a
large number of cars are imported every year
• With demand of cars rising exponentially, local manufacturers
could not meet demand
• As many as 500 independent dealers were involved in the
selling of used cars at nearly double the prices of the locally
manufactured cars in 2009 (JICO, 2011)
• Key reasons for preferring imported vehicles include road
safety, quality of parts and advanced technology
8Trading Partners of Pakistan in Automobiles (2012)
Export Exported % Share in Import Imported % Share in
partners value 2012 Pakistan's partners value 2012 Pakistan's
(USD Automobile (USD Automobile
thousand) exports thousand) imports
Afghanistan 12553 17.5 Japan 916508 57.4
Nigeria 6293 8.8 Thailand 239557 15.0
Bangladesh 5762 8.0 China 179349 11.2
Italy 5696 7.9 Singapore 41235 2.6
United Arab 5108 United 39303
Emirates 7.1 Kingdom 2.5
United States 4686 Germany 36740
of America 6.5 2.3
Kenya 3250 4.5 Belarus 31748 2.0
Algeria 2671 United States 22958
3.7 of America 1.4
Sudan 2461 3.4 Turkey 17015 1.1
Libya 2012 2.8 Indonesia 14071 0.9
Source: ITC Trade Map, 2013
9Trading Partners of India in Automobiles (2012)
Export Exported value % Share in Import Imported value % Share in
Partners 2012 (USD total auto- Partners 2012 (USD total auto-
thousand) Exports of thousand) Imports of
India India
USA 1017027 8.3 China 1034878 20.8
South Africa 974872 8.0 Germany 788602 15.8
United 641100 5.3 Korea, 753245 15.1
Kingdom Republic of
Sri Lanka 638648 5.2 Japan 587273 11.8
Algeria 508672 4.2 Thailand 275650 5.5
Bangladesh 412692 3.4 United 245652 4.9
States of
America
Mexico 397194 3.3 Spain 150297 3.0
Colombia 378892 3.1 United 146896 3.0
Kingdom
Singapore 366278 3.0 Italy 130417 2.6
United Arab 361290 3.0 Czech 109142 2.2
Emirates Republic
Source: ITC Trade Map, 2013
10India-Pakistan Bilateral Trade in Automobiles
1400
1200
1000
800
000$
600
400
200
0
2006
2003
2004
2005
2007
2008
2009
2010
2011
2012
Auto-exports to India Auto-imports from India
Source: ITC Trade Map, 2013
11Bilaterally Traded Auto-products (2012)
Pakistan's Imports from India Pakistan's Exports to India
Product Product label Value in Product Product label Value in
code 000$ code 000$
870899 Motor vehicle parts 20 870840 Transmissions for 252
n.e.s motor vehicles
870190 Wheeled tractors 12 870899 Motor vehicle 241
n.e.s parts n.e.s
870321 Automobiles w 2 870829 Parts and 128
reciprocatg piston accessories of
engine displacg not bodies n.e.s for
more than 1000 cc motor vehicles
870990 Work truck parts 1
Source: ITC Trade Map, 2013
12Auto Imports of Pakistan from the rest of the world compared with India (2012)
Product code Product label Value of imports Value of
from India imports from
(000$) the rest of the
world (000$)
870899 Motor vehicle parts n.e.s 20 1528274
870190 Wheeled tractors n.e.s 12 584811
870321 Automobiles w reciprocatg piston 2 735018
engine displacg not more than
1000 cc
870990 Work truck parts 1 7424
Source: ITC Trade Map, 2013
13SDPI Study on Informal Trade
(India Pakistan)
• Automobile sector: USD 5.7 million
• Tyres: USD 170 million
• Routes:
– Dubai, Afghanistan, and Afghan Transit Trade (ATT)
main sources
– Leakages from the transit containers also play a role in
informal trade
– Indian tyres are primarily supplied via the ATT route
– There is evidence of indirect trade via Dubai, Thailand
and Singapore
14Average Effective Price of Automobile (2012)
Do price differences matter?
15Power-Interest Matrix of Stakeholders for Bilateral Trade in Automobiles
16Unbundling the Stakeholder’s Matrix
• Consumers: auto industry has been a recipient of subsidies and has remained
protected through tariff and NTBs. Only a few groups have control over prices
and consumers get exploited
• Assemblers: traditionally opposed to trade; fear dumping from India due to its
large economies of scale; cost of production in Pakistan is higher
• Traders: Trade with India can imply cheaper import of intermediate goods.
Consumer demand high for Indian parts
• Government (with disclaimer): Allow CKD trade and gradually allow trade in
CBU
17Unbundling the Stakeholder’s Matrix
• The matrix is evolving
• Pakistan Suzuki has given up its opposition to
imports from India
• Key reasons include:
– Better environmental standards of Indian vehicles
– More economical prices of inputs and final product
18Comparison of Auto Sales in India and Pakistan
Case for Supply Chain Integration
Above India
Pakistan 1300cc
2%
800-
1000cc 1000-
21% 1300cc
Above 18%
1300cc
49%
1000-
800-
1300cc
1000cc
30%
80%
Source: JICO, 2013NTBs Facing Auto Sector Exports of Pakistan
• Custom levies arbitrarily imposed
• State-level tariffs not explicitly documented
• India has restrictions on importing automobile through 145 import entry
points
• Sample tested more strictly in case of Pakistan
• In case of tractors parts rejected as they look weapon-like
• OEMs (original equipment manufacturer) do not accept auto parts from
Pakistan
• Lack of fork lifters at Attari damaging the products
• Emission standards are also set too high. These standards are even high
than those of EU and Japan. India requires auto-products to comply with
Bharat-I and Bharat-II standard. The measuring method of this standard is
quite different from the international method which acts as a barrier to
import
20Indian Import Duties for 2-wheelers
• Pakistani 2- wheelers subject to high tariff rates
• Other additional charges such as port expenses (almost
3%) and incidences of clearance (2% of the CIF value)
• Even if custom duty is removed, other taxes accounts for
over 25% duties. Moreover, these tax figures exclude cost
of approvals, permissions and certifications which further
increase the cost of export to India. This makes the export
of two wheelers to India nearly impossible.
21Views from Pakistan Association of Automotive Parts &
Accessories Manufacturers
• First invest in capacity development of the local automobile manufacturing
before opening auto trade with India
• Pakistan should first consider ‘technology transfer’ from India. This can also take
a form of Foreign Direct Investment (FDI) by Indian auto-manufacturers
• Pakistan currently follows the EU quality standards while testing whereas India
demands testing only by Indian standards (past perception)
• Indian government must ensure Pakistan a significant amount of auto-import
from Pakistan in order to assure mutual gains
• There are concerns that Indian auto manufacturers are more interested in
importing raw materials (CKD) rather than CBUs and that India may practice
‘dumping’ which would be detrimental to Pakistani auto industry
• Auto-import policy with India should be focused on ‘selective buying’ from India.
Those products which are not manufactured in Pakistan should be given priority
• Negative list can be removed without granting MFN to India
22Way Forward – Some Examples
• Argentina-Brazil agreement of 1999 in auto trade, where by duty free
exports from Brazil were linked to its import from Argentina. Today 80
percent of Argentinian units are bought by Brazil. It is also noteworthy that
such an arrangement helped sharpen Argentina’s competitive advantage
in auto sector – which represents 13 percent of total exports of the
country.
• Canada-US auto sector agreement of 1965. Under this arrangement for
every US car sold in Canada, the US manufacturer had to produce one unit
in Canada. This not only employed local labour force but also allowed for
technology transfer. Today Canada’s production of automobile is close to
2.6 million units with the auto parts production valued at USD 35 billion.
This example can be replicated in case of India-Pakistan as both countries
have formally liberalized the bilateral investment regime.
23Thank You www.sdpi.org, www.sdpi.tv
You can also read