INDUSTRY HEARTBEAT
MARCH 2021 QTR
←
→
Page content transcription
If your browser does not render page correctly, please read the page content below
INDUSTRY HEARTBEAT MARCH 2021 QTR

Welcome to Heartbeat, our quarterly update                          nights and a booking total amount of at least $1 are included in
on tourist accommodation trends.                                    this calculation.

This Report provides comparative analysis on changes in             Average Stay
Occupancy, Average Daily Rate (ADR) and RevPAR across all three     is calculated as the days between the booking arrival date
tourist accommodation categories of Cabins, Powered Sites and       and the booking departure date. Only bookings that are not
Unpowered Sites. Our analysis compares the current quarter with     cancelled, with a lead time of less than 370 days, with a stay of
the same period last year, over time displaying trends to reflect   between 1 to 31 nights and a booking total amount of at least $1
market changes by state and park size. We define park size by the   are included in this calculation.
number of available sites and summarise ADR, Occupancy and          Booking Value
RevPAR results in the final tables of the Report.                   is calculated as the average booking total for accommodation.
                                                                    Only bookings that are not cancelled, with a lead time of
                                                                    less than 370 days, with a stay of between 1 to 31 nights and
Key Terms
                                                                    a booking total amount of at least $1 are included in this
Average Daily Rate (ADR)
                                                                    calculation.
This measure identifies the average tariff for a Cabin, Powered
Site or Unpowered Site on a daily basis. It is calculated by
dividing total revenue received during the quarter for each         Our Approach
accommodation category by the number of nights occupied.            Working in collaboration with the Caravan Industry Association
                                                                    of Australia, BDO has collected data on behalf of the Industry
Average Occupancy
                                                                    from participating parks since October 2015 through our Cara-
This measure expresses the occupancy in percentage terms of
                                                                    vanStats.com.au initiative.
Cabins, Powered Sites and Unpowered Sites for the quarter. It
                                                                    With several years of data now available, we are in a position to
is calculated by dividing the number of nights occupied by the
                                                                    incorporate year-on-year changes within this Report relating to
number of total available nights during the period.
                                                                    overall market changes.
Revenue Per Available Room (RevPAR)
RevPAR is a tool used to measure the overall success of various
categories of accommodation within caravan parks. It is
                                                                    Disclaimer
                                                                    This Report has been prepared exclusively for the Caravan
calculated by dividing total revenue received for Cabins, Powered
                                                                    Industry Association of Australia. BDO does not accept
Sites and Unpowered Sites during the quarter by the number of
                                                                    responsibility to any person for the contents of the Report.
nights available in each accommodation category.
                                                                    To the extent permitted by law, we do not accept liability for
Booking Lead Time
                                                                    any loss or damage which any person, other than our client, may
is calculated as the days between the booking placed date and the
                                                                    suffer arising from any negligence on our part. No person should
booking arrival date. Only bookings that are not cancelled, with
                                                                    rely on this Report without undertaking relevant assurance
a lead time of less than 370 days, with a stay of between 1 to 31
                                                                    procedures.
MAR-20 v MAR-21
With international borders remaining closed during the March          Across all short-stay accommodation types, average lead
2021 quarter, domestic travel has rebounded strongly and the          times were higher during the March quarter than the same
performance of the caravan park industry has significantly            time last year. While it is commonly understood in the
improved when compared to the same quarter last year. At the          current market that guests are booking with shorter than
same time in 2020, the Eastern States and South Australia were        usual lead times, the influence of Christmas / New Year and
still suffering the impact of bushfires and the early stages of       the lead up to Easter all fell within the March quarter this
COVID related shut downs.                                             year, which may influence this result in non public holiday
                                                                      periods.
Cabins have rebounded particularly well, with an increase in
occupancy of 12% and sharp jumps in ADR and RevPAR.                   Tasmania’s recovery during the March quarter has lagged
                                                                      behind the mainland across all short-stay accommodation
All categories performed well in the March 2021 quarter,
                                                                      categories, highlighting the challenges Tasmania faces to
rebounding to a level of occupancy, ADR and RevPAR that
                                                                      entice tourists across the Bass Strait.
exceeds both March 2020 and the March 2019 quarter which was
more reflective of regular trading conditions.

                                                                  % Occupancy             ($ ADR)          ($) RevPAR
                                            MAR-20 QTR                   48%                 $166                  $79
                                            MAR-21 QTR                   60%                 $175                $104
             CABINS                         Change                       12%                    $9                 $25

                                                                  % Occupancy             ($ ADR)          ($) RevPAR
                                            MAR-20 QTR                   39%                  $54                  $21

              POWERED                       MAR-21 QTR                   48%                  $55                  $27
              SITES                         Change                        9%                    $1                  $6

                                                                  % Occupancy             ($ ADR)          ($) RevPAR
                                            MAR-20 QTR                   11%                  $46                   $5
              UNPOWERED                     MAR-21 QTR                   15%                  $47                   $7
              SITES                         Change                        4%                    $1                  $2
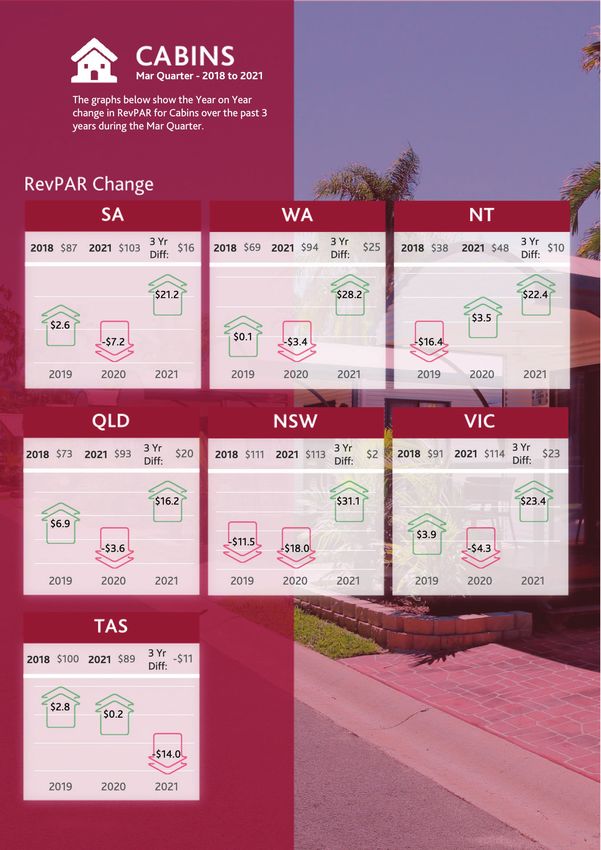
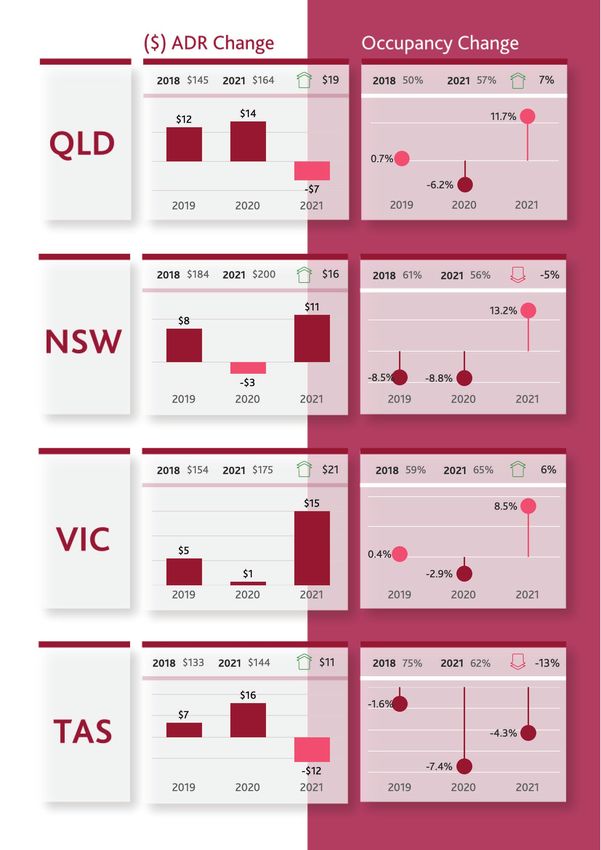
With the exception of Tasmania, the March
quarter more than recovered its lost ground
from last year, driven by both strong occupancy
and ADR results
Across Australia, guests in all accommodation types are staying
longer and spending more. The first quarter of 2020 was a
particularly challenging year with the impact of bushfires and
COVID. In contrast, the start to 2021 has been positive for the
domestic travel industry as international travel restrictions remain
in place and Australians elect to holiday locally at a higher than
usual rate.
RevPAR across all states with the exception of TAS has rebounded
strongly as border restrictions ease, facilitating interstate travel.
TAS continues to lag behind other states in the recovery from
COVID. This is in part due to the tight border controls in TAS, and
repeat shut downs in VIC and NSW making travel via Melbourne
more difficult. The Tasmanian government has recognised this
is a problem and has offered free car or motorbike transport
on the Spirit of Tasmania ferry from March 1 to June 30 in an
effort to improve its tourist economy. The impact of this policy
announcement on tourist parks will be evident in the June
quarter’s Heartbeat Report.
In other states, while RevPAR has uniformly improved, occupancy
results over the past three years have been mixed. In NSW,
occupancy increased by 13.2% compared to 2020, but has not yet
rebounded to the levels of 2018 at 61%.
Average Daily Rate for Cabins has grown in most states,
particularly in Western Australia, Victoria and Queensland over
the past 3 years during the March quarter with average increases
of $25, $21 and $19 respectively.
6


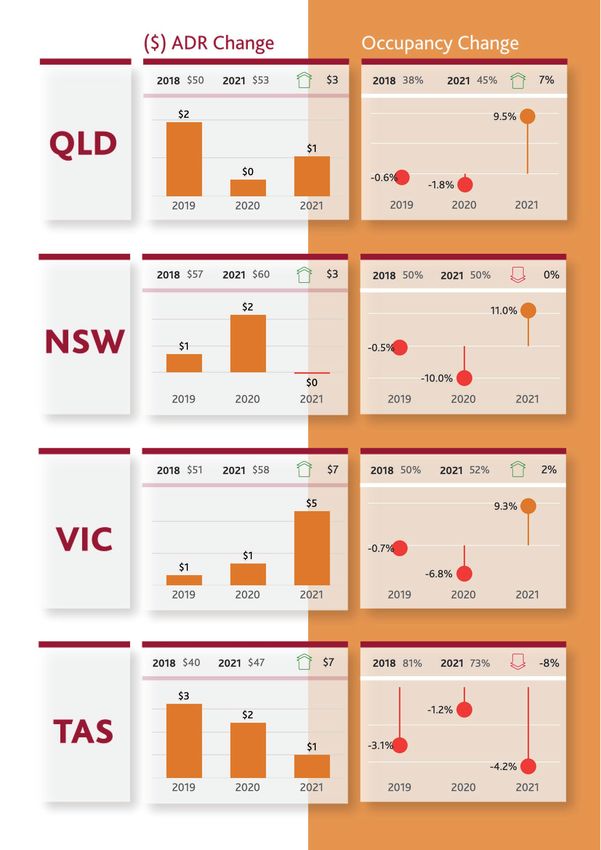
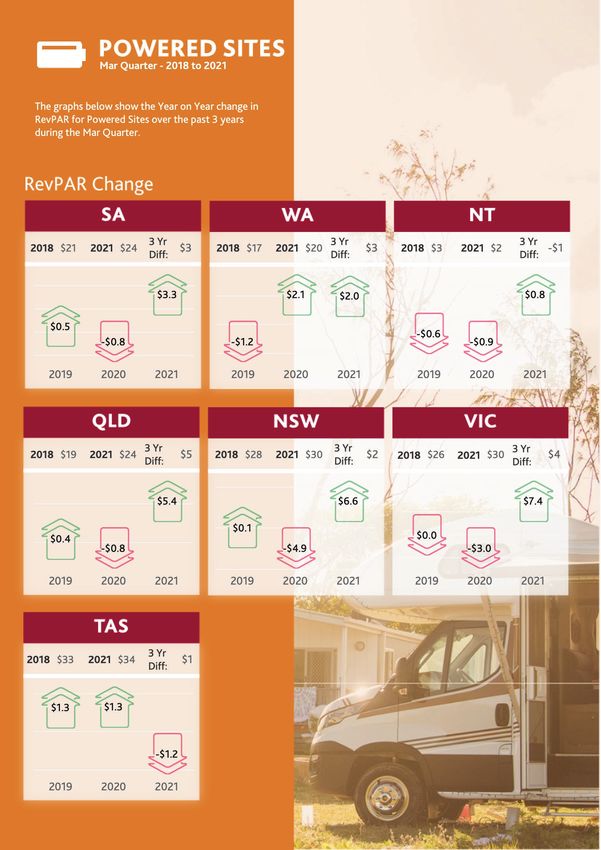
On average, powered sites did better during the
March-21 quarter than before the start of the
pandemic
As with cabins, powered sites are showing positive growth
for all measures (both ADR and occupancy) nationally when
compared to the same quarter in 2020. Across all short-stay
accommodation types in the caravan industry, growth in demand
for domestic tourism continues to drive overall year-on-year
increases in occupancy in all jurisdictions, excluding Tasmania.
Tasmania’s powered site occupancy rates were the highest in the
nation during the March-21 quarter at 73%. However, this still
represents a decline over three years from a height of 81% for
Tasmania’s powered sites in 2018.
Excluding Tasmania, the increase in demand for powered sites
(measured through occupancy) is mostly consistent across the
jurisdictions. In contrast, ADR movement (while still mostly
positive) has been mixed between the states. Jurisdictions like
South Australia have seen successive increases of $2 year-on-year
while no price movement was recorded in other states, such as
New South Wales during the Mar-21 quarter.
From a powered site RevPAR perspective, all states and territories
(excluding the Northern Territory) have improved during the
March quarter over the past 3 years by between $1 to $5. This
uplift over a 3 year period can mostly be attributed to rate
increases notwithstanding the occupancy correction seen this year
in response to the impact of COVID-19 in 2020. For example,
over the past 3 years during the March quarter, ADR for powered
sites has increased by $6-7 in SA, WA, VIC & TAS.
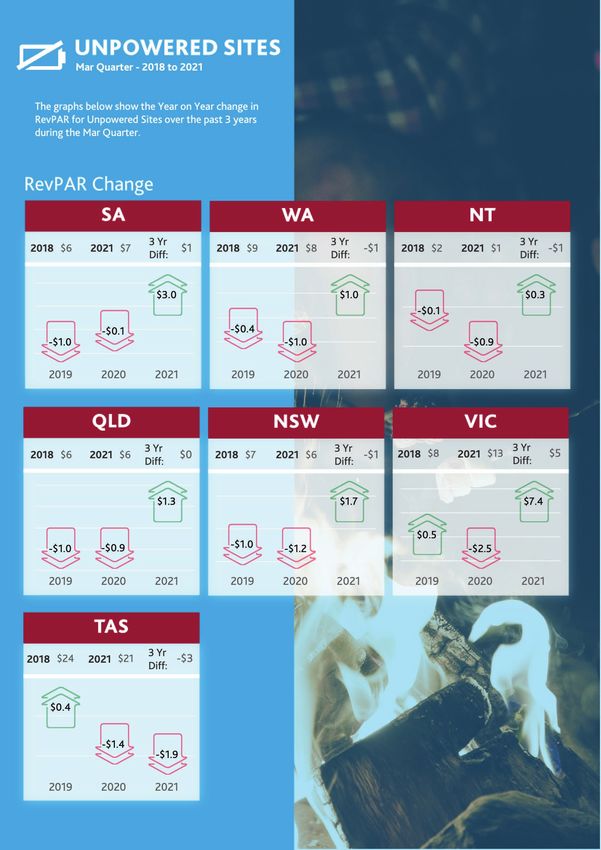
Unpowered site performance over the past
3 years has been mixed among states and
territories during the March quarter
Revenue from available nights is relatively unchanged over
the past 3 years for unpowered sites at a national level. To
varying degrees across the jurisdictions, stronger performance in
unpowered sites this quarter has seen RevPAR recover from its
declines over the last two years.
In states like South Australia, unpowered site ADR has seen year-
on-year increases to move from an average of $31 in 2018 to $42
in 2021, representing a jump on $11. While the rate has increased
substantially, relatively soft demand in SA has lead to an increase
in RevPAR of only $1 over the past 3 years.
Generally, over the past 3 years ADR has increased by around
$4 to $6 across the jurisdictions during the March quarter and
occupancy results have varied substantially.
Victoria has shown the strongest increase in RevPAR ($7.4) on
the back of higher daily rates and a remarkable 12.5% increase in
occupancy when compared to March 2020. Over the past 3 years,
Victoria has improved it’s overall RevPAR result the most, up by
$5 to $13 during the March 2021 quarter.
Although TAS has reported poor results for the quarter with a
decrease in occupancy and RevPAR, TAS has by far the highest
occupancy rate for unpowered sites at 50%. The next closest
state (VIC) only recorded occupancy for unpowered sites at 25%.
This may be a result of the overall different characteristics of
short-term tourist parks in Tasmania.
While it is commonly understood in the current market that
guests are booking with shorter than usual lead times, data in
the March quarter suggests this was not uniformly the case with
lead times on average increasing in unpowered sites to 24.3 days.
With Christmas / New Year and the lead up to Easter all falling
within the March quarter this year, this overall lead time result for
the Quarter may be influenced by those periods of peak demand.
COMMISSIONED BY   FINANCIALLY SUPPORTED BY

DATA TABLES
Detailed quarterly accommodation performance measures based
on Park Size (number of sites), State and Category Type are
provided in the following pages.
1300 138 991         This publication has been carefully prepared, but it has been written in general terms and
                     should be seen as broad guidance only. The publication cannot be relied upon to cover specific
www.bdo.com.au       situations and you should not act, or refrain from acting, upon the information contained
                     therein without obtaining specific professional advice. Please contact the BDO member
                     firms in Australia to discuss these matters in the context of your particular circumstances.
NEW SOUTH WALES      BDO Australia Ltd and each BDO member firm in Australia, their partners and/or directors,
                     employees and agents do not accept or assume any liability or duty of care for any loss
                     arising from any action taken or not taken by anyone in reliance on the information in this
NORTHERN TERRITORY   publication or for any decision based on it.
                     BDO Advisory (SA) Pty Ltd ABN 74 161 378 892 is a member of a national association of
QUEENSLAND           independent entities which are all members of BDO Australia Ltd ABN 77 050 110 275, an
                     Australian company limited by guarantee. BDO Advisory (SA) Pty Ltd and BDO Australia Ltd
                     are members of BDO International Ltd, a UK company limited by guarantee, and form part of
SOUTH AUSTRALIA      the international BDO network of independent member firms. Liability limited by a scheme
                     approved under Professional Standards Legislation (other than for the acts or omissions of
                     financial services licensees) in each State or Territory other than Tasmania.
TASMANIA             BDO is the brand name for the BDO network and for each of the BDO member firms.
                     © BDO Advisory (SA) Pty Ltd. All rights reserved.
VICTORIA
WESTERN AUSTRALIA
You can also read