Industry
Insights
A roundup of noteworthy foodservice findings
for the week of March 1, 2021
←
→
Page content transcription
If your browser does not render page correctly, please read the page content below
Industry Insights A roundup of noteworthy foodservice findings for the week of March 1, 2021
I G N I TE C O M PAN Y

Top Pizza Players                                                                                   QUARTERLY SAME-STORE SALES
                                                                                                     YEAR-OVER-YEAR CHANGE %

See Strong 2020                                                                                          Papa John's   Domino's

Results                                                                                               28.0%

Driven by a pandemic-fueled spike in      straight quarters of positive results. On                                    23.8%
delivery demand, two of the industry’s    an annual basis, comparable sales
largest pizza players achieved double-    grew 11.5% in 2020 following a 3.2%
digit same-store sales growth in 2020.    increase in 2019.
                                                                                                                           17.5%
At Papa John’s, same-store sales rose                                                                     16.1%
13.5% during the fourth quarter,
marking the chain’s sixth consecutive                                                                                              13.5%
quarter of growth. Annualized same-                                                                                                    11.2%
store sales increased by 17.6% in 2020
after declining 2.2% the year prior.
Domino’s U.S. same-store sales rose                                                   5.3%
11.2% in the fourth quarter, continuing
the chain’s impressive streak of 39                                                          1.6%

                                                                                      Q1 2020          Q2 2020          Q3 2020     Q4 2020

Sources: Technomic Ignite company data

© 2021 Technomic, Inc.                                                                                                                         2
C O N V E N I E N C E - S TO R E F O O D S E RV I C E NEW OPTIONS successful 2020 LTO promotion, the
Waffle Breakfast Sandwich features
sausage and egg between two
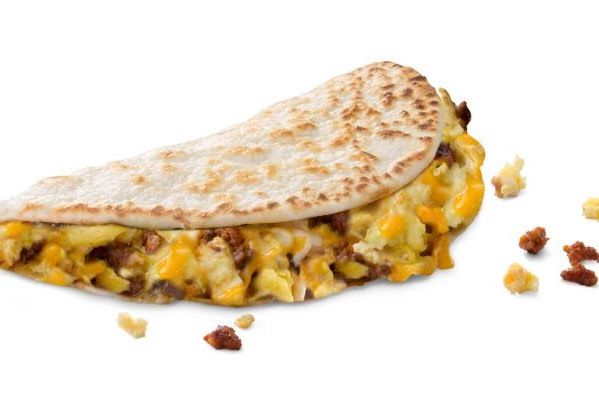
Spicy Quesadillas maple-flavored waffles. (Kwik Trip)
Winning Back the
Two new quesadillas with heat-
tinged flavor profiles join the menu.
For breakfast, the Chorizo & Egg Updated Proteins
Quesadilla is made with spicy A new Sizzli breakfast sandwich
Morning
chorizo, eggs and melted cheese. variety now showcases plant-based
(Kwik Chek) Beyond Breakfast Sausage, served
with egg and cheese on a bagel.
Handheld Waffles (Sheetz)
Joining the permanent menu after a
The brisk morning traffic that the morning menu—with plenty of
convenience stores have been portable meal options—is a must.
traditionally known for has given way to
Our most recent consumer research
a seismic shift in consumer behavior.
found that roughly half (49%) of
The typical morning routine that would
frequent c-store consumers are most
normally bring customers in for fuel,
likely to purchase breakfast sandwiches
coffee and breakfast hit a downturn
when they stop in for foodservice during
over the last year, as work and school
the week. To meet this need, c-stores
obligations became centered at home.
are working with their supplier partners
Now, however, we’re seeing the to try out new LTO breakfast
beginnings of a return to both on-site sandwiches with a variety of carriers,
work life and in-classroom learning. fillings and flavors to reinvigorate the
This means that a burgeoning breakfast daypart and win back the
resurgence in c-store morning routines morning.
is poised to take root. For c-stores to
take advantage, a renewed attention to
Image Source: CSP Daily News
Source: Technomic Convenience-Store Membership Program featuring the C-Store Q1 2021 MarketBrief Courtesy of Kwik Chek/TXB
© 2021 Technomic, Inc. 3I G N I TE C O N S U M E R
WHICH OF THE BELOW STATEMENTS MOST CLOSELY DESCRIBES YOUR
EATING HABITS WITH RESPECT TO ANIMAL PRODUCTS?
Meat-Restrictive Vegan: do not eat any animal
Diets Expanding
2%
products
Vegetarian: do not eat any
3%
type of fish or meat
Diets constantly evolve, and consumers based eating has on the environment.
are increasingly adhering to ones that
Consumers are also increasingly saying
limit animal products in some way. The Pescatarian: eat fish or
at least one friend or family member is 3%
flexitarian diet has increased the most seafood, but not meat
a vegetarian (41%, up from 36% in
since 2018 and has the highest
2018), which can impact their dietary
adherence, likely because it is the most
choices and knowledge.
accommodating and customizable. Flexitarian: typically eat a
Although not shown, weekly vegetarian diet, but allow 8%
Up from 5%
consumption for both seafood and meat or fish on occasion in 2018
vegetarian dishes has also increased
since 2018, due in part to shifting
dietary habits. This trend is poised to Semivegetarian: eat only
6%
continue as consumer awareness certain types of meat
increases about these diets and lifestyle
choices, such as the benefits plant-
I allow meat, fish and dairy in
78%
my diet Down from 82%
in 2018
Base: 2,736 consumers ages 18+
Source: Technomic Ignite consumer data featuring the Technomic 2021 Center of the Plate: Seafood & Vegetarian
Consumer Trend Report
© 2021 Technomic, Inc. 4G L O B AL F O O D S E RV I C E N AV I G ATO R
Sustainability
Back in Focus
Put on hold for a short while, suppliers Middle East & North Africa
and operators have restarted their
Starbucks rolled out strawless lids
sustainability initiatives in recent
across its system in the region as part
months as the health of the
of its ongoing effort to reduce plastic
environment remains a key long-term
use at its coffee shops.
priority across global markets.
Canada
Here are some recent highlights.
KFC is testing a compostable spork
Australia
made of bamboo, corn and sugarcane
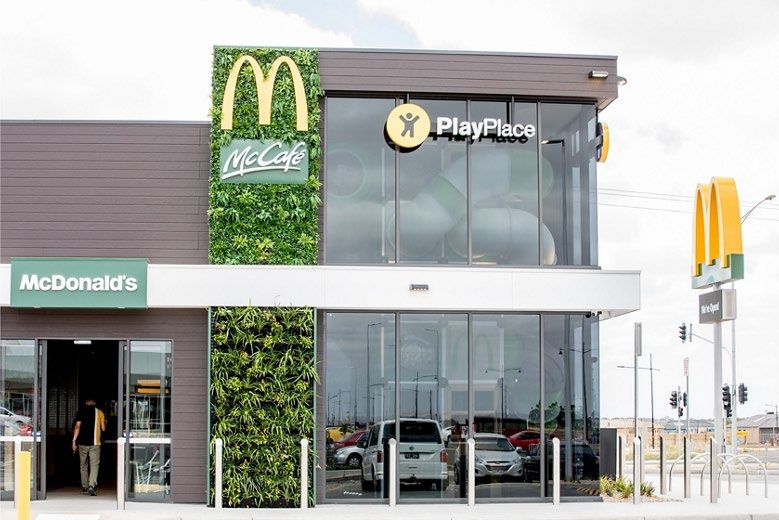
McDonald’s new eco-friendly flagship— that breaks down into biomass and
which marks the brand’s No. 1,000 takes 18 months to decompose.
store in the country—features
As operators return attention to
sustainable cutlery and packaging,
sustainability and eco-friendly
100% renewable energy, recycling for
initiatives, suppliers should promote
used kids meal toys, charging stations
products that help position their clients McDonald’s eco-friendly flagship in Australia
for electric vehicles and carbon-neutral
as industry leaders. Source: McDonald’s press release
delivery service.
Source: Technomic Global Foodservice Navigator Program
© 2021 Technomic, Inc. 5COVID-19 DISRUPTION INDEX
COVID-19
COVID-19 Disruption Index is Change Versus Previous Week and TOP 5 MOST DISRUPTED MARKETS DISRUPTION
PERCENT PERCENT
powered by Shortest Track, utilizing AI, Month CHANGE CHANGE
BY INDEX POINT CHANGE INDEX
VERSUS VERSUS
machine learning and disparate sets of Change versus previous week/month (VERSUS PREVIOUS WEEK) (MAX: 1.00, HIGH
LAST WEEK LAST MONTH
data resources to quantify the potential allows users to see if the market is DISRUPTION)
risks that U.S. businesses face from the becoming more or less disrupted over
spread of the COVID-19 virus at the time. Changes that are positive (+)
market level. show a move toward becoming 1 Ames, Iowa 0.459 3.28% 4.06%
increasingly more impacted by COVID-
The highest index possible is 1.00, 19 (not good). Changes that are Des Moines-West Des
which is not good and reflects markets negative (-) show a trend toward being 2 0.454 2.93% 4.69%
Moines, Iowa
that are extremely disrupted. The index less impacted by COVID-19 (good).
is updated on a weekly basis.
3 Waterloo-Cedar Falls, Iowa 0.404 2.67% 3.36%
Ignite Subscribers: Download full
The COVID-19 Disruption Risk Index market report
shares weekly updates through a 4 Iowa City, Iowa 0.374 2.69% 3.84%
business lens, rather than a health lens,
and incorporates more than 20 different
data signals to measure disruption and 5 Cedar Rapids, Iowa 0.377 2.65% 3.89%
predict future impact. These signals
include infection rates, deaths, state-
level restrictions and social distancing
requirements, population densities and
mobility, group size limitations and
lifestyle risk factors contributing to
spread. More information is available
HERE.
Notes: Data updated Feb. 22, 2021
Source: Shortest Track
© 2021 Technomic, Inc. 6WAN T M O R E I N S I G H T S ?
Since 1966, we have
You can get this Ignite Company Convenience-Store
produced in-depth
See where restaurant chains Membership
report delivered to are, how many units they have Our c-store consumer reporting research focused on the
you every week! and how well they’re doing.
Explore>>
and brand tracking keeps you on foodservice industry.
Sign up here>> top of what’s happening in the
industry. Explore>> We provide insights into consumer,
industry and menu trends in
the U.S., Canada and 23 countries
around the world.
Our team of experts helps leaders
Ignite Consumer Global Foodservice in the industry make complex
Get to know your customers’ Navigator business decisions, set strategy
customers through 60+ attributes Understand the global industry, and stay ahead of the curve.
and visit occasion metrics. from menu trends to consumers,
Explore>> in 25 countries. Explore>>
Have questions about this report?
Reach out to us today.
312-876-0004
info@technomic.com
technomic.com
© 2021 Technomic, Inc.You can also read