Industry Name - Engineering & Construction Quarterly Update | Q1 2022 - MNP
←
→
Page content transcription
If your browser does not render page correctly, please read the page content below

Engineering & Construction
Quarterly Update | Q1 2022

[Industry Name]

                             MNPCF.ca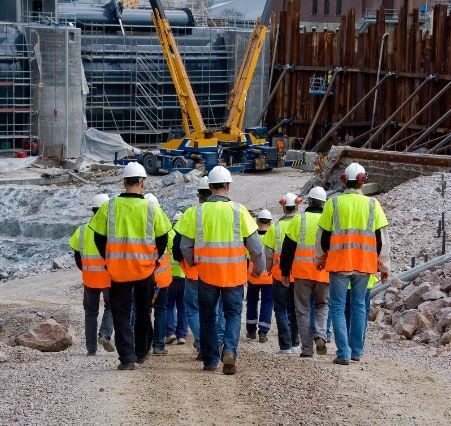
Industry Overview
              M&A Transactions & Performance
                                             NORTH AMERICAN ENGINEERING & CONSTRUCTION M&A ACTIVITY
                                   2.5                                                                                                                                 25
                                                        2.2

                                                                                                                                                                            Transaction Volume (Number of Deals)
                                   2.0                                                                                                                                 20
Transaction Value ($ Billions)

                                                                                                                                   1.6
                                   1.5                                                1.4                                                              1.4             15
                                                                                                                                                               1.3

                                   1.0    0.9                  0.9                                                                        0.9                          10
                                                                                                                           0.9

                                                                                            0.5                    0.5                          0.6
                                   0.5                                       0.4                                                                                       5
                                                  0.3                                                       0.4
                                                                       0.2

                                     -                                                                                                                                 -
                                          Q2      Q3    Q4     Q1      Q2    Q3       Q4    Q1              Q2     Q3       Q4     Q1     Q2    Q3     Q4       Q1

                                                              Canadian Transaction Value                           US Transaction Value
                                                              Canadian Transaction Volume                          US Transaction Volume

              Source: Capital IQ. Data as of March 31, 2022.
              Above noted mid-market M&A activity includes disclosed transactions not exceeding a total transaction value of $500 million. All figures are in CAD.
              Transaction value is only inclusive of total transaction values which have been disclosed within Capital IQ.

       Q1 Transactions (Canada)                               Q1 Transaction Value (Canada)                        Q1 Transaction Value (US)             Q1 Transactions (US)

                                         1                       $145 million                                            $1.2 billion                                11
                                 (-45% vs. Q4 2021)                  (+434.5% vs. Q4 2021)                               (-10.7% vs. Q4 2021)                (-50% vs. Q4 2021)
              Engineering and construction merger and acquisition (M&A) activity in Q1 2022 exceeded $1.2 billion in disclosed
              transaction value across 12 deals in Canada and the US. US transactions accounted for 11 of these deals,
              representing the largest quarterly volume in the past four years. The largest transaction in the quarter was US
              based, and involved CalPortland Company’s acquisition of certain West Coast cement and ready mixed concrete
              operations of Martin Marietta Materials, Inc. for $317 million. In the last 12 months, the majority of acquirers have
              been strategic. Strategic acquisitions continue to drive industry activity, as participants target expansion into new
              markets and mitigating skilled labour shortages.

                                             Private Equity Deal Multiples                                                     PE Sponsored Multiples
                                 10.0x           (Engineering Services)                                     8.0x             (Heavy & Civil Construction)            7.1x
                                                                                   7.9x                                                               6.5x
                                  8.0x                                                                      6.0x                         5.3x
                                                                                                                          4.9x
                                                                                              EV / EBITDA
             EV / EBITDA

                                  6.0x          5.1x           5.1x
                                                                                                            4.0x
                                  4.0x
                                                                                                            2.0x
                                  2.0x

                                  0.0x                                                                      0.0x
                                            10 - 25         25 - 50        50 - 250                                      10 - 25      25 - 50      50 - 100      50 - 250
                                          Total Enterprise Value Range ($ millions)                                        Total Enterprise Value Range ($ millions)
              Source: GF Data. Data as of April 2022.                                                                                                                    Page 2
Select Recent M&A Transactions

                                                         • Brookfield Renewable Corporation owns and
                          Closed       Feb. 7, 2022        operates a portfolio of renewable energy power
                                                           generating facilities primarily in the US, Europe,
                          EV           $819.1 million      Colombia, and Brazil.
       Acquired                                          • Urban Grid Solar develops and operates utility-scale
                          EV/EBITDA    N/A                 solar and renewable energy projects.
                                                         • The acquisition will allow Brookfield Renewable
                          Location     Toronto, ON         Corporation to strengthen its renewable energy
                          (Vendor)
                                                           service offerings.

                                                         • Orion Energy Systems, Inc. researches, designs,
                                                           develops, manufactures, markets, sells, installs, and
                          Closed       Jan. 1, 2022        implements energy management systems for
                                                           commercial office and retail, exterior area lighting,
       Acquired           EV           $5.6 million        and industrial applications in North America.
                                                         • Stay-Lite Lighting Inc. provides interior/exterior
                          EV/Revenue   0.5x                lighting maintenance and electrical services to
                                                           industrial, commercial, and retail businesses in the
                          Location     Manitowoc,          United States.
                          (Vendor)     WI
                                                         • The acquisition allows Orion Energy Systems to
                                                           expand their service capabilities to a larger customer
                                                           base.

                                                          • MYR Group Construction Canada, Ltd. constructs
                          Closed        Jan. 4, 2022        electrical transmission, substation, and distribution
                                                            systems for electric utilities and government agencies.
       Acquired           EV            $145.4 million    • Powerline Plus Ltd. offers engineering, procurement,
                                                            and construction services to utility companies.
                          EV/EBITDA     N/A               • The acquisition will allow MYR Group Construction
                                                            Canada Ltd. to strengthen its market share, while
                          Location      Henderson,          being able to expand its service offerings
                          (Vendor)      CO                  simultaneously.

                                                         • Johns Lyng Group Limited provides integrated
                                                           building services in Australia and internationally.
                          Closed       Jan. 1, 2022        systems for electric utilities and government agencies.
                                                         • Reconstruction Experts Inc., is a general contracting
                          EV           $254.3 million      company that provides reconstruction, restoration,
       Acquired                                            renovation, and remodeling services for residential,
                          EV/EBITDA    7.8x                commercial, and industrial properties in Colorado,
                                                           California, Texas, Arizona, Nevada, and Wyoming.
                          Location     Australia         • The acquisition will allow Johns Lyng Group Limited
                          (Vendor)
                                                           to expand their service offerings in existing and new
                                                           geographic markets.

Source: Capital IQ.
All figures are in CAD.                                                                                     Page 3
Industry Overview
Engineering Services in Canada
The Engineering Services industry applies the physical laws and principles of engineering in the design,
development and use of machines, materials, instruments, structures, processes, and systems.

                                                                                                 Products and Services
                         Industry Glance
                                                                                                 Segmentation (2022)
                             2022 Revenue

                         $35.7B                                                                            13%
                                                                                                                         30%
                    Annual Growth 2017 – 2022                                                        8%

                              2.1%
             Projected Annual Growth 2022 – 2027                                                     23%

                              2.1%                                                                                25%

                   Number of Businesses in 2022                                                      Advisory Services

                         28,020                                                                      Energy and Mining
                                                                                                     Residential and Commercial
                                                                                                     Power Generation
                                                                                                     Transportation

Heavy Engineering Construction in Canada
Heavy Engineering Construction performs new construction, reconstruction, rehabilitation, and repairs.

                         Industry Glance                                                         Products and Services
                                                                                                 Segmentation (2021)
                              2021 Revenue

                         $53.9B                                                                      9%
                                                                                                           9%

                     Annual Growth 2016 – 2021                                                                           36%

                              1.8%                                                               14%

              Projected Annual Growth 2021 – 2026

                             2.5%
                                                                                                       19%       14%

                   Number of Businesses in 2021

                            2,742
                                                                                   Electric Power                Land Transportation
                                                                                   Repair and Maintenance        Mining Engineering
                                                                                   Marine and Waterworks         Other

Source: IBISWorld Industry Report 54133CA Engineering Services in Canada March 2022.
Source: IBISWorld Industry Report 23799CA Heavy Engineering Construction in Canada. December 2021.                                    Page 4
Macroeconomic Indicators
      Key external drivers that affect the Engineering & Construction industry in Canada include the value of non-
      residential construction (expenditures on office buildings, hospitals, factories, power plants, mining shafts,
      communication lines, farms, railroads, and schools), aggregate private investment (investment in gross fixed capital
      formation and inventories), government expenditure and investment (the total value of services produced by
      federal, provincial, and local governments as well as investment in fixed assets), and the interbank overnight
      lending rate in Canada.

      Canada’s major cities such as Toronto experienced another quarter of acceleration in house prices. Supply was
      scarce in the winter months compared to demand, which resulted in multiple bidding wars driving up prices.

      However, there may be some easement on housing price acceleration due to a combination of interest rate
      increases and new policies. In March 2022, the Bank of Canada increased interest rates by 0.25%, followed by
      another 0.5% increase subsequent to Q1 in April 2022. In addition, the Federal Government is proposing new
      measures to improve affordability such as a temporary ban for purchasing homes on individuals and companies
      who are not Canadian residents. Lastly, inflation reached a high of 6.7%, putting downward pressure on Canadian’s
      budgets and ability to purchase a home.

                             VALUE OF NON-RESIDENTIAL                                                VALUE OF RESIDENTIAL CONSTRUCTION -
                              CONSTRUCTION - CANADA                                                                CANADA
                       200                                                                     200
                                                                                               175
                       150                                                                     150
       $CAD Billions

                                                                               $CAD Billions

                                                                                               125
                       100                                                                     100
                                                                                                75
                        50                                                                      50
                                                                                                25
                         -                                                                       -

                                  Historical      Forecast                                                 Historical   Forecast

GOVERNMENT EXPENDITURE AND INVESTMENT                                                                AGGREGATE PRIVATE INVESTMENT -
              - CANADA                                                                                          CANADA
                600                                                                            475
                575                                                                            450
                550
                525                                                                            425
                                                                               $CAD Billions

                                                                                               400
$CAD Billions

                500
                475                                                                            375
                450
                                                                                               350
                425
                400                                                                            325
                375                                                                            300
                350                                                                            275
                325
                300                                                                            250

                                   Historical       Forecast                                               Historical   Forecast
      Source: IBISWorld Business Environment Reports.
      “F” indicates forecast. “CAGR” indicates compound annual growth rates.                                                        Page 5
Public Comparable Analysis
Growth, Margins & Multiples

                        LTM REVENUE GROWTH                                                         NTM REVENUE GROWTH
                    Heavy Civil        10%                      AVG: 11.0%                      Heavy Civil      4%                AVG: 8.7%

                  Engineering          4%                                                      Engineering       6%

 Construction Engineering              16%                                         Construction Engineering      9%

         Aggregate Supplier            14%                                              Aggregate Supplier       15%

                                   0%          5%       10%       15%        20%                               0%      5%          10%     15%       20%

                         LTM EBITDA MARGIN                                                         NTM EBITDA MARGIN
                      Heavy Civil        9%                                                       Heavy Civil         7%
                                                              AVG: 15.7%                                                             AVG: 13.2%

                    Engineering          11%                                                     Engineering          10%

   Construction Engineering              14%                                        Construction Engineering          10%

           Aggregate Supplier            29%                                              Aggregate Supplier          27%

                                     0%        10%       20%        30%      40%                                0% 5% 10% 15% 20% 25% 30%

                        LTM EV/EBITDA                                                              NTM EV/EBITDA
                   Heavy Civil         6.9x                                                      Heavy Civil        6.0x
                                                                    AVG: 10.9x                                                                   AVG: 10.2x

                  Engineering          13.9x                                                    Engineering         13.3x

 Construction Engineering              8.9x                                        Construction Engineering         8.9x

         Aggregate Supplier            14.0x                                             Aggregate Supplier         12.7x

                                  0.0x          5.0x        10.0x         15.0x                                0.0x         5.0x         10.0x       15.0x

Source: Capital IQ. Data as of March 31, 2022.
Valuation details provided on page 8.
“LTM” refers to last twelve months. “NTM” refers to next twelve months.                                                                             Page 6
Public Comparable Analysis
Performance Analysis

                                Engineering and Construction Peer Group
                                                 Share Price Performance – Q1 2022
                                                                                     7.08%

                                                                                     -7.63%
                                                                                     -10.08%

                                                                                     -13.75%

                                                  Share Price Performance – LTM
                                                                                     22.85%

                                                                                     10.70%
                                                                                     5.21%

                                                                                     -8.25%

                                                  Historical LTM EV/EBITDA – LTM

                                                                                       16.05x

                                                                                       10.02x
                                                                                       9.11x

                                                                                       6.87x

Source: Capital IQ. Data as of March 31, 2022.
Further details provided on page 8.
“LTM” refers to last twelve months.                                                  Page 7
Public Comparable Analysis
 Trading Multiples & Operating Statistics

    We have selected a group of publicly traded engineering and construction entities for this high-level analysis.
    These public companies help act as a proxy for the industry and provide strong industry context.

                                                                              LTM Operating Figures              NTM Consensus Estimates                Valuation
                                         Market        Enterprise               Revenue               EBITDA   Revenue    EBITDA     NTM          LTM
Company                               Capitalization     Value      Revenue     Growth     EBITDA     Margin   Growth     Margin   EV/EBITDA   EV/EBITDA LTM EV/REV
Heavy Civil
EMCOR Group, Inc.                        $7,406         $7,056      $12,724      15.8%     $1,074     8.4%     (100.0%)    N/A       8.3x        6.5x           0.6x
Primoris Services Corporation            $1,585         $2,366      $4,426       0.2%       $472      10.7%     7.1%      8.0%       6.4x        5.1x           0.5x
Construction Partners, Inc.               $1,717        $2,042      $1,272       25.4%      $134      10.5%     16.9%     11.3%      12.5x       15.5x              1.6x
Tutor Perini Corporation                  $689          $1,772      $5,874       (12.7%)    $549      9.3%      0.3%       6.1%       5.1x       3.3x           0.3x
Granite Construction Incorporated        $1,879         $1,633      $3,735       (2.2%)     $181      4.8%      5.9%      7.6%        5.7x       8.5x           0.4x
Sterling Construction Company, Inc.       $1,011         $1,515     $2,093       16.0%      $223      10.7%     15.2%     10.5%      6.3x        7.2x           0.8x
Aecon Group Inc.                         $1,032         $1,279      $4,209       15.3%      $161      3.8%      4.4%      6.2%       4.8x        7.5x           0.3x
Bird Construction Inc.                    $490           $453       $2,220       47.6%      $122      5.5%      13.1%     4.5%       4.0x        3.7x           0.2x
Median                                   $1,309         $1,703      $3,972       15.6%     $202       8.9%      6.5%      7.6%       6.0x        6.9x           0.5x
Mean                                     $1,976         $2,264      $4,569       13.2%     $364       8.0%     (4.6%)     7.8%       6.6x        7.2x           0.6x

Engineering
Jacobs Engineering Group Inc.           $22,232         $26,509     $17,980      4.9%      $2,176     12.1%     12.4%     9.5%       14.6x       13.5x              1.5x
WSP Global Inc.                          $19,564        $21,422     $10,279      16.8%     $1,245     12.1%     (16.1%)   17.1%      14.5x       17.2x              2.1x
AECOM                                    $13,554        $16,110     $16,824      (0.2%)    $1,373     8.2%      7.5%      6.5%       14.0x       11.9x              1.0x
KBR, Inc.                                $9,532         $11,745     $9,478       33.4%     $1,087     11.5%     (9.2%)    10.1%      14.5x       10.5x              1.3x
Stantec Inc.                             $6,986         $8,694      $3,636       (1.3%)     $527      14.5%     19.5%     15.9%      12.6x       16.5x          2.4x
SNC-Lavalin Group Inc.                   $5,284         $6,857      $7,371       5.2%       $479      6.5%      0.3%      9.2%        9.7x       14.3x          0.9x
Fluor Corporation                        $5,058         $3,971      $15,736      (12.2%)    $528      3.4%      11.2%     3.2%        7.2x       7.6x           0.3x
NV5 Global, Inc.                         $2,571         $2,733       $894        7.2%       $176      19.7%     12.6%     18.4%      15.3x       15.7x              3.1x
Willdan Group, Inc.                       $493           $626        $448        (9.5%)     $23       5.2%      31.4%      9.1%      12.0x       27.3x              1.4x
Mistras Group, Inc.                       $244           $539        $855        16.7%      $84       9.8%      8.2%       9.1%      6.3x        6.2x           0.6x
Median                                   $6,135         $7,776      $8,425       5.0%      $528       10.6%     9.7%      9.4%       13.3x       13.9x          1.3x
Mean                                     $8,552         $9,921      $8,350       6.1%      $770       10.3%     7.8%      10.8%      12.1x       14.1x          1.5x

Construction Engineering
Quanta Services, Inc.                   $23,445         $28,162     $16,426      15.9%     $2,448     14.9%    26.6%      10.1%      13.8x       11.7x              1.7x
MasTec, Inc.                             $8,121         $10,520     $10,063      25.8%     $1,876     18.6%    25.4%      9.6%       8.9x        5.7x               1.1x
Dycom Industries, Inc.                   $3,522         $4,242      $3,995       (2.1%)     $378      9.5%      9.0%      9.8%       10.2x       11.5x              1.1x
MYR Group Inc.                           $1,991         $1,920      $3,174       9.5%       $216      6.8%      14.0%     6.6%       8.6x        8.9x           0.6x
Argan, Inc.                               $796           $201        $648        29.9%      $88       13.6%     11.8%     9.5%       2.4x        2.2x           0.3x
Median                                   $3,522         $4,242      $3,995       15.9%     $378       13.6%    14.0%      9.6%       8.9x        8.9x               1.1x
Mean                                     $7,575         $9,009      $6,861       15.8%     $1,001     12.7%    17.3%      9.1%       8.8x        8.0x           1.0x

Aggregate Supplier
Martin Marietta Materials, Inc.         $29,982         $36,827     $6,658       19.5%     $1,840     27.6%     21.5%     28.5%      16.7x       18.4x              5.8x
Vulcan Materials Company                $30,455         $36,017     $7,521       23.6%     $1,953     26.0%     22.1%     25.4%      16.3x       19.1x          5.2x
Eagle Materials Inc.                     $6,331         $7,401      $2,267       13.1%      $783      34.5%     12.3%     35.4%      8.3x        9.6x           3.3x
Summit Materials, Inc.                   $4,604         $6,220      $3,049       3.3%       $683      22.4%     0.5%      22.6%       9.1x       9.2x               2.1x
Median                                  $18,156        $21,709      $4,854       16.3%     $1,312     26.8%    16.9%      26.9%      12.7x       14.0x          4.3x
Mean                                    $17,843         $21,616     $4,874       14.9%     $1,315     27.6%     14.1%     28.0%      12.6x       14.1x          4.1x

 Source: Capital IQ. Data as of March 31, 2022.
 “LTM” refers to last twelve months. “NTM” refers to next twelve months.                                                                                      Page 8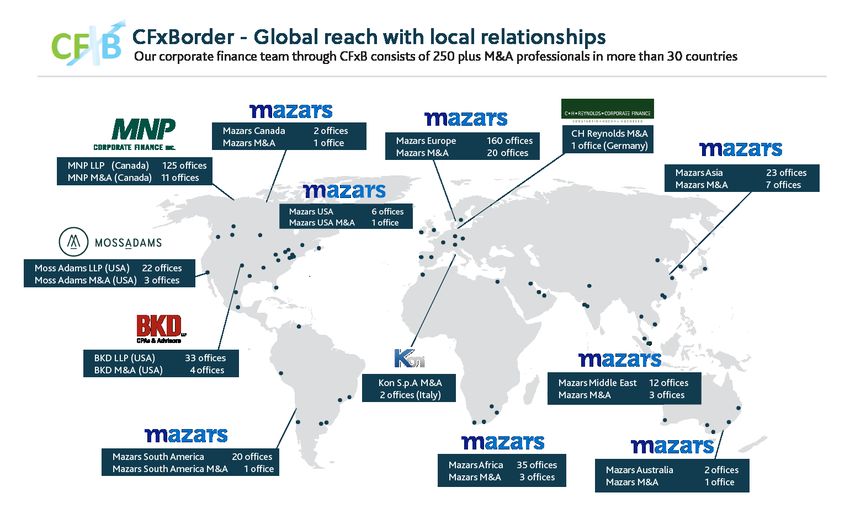
About Us

MNP Corporate Finance (MNPCF) has a dedicated team of over 100            Recently Closed Deals
M&A and due diligence professionals across Canada. MNPCF
works with clients in virtually all industries as they prepare, plan           (National)
and execute transactions.

Our typical transactions range in value between $3 million and
$300 million.

            Local and International Reach
MNP is a participating firm within Praxity, a unique global alliance of
independent accounting/advisory firms created to answer global
business needs. As a member of Praxity, we are able to offer access
to corporate finance, accounting and tax advisory services
worldwide. We are also affiliated with Corporate Finance Cross
Border, which consists of 250+ M&A professionals in more than 30
countries.

                              Services
           • Divestitures              • Due Diligence
           • Acquisitions              • Transaction Advisory
           • Debt Financing              Services

                                                                                             Page 9
About Us

                       Deal Experience                                Recently Closed Deals
                                                                           (National)
Since our inception, our team has advised on hundreds of
transactions, in a wide range of industries with diverse enterprise
values. In the past eight years alone we have completed over 200
transactions worth over $3.5 billion (not including due diligence
engagements).

                    Industry Experience
      •   Food & Beverage                •   Transportation
      •   Retail & Distribution          •   Construction
      •   Manufacturing                  •   Software
      •   Agriculture                    •   Financial Services
      •   Automotive                     •   Technology
      •   Materials                      •   Energy
      •   Health Care                    •   Oilfield Services
      •   Pharmaceutical                 •   Real Estate

                    Hands-on Approach
Current M&A transactions require a hands-on approach from start
to finish including the active engagement of senior resources. Our
senior resources are dedicated to our clients and are available as
necessary and appropriate. We keep our clients regularly informed
of the engagement status, issues we are encountering, successes
and overall progress.

              Integrated Service Offering
We draw on the vast experience and deep specialist knowledge
network of our partners locally, nationally and internationally as
specialty issues arise, such as pre-transaction tax planning,
transaction structuring, estate planning, valuation, due diligence,
performance improvement and risk management.

                                                                                        Page 10
Leadership Team
Transaction Leadership
Brett Franklin Aleem Bandali Mark Regehr Mike Reynolds
President Managing Director Managing Director Managing Director
Winnipeg Vancouver Edmonton Calgary
Brett.Franklin@mnp.ca Aleem.Bandali@mnp.ca Mark.Regehr@mnp.ca Mike.Reynolds@mnp.ca
204.336.6190 778.374.2140 780.969.1404 587.702.5909
Erik St-Hilaire Stephen Shaw Dan Porter Kevin Tremblay
Managing Director Managing Director Managing Director Managing Director
Winnipeg Toronto Toronto Toronto
Erik.St-Hilaire@mnp.ca Stephen.Shaw@mnp.ca Dan.Porter@mnp.ca Kevin.Tremblay@mnp.ca
204.336.6200 416.515.3883 416.515.3877 647.943.4051
Jon Edgett Patrick Khouzam Jonathan Banford Éric Grondin
Managing Director Managing Director Managing Director Managing Director
Waterloo Montreal Chicoutimi Sherbrooke
Jon.Edgett@mnp.ca Patrick.Khouzam@mnp.ca Jonathan.Banford@mnp.ca Éric.Grondin@mnp.ca
519.772.7460 514.228.7874 418.696.3924 819.823.3290
Due Diligence Leadership
Jean-Raymond Lafond Craig Maloney Johnny Earl John Caggianiello
Managing Director Managing Director Managing Director Managing Director
Drummondville Halifax Vancouver Toronto
Jean-Raymond.Lafond@mnp.ca Craig.Maloney@mnp.ca Johnny.Earl@mnp.ca John.Caggianiello@mnp.ca
819.473.7251 902.493.5430 604.637.1504 416.513.4177
MNPCF.ca
Page 11You can also read