Influence of road traffic noise peaks on reading task performance and disturbance in a laboratory context
←
→
Page content transcription
If your browser does not render page correctly, please read the page content below
Acta Acustica 2022, 6, 3
Ó C. Lavandier et al., Published by EDP Sciences, 2022
https://doi.org/10.1051/aacus/2021057

                                                                                                                        Available online at:
                                                                                                         https://acta-acustica.edpsciences.org

    SCIENTIFIC ARTICLE

Influence of road traffic noise peaks on reading task performance
and disturbance in a laboratory context
Catherine Lavandier1,*         , Mehdi Regragui1,2, Romain Dedieu1                , Carine Royer3       , and Arnaud Can2
1
  Laboratoire ETIS, CY Cergy Paris University, ENSEA, CNRS, UMR8051, 95000 Cergy, France
2
  UMRAE, Univ Gustave Eiffel, IFSTTAR, CEREMA, 44340 Bouguenais, France
3
  Laboratoire Paragraphe EA349, CY Cergy Paris Université, 95000 Cergy, France

            Received 30 March 2021, Accepted 13 December 2021

            Abstract – The influence of fluctuating road traffic noise on perceived disturbance during a reading task as
            well as on performance, inside a living room with closed windows, is presented in this paper. Sixteen 2-min
            sound sequences were created combining two variables: the number of events (four levels varying from one
            to four car pass-bys) and the peak emergence above the background noise (four levels with a 5 dB(A) step)
            keeping limited variations of LAmax, 1s. The noise impact was evaluated through a reading task of texts synchro-
            nized with the sound sequences, for participants classified into fast or slow readers, and sensitive or non-
            sensitive to noise. The comprehension rate of the texts decreases as the background sound level increases.
            The reading speed decreases during the rising front of a peak, and goes back to its former regular reading speed
            during the descending front of the peak. This slowdown during the rising front reaches 14% for slow readers.
            The declared disturbance is higher for slow readers compared to fast readers, and higher for noise sensitive
            persons compared to non-sensitive persons. The influence of the acoustic indicators on the reading disturbance
            is very small compared to the influence of personal factors. There is even no influence of the number of events on
            this disturbance.

            Keywords: Noise disturbance, Reading task performance, Peak noise, Reading speed, Emergent events

1 Introduction                                                              difference between background noise and emergences is high
                                                                            [9]. Then, indicators associated with the intermittent nature
    Environmental noise is recognized as one of the most                    of the events such as their emergence or their number could
important nuisances for citizens. The burden of disease from                complement classical averaged indicators [10–12]. This is
environmental noise has been quantified: sleep disturbance                   accentuated during calm periods as night, when the back-
and annoyance are the largest health effects, with                          ground noise is low and events are rare [13, 14].
903 000 years and 654 000 years disability-adjusted life-years                   Annoyance is itself multi-factorial. Noise annoyance is
in Europe, respectively largely before cardiovascular disease,              defined by Guski et al. [15] as “a psychological concept
cognitive impairment in children and tinnitus [1]. Moreover,                which describes a relation between an acoustic situation
sleep disturbance and annoyance mostly relate to road traf-                 and a person who is forced by noise to do things she/he does
fic noise. Even if aircraft noise is more annoying than road                 not want to do, who cognitively and emotionally evaluates
traffic noise for the same noise level [2], road traffic is cited             this situation and feels partly helpless”. The annoyance felt
by a majority of people as the most annoying noise source,                  by an inhabitant is described by Ouis [16] as “a feeling
since a large number of citizens are more exposed to road                   of discomfort, like a nuisance or irritation caused by partic-
traffic noise than aircraft noise [3]. The acoustic indicators               ular sounds”. Its process, described by Paunovic [17] and
mainly used to evaluate the impact of road traffic noise                     Miedema [18], can be defined as a form of psychological
are averaged indicators [4, 5]. However, road traffic noise                  stress that triggers different personal resources when one
is known to vary with time [6]. Thus noise annoyance is                     is awake. As a consequence, when the particular sounds
impacted not only by the average noise level and the type                   are repeated during long periods, noise annoyance has a
of source, but also by the fluctuation of noise levels [7, 8].               very individual dimension, and a large part of it can be
The pass-by of a single very noisy vehicle, can be a source                 explained by extra-auditory factors [19]. Personal factors
of annoyance, especially in low-traffic areas, where the                     such as sensitivity to noise and situational factors such as
*Corresponding author: catherine.lavandier@cyu.fr,                          the coping strategies an individual may develop when
catherine.lavandier.pro@gmail.com                                           exposed to noise or the ability to mentally fade out the
This is an Open Access article distributed under the terms of the Creative Commons Attribution License (https://creativecommons.org/licenses/by/4.0),
              which permits unrestricted use, distribution, and reproduction in any medium, provided the original work is properly cited.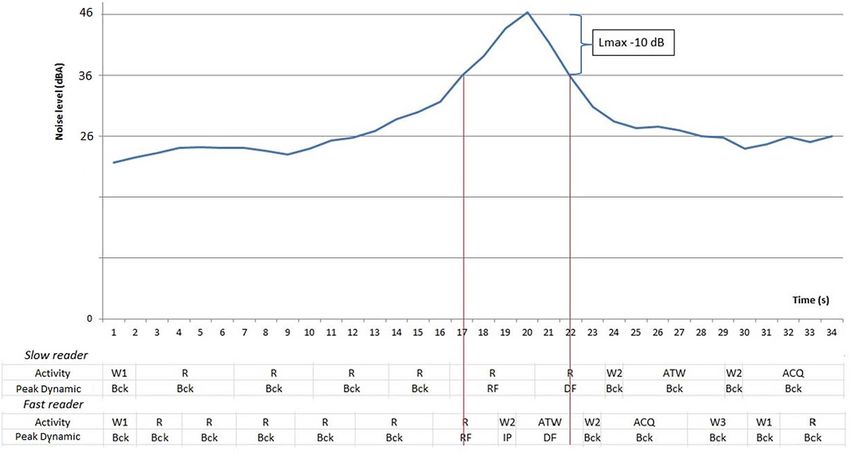
2                                       C. Lavandier et al.: Acta Acustica 2022, 6, 3

sound [20] are particularly influent. Based on literature          (A). To avoid confusion between background noise of the
study, Schreckenberg et al. [21] hypothesized that annoy-         sound sequences and background noise of the laboratory,
ance can be been divided into three dimensions: noise-            this latter is called “silence” in this paper. The Vector Based
related disturbances, emotional and attitudinal responses         Amplitude Panning (VBAP) technique was used to control
to the sound, and perceived lack of coping capacity.              the spatial distribution of the sounds with the loudspeaker
    At a short time-scale, noise disturbs because it masks        gains [26]. The gains were set to simulate a traffic road noise
other sounds, makes intellectual activities difficult, disturbs    coming from a closed double-glazed window (4–16–4 mm)
attention and concentration, causes physiological arousal,        in a second-floor apartment. As the sound sequences were
and triggers negative emotional reactions. Then, to under-        generated with a software which uses monophonic sound
stand short-term annoyance related to noise peaks, it is          files (see Sect. 2.2), there was no moving effect of a pass-
interesting to look at the reactions of individuals to changes    by driving from one side to the other. The fixed localisation
in noise levels over a short-time scale during an activity.       of the source was simulated from the bottom side of the
The distracting effect of noise is particularly noticeable        window, in front of the participant.
when the performed task requires memory work [22]. From
a cognitive point of view, several studies show the impact of     2.2 Sound sequences
a noisy environment on concentration and the performance
of a cognitive task (see [23] for a literature synthesis).            The sound sequences were simulated based on real road
Different mechanisms can occur when an unexpected sound           traffic sounds, in order to control their acoustical properties.
event occurs, which can even stop the action of a listener        The sequences consisted of background noise, to which were
under certain conditions [24].                                    added a various number of car pass-bys, generated with the
    In this paper, the perceived disturbance dimension of the     SimScene software [27]. SimScene1 is an open source library
annoyance due to fluctuating road traffic sounds is studied         developed in Matlab that allows the simulation of sound
in a laboratory experiment. The negative effects of urban         scenes in a monophonic format as the additive composition
sound environments are studied through their cognitive            of background and sound sources, using a database of
impact and through the disturbance felt by the participants.      recordings. In this study, the background noise corresponds
During the experiment, participants were exposed to sound         to a continuous traffic flow that was recorded at 100 m from
sequences that contained different numbers of car pass-bys        a urban motorway in Cergy (France), with the omnidirec-
with different levels of emergence, during a common reading       tional setting of a CMC6 Schoeps microphone on a portable
activity in a laboratory mimicking a living room. Regarding       recorder Tascam HD-P2. The car pass-bys were recorded
the cognitive impact, the hypothesis is that fluctuating           with an ORTF system composed of two Schoeps CCM
sounds, such as car pass-bys, can locally modify the reading      4 microphones on a Tascam DR-100 near a two-line road
speed of a text and globally change the ability to understand     in a very calm environment in Rezé (France). All isolated
the read text. In addition, the relative influence of the acous-   sound sources are very similar in terms of acoustic charac-
tic characteristics of the sequences and individual partici-      teristics as they correspond to different pass-bys of the same
pant factors on the disturbance to the reading task are           car driving at the same constant speed and at the same
investigated. Section 2 describes the methodology. The            distance from the recording point. In order to mix back-
results of the experiment are presented in Section 3. Section 4   ground noise (recorded in monophonic format) and isolated
discusses the results and Section 5 elaborates conclusions on     car pass-bys (recorded in stereo format) with the SimScene
the consequences in terms of assessment of disturbance due        tool, stereo recordings were transformed into monophonic
to road traffic noise peaks.                                       wave files by mixing the two channels with the Reaper2
                                                                  software.
                                                                      Sixteen 2-min sound sequences were created with the
2 Methodology                                                     following characteristics of an outdoor environment based
                                                                  on a complete two factor design:
2.1 Laboratory and apparatus
                                                                       Emergence of peak levels above the background
    The laboratory where the experiment took place is                   noise in dB(A) calculated as the difference between
located in the housing part of “la Maison Internationale                LAmax, 1s and background noise LA90. Four emergence
de la Recherche (MIR)” at CY Cergy Paris University                     levels were considered: +10 dB(A); +15 dB(A);
(CYU). It is a second (and last) floor apartment designed                +20 dB(A) and +25 dB(A).
to reproduce a sound environment in the centre of the living           Number of peaks: 1; 2; 3 and 4. This corresponds to
room [25]. For this experiment, three active loudspeakers               hourly traffic of between 30 and 120 vehicles per hour,
(Yamaha HS7-I) were placed around the real closed                       which is representative of residential areas with low
window, facing the listener (Fig. 1). The experiment was                traffic volumes.
conducted with the shutters closed to ensure that the
natural variable light exposure of the laboratory would               If one defines a pass-by event as the period when the
not influence the participants’ responses. When there was          sound level is above the threshold of LAmax – 10 dB(A)
no sound sequence reproduced through loudspeakers in              [28, 29], one can assume that every peak in this study is a
the laboratory but with the three loudspeakers turned on,         1
                                                                      https://bitbucket.org/mlagrange/simscene
                                                                  2
the equivalent sound level of the background was 20 dB                https://www.reaper.fm/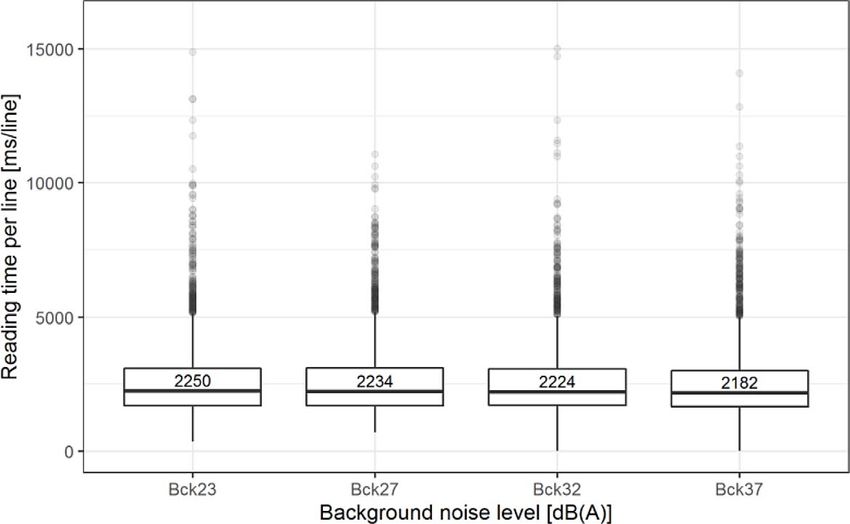
C. Lavandier et al.: Acta Acustica 2022, 6, 3                                           3

Figure 1. Picture of the experimental laboratory.

Table 1. Acoustic characteristics of the 16 sound sequences.

Sequence      Number of        Background or        LA90 dB(A)       Inside Emergence           LAmax,   1s   dB(A)   LAeq dB(A)
             peaks (NoP)      Emergence (BoE)                     (LAmax, 1s – LA90) dB(A)
1                  1            Bck37_Em9               36.9                 9.3                     46.2                39.2
2                  2            Bck37_Em9               38.4                 8.9                     47.2                40.9
3                  3            Bck37_Em9               37.5                 9.6                     47.1                40.2
4                  4            Bck37_Em9               38.2                 9.0                     47.2                41.3
5                  1            Bck32_Em14              32.0                 14.3                    46.4                35.3
6                  2            Bck32_Em14              33.2                 14.2                    47.4                37.3
7                  3            Bck32_Em14              32.2                 13.9                    46.1                36.8
8                  4            Bck32_Em14              32.4                 14.2                    46.6                37.7
9                  1            Bck27_Em19              27.4                 19.2                    46.6                32.6
10                 2            Bck27_Em19              28.5                 18.9                    47.4                35.2
11                 3            Bck27_Em19              28.0                 18.1                    46.1                35.3
12                 4            Bck27_Em19              27.5                 18.9                    46.4                36.2
13                 1            Bck23_Em24              22.8                 24.0                    46.7                31.2
14                 2            Bck23_Em24              23.6                 23.7                    47.3                34.0
15                 3            Bck23_Em24              22.4                 23.7                    46.1                34.4
16                 4            Bck23_Em24              22.8                 23.5                    46.3                35.6

similar event for all the sequences whatever the background      during the training session of the test (see Sect. 2.3). Con-
is. The sound sequences were then filtered through a              sequently, participants were exposed to the full range of
conventional double-glazed window (4–16–4 mm) to create          the (BoE) and (NoP) parameter values at the beginning
the sound spectrum expected within the room once                 of the experiment before starting the test.
windows are closed. The filter had an insulation of 30.7 dB
at 100 Hz and 37.8 at 1 kHz. This operation modified a little     2.3 Test protocol
bit the calculation of the inside emergence (Tab. 1).
    The similarity between all LAmax, 1s made the emergence          During the test, participants were exposed to the 16
values correlated with the background noise (Tab. 1). In         sound sequences of 2 min each, meanwhile they were asked
order to ease the understanding of the results, the first fac-    to read short texts. In details, four different texts were read
tor is named “Background or Emergence” (BoE) with four           during each sound sequence. In total, each participant read
levels (Bck23_Em24, Bck27_Em19, Bck32_Em14 and                   4  16 different texts during the experiment. The presenta-
Bck37_Em9). The second is just named “Number of Peaks”           tion order of the texts was randomized. Each text was bro-
(NoP) with four levels (1, 2, 3 and 4). Table 2 presents the     ken down into six lines. During the test, texts were scrolled
third octave band spectra for a representative car pass-by       line by line by the participant. Each line had a length of
and for a continuous traffic flow (background noise of the         about six words. In order to measure the reading speed,
sequences 1 and 13 as examples).                                 texts and audio files were synchronized, and the reading
    The two extreme sound sequences are represented in           time of each line was recorded. After having read a six-line
Figure 2. These were the two sound sequences broadcasted         text, participants had to answer two questions: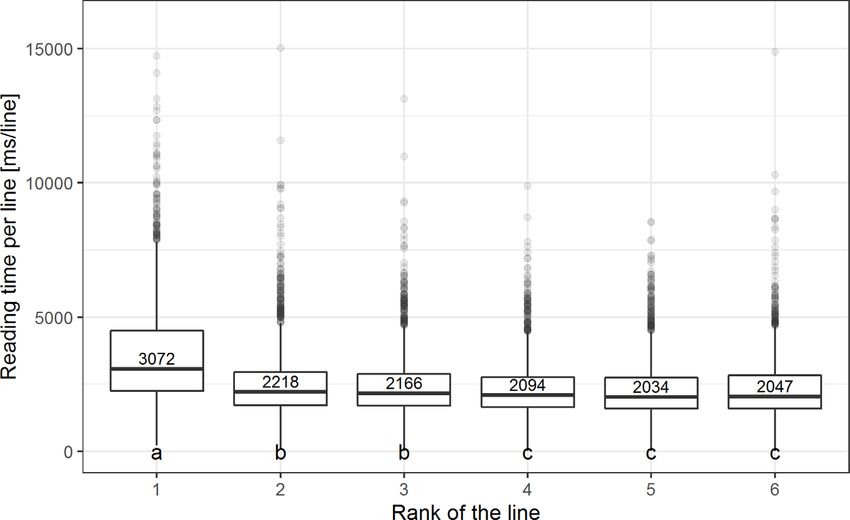
4                                        C. Lavandier et al.: Acta Acustica 2022, 6, 3

Table 2. Inside third octave band spectra for a car pass-by calculated over 7 s and for the sequences 1 and 13 during the continuous
traffic flow (background noise calculated over 7 s too).

Frequencies Hz            Car pass-by dB               Background noise                Background noise                 Silence of the
                                                      for sequence 1 – dB            for sequence 13 – dB             laboratory – dB
100                             41.9                          41.4                            28.5                          24.5
125                             40.2                          39.5                            27.5                          24.5
160                             43.0                          39.0                            26.1                          22.1
200                             43.1                          39.4                            25.7                          20.1
250                             37.6                          36.0                            22.2                          16.2
315                             36.7                          30.0                            16.8                          12.3
400                             31.1                          24.6                            12.7                          10.0
500                             29.5                          21.4                            11.1                           9.5
630                             29.8                          22.5                            11.8                          10.1
800                             30.8                          24.5                            12.4                           9.4
1000                            35.4                          28.4                            14.7                           8.9
1250                            32.2                          25.7                            12.5                           8.1
1600                            27.3                          21.9                            10.3                           7.8
2000                            22.4                          16.6                            8.1                            7.1
2500                            15.7                          10.5                            6.7                            6.5
3150                            14.6                           8.6                            6.1                            6.0
4000                             9.7                           8.8                            6.5                            6.4

Figure 2. Training session sequences: LAeq, 1s for the sound sequence with 4 peaks of an emergence of 24 dB(A) on the left and LAeq, 1s
for the sound sequence with 1 peak of an emergence of 9 dB(A) on the right.

     The first question consisted of the recognition of a tar-       cognitive load of the reader, the time for reading a line
      get word. It might be said whether it was French or            and the performance on text comprehension have been
      not. Non-French words were invented words. All                 studied as indirect measures of noise disturbance. Table 3
      French target words had a contextual proximity with            presents an example of the process for one text and its
      the text.                                                      associated questions. A first fixed waiting period W1
     The second question was a question of comprehension            (1500 ms) gave the participant time to be ready for the
      on the text that had just been read. The participant           task, then the participant read the six lines and waited
      had to decide whether the statement he was reading             again 500 ms (W2) in order to focus on the position of
      was true or false.                                             the word that will appear in the middle of the screen, before
    The reading part of the experiment was originally                answering the questions. If a participant was a fast reader
designed to evaluate the reading and comprehension skills            doing this process with less than 30 s, an additional waiting
of 10-year-old children. When the text is well understood,           period W3 was added in order to spread out the four texts
the reader produces inference during the reading which               over the 2 min. If a participant was a slow reader doing the
causes a pre-activation of the semantic field of the target           process with more than 30 s, no additional waiting period
word. The speed of correct answers for the target word               was added and the W1 waiting period started immediately
depends on the reading fluency [30]. As this pre-activation           with the stars on the screen.
is supposed to be automatic for an adult reader, and there-              Finally, after each sound sequence, participants had to
fore without cognitive effort, the speed of response to the          rate in silence the reading disturbance with this specific
target words has not been studied in this research. In con-          wording: “Globalement, l’ambiance sonore dans laquelle
trast, assuming that the noise of events may influence the            vous venez d’être plongé(e) était-elle plus ou moins gênante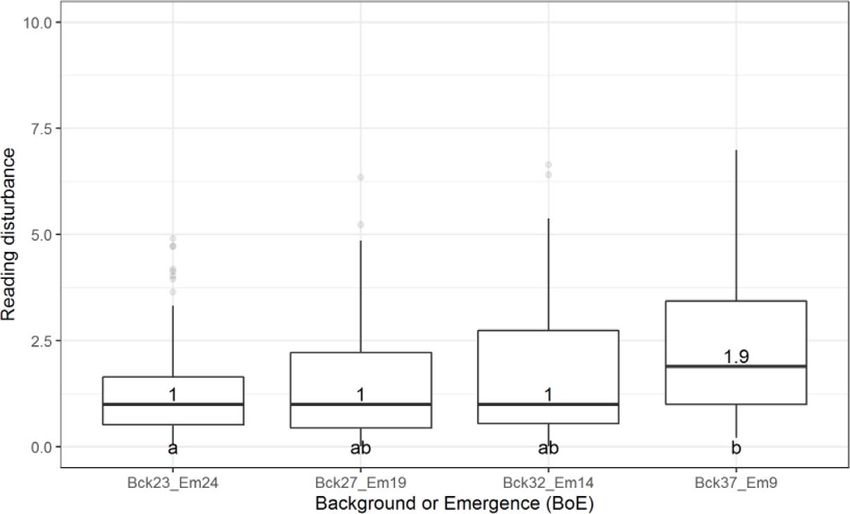
C. Lavandier et al.: Acta Acustica 2022, 6, 3                                               5

Table 3. Steps of the process for one text and its associated questions as an example.

Code                      Step                              Display                            Translation               Answering key
W1            1500 ms of waiting period W1                     ***                                 ***                          –
             forcing the eyes to fix the stars
R                     Line/Page n°1               « La nuit est tombée sur le            “Night has fallen on the              next
                                                      laboratoire de biologie               biology laboratory
R                    Line/Page n°2                Cependant, une lumière est          However, a light remained on             next
                                                         restée allumée au                         in the
R                    Line/Page n°3                dernier étage de l’immeuble         the top floor of the building,            next
                                                        où sommeillent les                   where sleep the
R                    Line/Page n°4                   petits animaux dans leur         small animals in their cage. It          next
                                                      cage. C’est alors qu’un                 is then that a
R                    Line/Page n°5                  homme vêtu de noir entre           man dressed in black enters             next
                                                          silencieusement.                        silently.
R                    Line/Page n°6               Il éteint toutes les lumières du      It turns off all the lights in          next
                                                            laboratoire. »                   the laboratory.”
W2            500 ms of waiting period W2                        ***                                 ***                        –
             forcing the eyes to fix the stars
ATW               Target –word question                      craire                     craire (non-French word)               False
W2            500 ms of waiting period W2                     ***                                  ***                          –
             forcing the eyes to fix the stars
ACQ              Comprehension question           L’homme n’a probablement              The man probably has no                True
                                                     pas le droit d’être là.                right to be there.
W3            Variable waiting time W3 in                     ***                                  ***                          –
              order to avoid the all process
                   to be less than 30 s

pour la lecture? Voici un curseur d’opinion gradué de 0 à              the knees, the back well installed in the armchair, the
10. Notez 0 (à gauche) si le bruit ne vous a pas gêné du tout          fingers on the keyboard (one key for “true”, one key for
et notez 10 (à droite) si le bruit vous a extrêmement gêné.            “false” and one key for “next”, see Tab. 3).
Si vous êtes entre ces deux situations, choisissez une note                The interface was developed on OpenSesame3, a soft-
intermédiaire entre 0 et 10” (“Overall, was the sound envi-            ware designed for psychological tests that records all the
ronment in which you have just been immersed more or less              participants’ answers in the form of variables. The texts,
disturbing for reading? Here is an opinion cursor graduated            previously designed for psychological tests with children,
from 0 to 10. Rate 0 (on the left) if the noise did not disturb        are calibrated for both size and reading difficulty [31]. This
you at all and rate 10 if the noise extremely disturbed you.           calibration ensures that overall variations in reading times
If you are between these two situations, choose a score                are not due to the content of the texts. The OpenSesame
between 0 and 10”). After having validated their rating,               interface was then synchronized with the Max/MSP4 sound
another sound sequence started, triggered randomly among               broadcasting software using the OSC communication
the remaining other sound sequences. Again, participants               protocol.
had to wait 1500 ms, fixing three stars on the screen and
preparing their fingers on the keyboard, before reading                 2.4 Participants
another text. The all test lasted about 1 h 30 and consisted
of the following steps:                                                    A communication campaign was carried out within CY
                                                                       Cergy Paris University to recruit French native language
       Written information on the study and the test.                 participants. The recruitment criterion was noise sensitiv-
       Audiogram to check the correct hearing of the                  ity, which was evaluated via an online questionnaire
        participant.                                                   [32, 33]. Questions concerned usual reactions to noises that
       Written participant consent.                                   people encounter in their everyday life. Candidates had to
       Training session with two extreme sound sequences              rate their agreement with sentences about noise on a Likert
        (Fig. 2).                                                      scale (“I totally agree”, “I rather agree”, “I rather disagree” or
       Test per se: participants were exposed to 16 sound             “I totally disagree”). Scores of sensitivity varied from 0 to 3.
        sequences while reading.
                                                                       Among interested people, 14 participants were selected with
       End of the test with debriefing.
                                                                       a sensitivity score under 1.7 and were clustered in the
       Filling out a receipt of gratification.
                                                                       non-sensitive group, 15 participants were selected with a
                                                                       sensitivity score above 1.7 and were clustered in the noise
    The participants were informed about this study via
                                                                       sensitive group. Among the 29 participants, 19 were female
written information with a welcome sheet where various
instructions were given, such as the position to hold for              3
                                                                           https://osdoc.cogsci.nl/2.9.2/getting-opensesame/
                                                                       4
the participant during the test. The laptop had to be on                   https://cycling74.com/get-started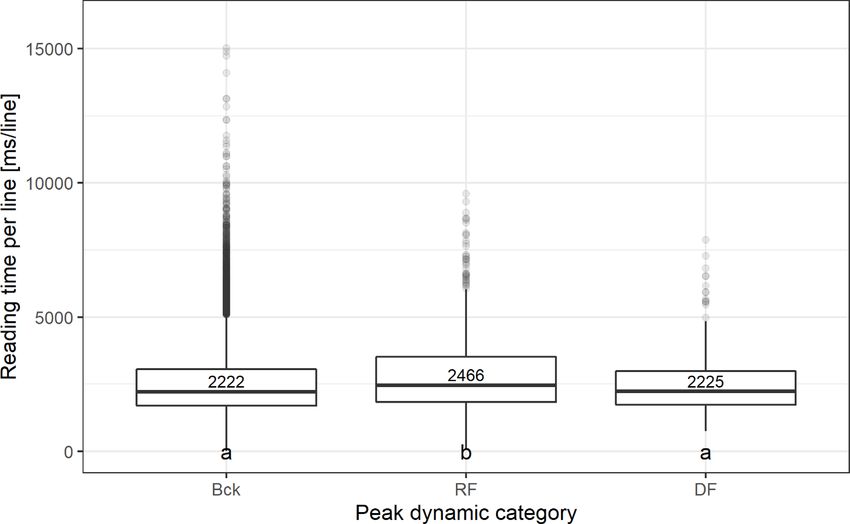
6 C. Lavandier et al.: Acta Acustica 2022, 6, 3
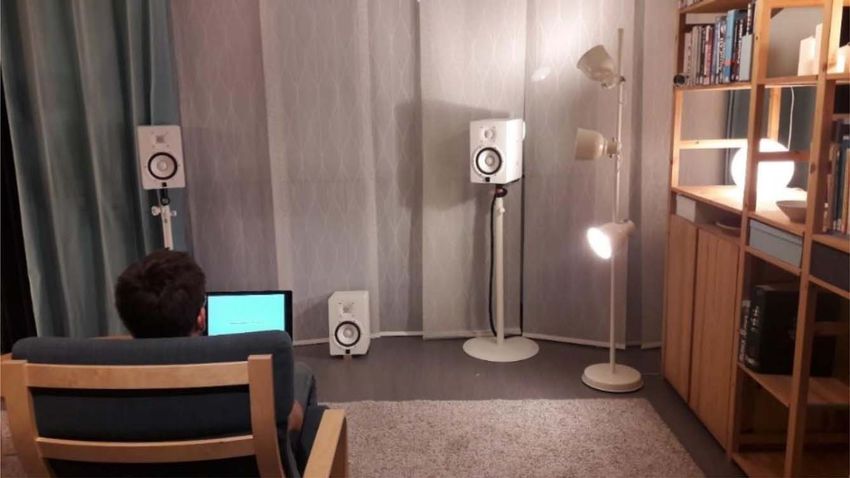
Figure 3. Application of the synchronization algorithm for a fast reader and a slow reader.
and 10 were male, they were all students aged from 18 to IP is counted as descending front of the peak (DF) if noise
28 with a median value of 21. They received a gratification levels exceed LAmax – 10 dB(A) for at least 50% of an activity
of 20 € for their duties. duration; (4) All the time steps that are not clustered in the
three previous categories are associated to the back-
2.5 Calculation of the reading times ground noise (Bck), except if at least 50% of an activity
duration is realized after the end of a sound sequence. In that
Data were processed to reconstruct the reading and the case, these time steps are associated to silence (Sil). Actu-
sound timelines of the participants during the progress of ally, if readers are very slow, it may happen that the test
their test. Concerning the reading timeline, four categories lasts more than 2 min and some lines of the last text are read
of activities performed by the participants have been iden- in silence.
tified: Reading (R), Waiting (W), Answering the Target- The algorithm is illustrated in Figure 3 for both a fast
Word (ATW), Answering the Comprehension Question and a slow reader. It shows that the synchronisation
(ACQ). The time limits of each type of activity correspond depends on each participant. For example, for slow readers,
to the instants when participants select an answering key it is possible that no read line would be allocated to the IP
and the duration of this activity is the difference between category because the reading activity in the rising front
these two instants. Then, all participants followed the activ- would be too long. In that case, the following line after
ities at their own speed for each text, with the following the (RF) category is allocated to (DF)) or even to (Bck)
time steps: W1–R–R–R–R–R–R–W2–ATW–W2–ACQ–W3 if the reading activity is very long.
(Tab. 3).
Concerning the sound timeline, the evolution of the 2.6 Calculation of the reading time change
sound level during the test has been divided into five
dynamic categories: silence corresponding to the back- It could be interesting to measure individually the
ground noise of the laboratory without any sound sequence importance of the change in the reading time between
(Sil), background noise of a sound sequence when there is no two categories of peak dynamic (for example between the
emerging event (Bck), rising front of a peak (RF), installed reading time during the rising front noise, and the reading
peak (IP) and descending front of a peak (DF). As a pass-by time during the background noise). The percentage of
event is defined when the sound level is above LAmax – change is calculated for each participant, and for each
10 dB(A), a specific Matlab routine has been developed in sequence as follows:
order to allocate the different activities (and especially the
reading task) to the different clusters of peak dynamic: See the Equation (1) top of next page
(1) The rising front of the peak (RF) is defined as the first
time step when the noise levels exceed LAmax – 10 dB(A) It represents a relative slowdown in reading speed if the
for at least 50% of an activity duration; (2) The next follow- % of change is positive (for example if the reading time is
ing time steps are counted as Installed peak (IP) as long as longer during the rising front compared to the reading time
the noise levels exceed LAmax – 10 dB(A) for 100% of an during the background noise), and a relative acceleration if
activity duration; (3) The first time step not counted as the % of change is negative.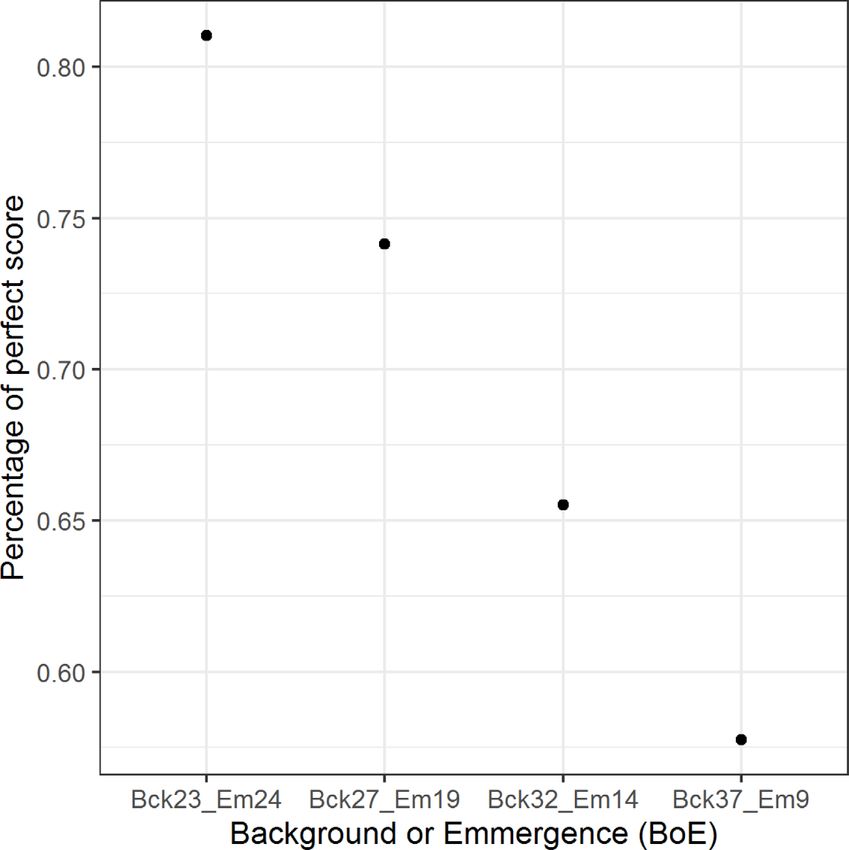
C. Lavandier et al.: Acta Acustica 2022, 6, 3                                          7

                                 Median reading time during cat  A  Median reading time during cat  B
                 % of Change ¼                                                                           :                 ð1Þ
                                                   Median reading time during cat  B

2.7 Statistical analysis                                        Table 4. Number of text lines read in each peak dynamic
                                                                category for the 16 sound sequences and medians of reading time
    The strong variability in the reading time per line         per line, all participants included.
among the participants and among the sequences made
the distribution of the data incompatible with a classical      Sequence                   (Bck)   (RF)    (IP)   (DF)    (Sil)
ANOVA (no equality of variances neither Gaussian distri-        1                          635       25      5      14     17
bution). So non-parametric tests were used in this paper        2                          607       36     11      21     21
for the analysis of the reading time per line. Kruskal–Wallis   3                          634       11      8      15     28
tests [34] were chosen to study the differences between         4                          567       53     17      39     20
median ranks and Wilcoxon tests were chosen for post-           5                          631       19      1      10     35
                                                                6                          620       36      2      6      32
hoc analyses [35] when data were disaggregated between
                                                                7                          628       33      0      17     18
participants. When a repeated measure design could be           8                          607       51      2      20     16
used, Friedman tests [36] and Nemenyi post-hoc analysis         9                          611       22     12      16     35
[37] were chosen.                                               10                         604       38     15      21     18
    For the reading disturbance whose data followed a           11                         599       32      9      35     21
repeated measure design, multi-level models [38] were also      12                         544       64     27      32     29
used to explain variability of this specific dependant vari-     13                         616       22     11      18     29
able and to study relationships with independent variables,     14                         606       36     14      19     21
if assumptions were respected.                                  15                         602       32      9      33     20
    In this paper, four p-value thresholds are considered:      16                         576       53     17      29     21
                                                                Total                      9687     563     160    345    381
p < 0.001, p < 0.01, p < 0.05 for significance and p < 0.1
                                                                Median value in ms/line    2222    2466    1674   2225    3322
for tendency.

3 Results
                                                                    there is a limitation of the (IP) duration. For the fas-
3.1 Distribution of data                                            ter reader where 50% of his/her mean reading time
                                                                    (1619 ms/line) is on the rising front (about 800 ms)
3.1.1 Statistics on participants
                                                                    and 50% of the same reading time on the descending
    Figure 3 shows that the reading speed of participants           front (about 800 ms), the maximum duration of
could have an impact on the distribution of the data. So,           an (IP) slot is about 3200 ms (4800 – 2  800).
participants have been clustered as fast and slow readers,          This means that for all the other participants, the
                                                                    maximum duration of an (IP) reading time for a line
respectively below and above the median value of their
                                                                    is smaller than 3200 ms. In contrast, there is no limi-
mean reading time per line which is 2513 ms/line
                                                                    tation of the reading time duration for the back-
(1619 ms/line and 4563 ms/line respectively for the quicker
                                                                    ground category. For the (RF) and (DF) categories,
reader and for the slowest reader). Consequently, the read-         as the noise levels should exceed LAmax – 10 dB(A)
ing speed groups are fairly balanced (14 fast readers and           for at least 50% of the reading duration, the maximum
15 slow readers). There is no correlation between noise             duration for these two categories is twice the event
sensitivity and the reading speed in this corpus (Pearson           duration which corresponds to 9600 ms (2  4800).
r = 0.068, p = 0.72). This will make it possible to look at         This limitation due to the routine is not a limitation
the influence of these two characteristics separately if             for readers, as the mean reading time for the slowest
necessary.                                                          reader is 4563 ms/line. Moreover, there are 132 (IP)
                                                                    observations for fast readers and only 28 (IP) observa-
3.1.2 Statistics on reading time per line                           tions for slow readers, leading to an underestimation
                                                                    of the reading time during (IP).
   With a total of 11 136 read text lines, Table 4 presents        With the chosen protocol, all the lines that are read in
the number of these lines inside each peak dynamic cate-            silence are read after the end of the sound sequences.
gory and the corresponding medians of the reading time              All the lines, whose reading times are allocated to
per line for all participants.                                      the other categories (Bck) (RF) (IP) and (DF), are
   Two categories (IP) and (Sil) cannot be compared to              read during the 2-min sequences. Consequently,
the others for different reasons:                                   350 lines are read in silence (Sil) by slow readers and
                                                                    only 31 (Sil) lines are read in silence by fast readers,
     With such a short car pass-by duration (4800 ms when          leading to an overestimation of the reading time
      the sound pressure levels exceed LAmax – 10 dB(A)),           during silence (Sil).
8 C. Lavandier et al.: Acta Acustica 2022, 6, 3
Figure 4. Distribution of the reading time per line for background categories with median values.
So, in the following sections, the two categories (IP) and This delay could be explained by the fact that people
(Sil) will not be compared to the three others (Bck), (RF) have to start again a cycle, changing their attention from
and (DF). The corresponding data are then excluded from answering question on a text to concentrating on reading
the statistical analysis. a new text and forgetting the previous one. They have to
build the bases of understanding a new story by taking the
3.2 Reading time per line first information [39]. They also maybe need time to check
the fingers are correctly placed on the keyboard although
3.2.1 Influence of a stable background sound level the waiting time W1 of 1500 ms should be enough for that.
This effect decreases as the text goes on, and there is no dif-
A prior investigation consists in studying the reading ference anymore in the reading time for the three last lines.
time per line depending on the sound level. The experiment
design allows to study the distribution of these times among 3.2.3 Influence of the peak dynamic category
the four background noises (Fig. 4), which vary from about
23 dB(A) for sequences 13–16, to about 37 dB(A) for As the distribution of the first line over the peak
sequences 1–4 (see Tab. 1). There is no significant difference dynamic categories is similar to the distribution of the other
between the median reading times during the background lines (Tab. 5), the first line is kept all over the following
period (Kruskal–Wallis p-value = 0.078). This means that analyses.
continuous and stable low sound levels do not influence The Kruskal–Wallis test shows that the peak dynamic
the reading speed of participants. category has a highly significant influence on the reading
Of course, there is a significant difference in reading time time per line (p < 0.001). Two groups a and b representing
per line in the background noise of the sequences between significant different distributions are extracted from the
fast and slow readers (Kruskal–Wallis p-value < 0.001) with Wilcoxon post-hoc analysis (Fig. 6). Differences of medians
a median value equals to 1898 ms/line for fast readers and are significant between (RF) and (Bck) (C. Lavandier et al.: Acta Acustica 2022, 6, 3 9
Figure 5. Distribution of the reading time per line according to the line rank order, with median values. Three groups a, b and c
representing significant different distributions are extracted from the Wilcoxon post-hoc analysis.
Table 5. Number of text lines read for each rank of line for the 3.3.2 Influence of the sound sequence factors
16 sound sequences, all participants included.
It is possible to analyse the disturbance data with a
Line rank order (Bck) (RF) (DF) repeated measure design for each couple of groups. The
1 1650 91 63 dependent variable is the reading disturbance, and the inde-
2 1618 125 57 pendent variables are the (BoE) factor (4 levels) and the
3 1610 106 61 (NoP) factor (4 levels too, see Tab. 1).
4 1591 92 78
5 1619 67 60 – The number of peaks (NoP) does not influence the
6 1599 82 26 reading disturbance (Friedman p-value = 0.506). The
Total 9687 563 345 same result is also observed if the analysis is carried
out on each couple of groups.
– The (BoE) factor is significant (Friedman p-value =
the peak factor is significant for both sensitive and non- 0.005). If the analysis is carried out on the sensitivity
sensitive groups (p < 0.001 for sensitive participants as well groups, this effect is only significant for sensitive people
as for non-sensitive ones). (p = 0.011, respectively p = 0.233 for non-sensitive
The individual slowdowns in the reading speed are participants), with an increase of disturbance following
calculated with Equation (1) in Section 2.6. The global the increase of background noise. Two groups of
median slowdown equals to 8.8%. Kruskal–Wallis tests sequences a, b representing significant different distri-
reveal that there is a significant difference between fast butions are extracted from the Nemenyi post-hoc anal-
and slow readers (p = 0.005) but no significant difference ysis. It shows that the sound sequences with a higher
between sensitive and non-sensitive groups (p = 0.323). background noise of 37 dB(A) and lower emergence of
If the median slowdown is limited to 4% with fast readers, 9 dB(A) (stimuli 1 to 4 altogether) are significantly dif-
it goes up to 14% for slow readers. ferent from the others (p = 0.028, p = 0.028, p = 0.042
respectively for Bck23_Em24, Bck27_Em19, Bck32_
Em14) and are considered as more disturbing than the
3.3 Reading disturbance
others for the reading task (Fig. 7).
3.3.1 Influence of personal factors
If the analysis is carried out on the reading fluency
The median of the reading disturbance values increases groups, the (BoE) factor has a significant impact on reading
significantly from 1.1 for fast readers to 3.0 for slow readers disturbance for fast readers (Friedman p-value = 0.027) but
(Kruskal–Wallis test p-value < 0.001). Similarly, an not for slow readers (p = 0.224), with sequences 1–4
increase of the reading disturbance values is observed from altogether (Bck37_Em9) different from sequences with
1.3 for non-sensitive participants to 2.8 for sensitive ones (p- Bck23_Em24 (Nemenyi post-hoc p-value = 0.036) (Fig. 8).
value < 0.001). It has to be noted that the disturbance rat- This influence of the (BoE) factor is only revealed for
ings are very low, compared to the 11-point scale. noise sensitive participants and for fast readers, although10 C. Lavandier et al.: Acta Acustica 2022, 6, 3
Figure 6. Distribution of the reading time per line according to the peak dynamic category, with median values. Two groups a and b
representing significant different distributions are extracted from the Wilcoxon post-hoc analysis.
Figure 7. Reading disturbance according to the (BoE) factor only for the group of noise sensitive participants. Labels correspond to
median values for each distribution. The two groups a and b, representing significant different distributions, are extracted from the
Nemenyi post-hoc analysis.
slow readers are more disturbed than fast readers. This not continuous factors, taking the scores of the preliminary
intuitive result will be discussed in Section 4.2. questionnaire (Sect. 2.4) for noise sensitivity and taking
the mean reading time per line (Sect. 3.1.1) for the reading
3.3.3 Reading disturbance explained by personal slowness. Sound sequence parameters correspond to the
and sound sequence factors acoustic indicators L90, LAeq and Emergence (Tab. 1) and
the (NoP) factor. In order to respect the assumption of
Multi-level analyses were carried out to explain and normal distribution of the residuals, two participants were
quantify the variance of the reading disturbance data excluded from this analysis. They do not react as the others
(Tab. 5) at the individual and at the sound sequence levels for the reading disturbance, rating all the sound sequences
using the package “lme4” of the R statistical software [40]. with constant assessments (around “1”) although they are
Personal data were included in the models as fixed the two slowest readers.C. Lavandier et al.: Acta Acustica 2022, 6, 3 11
Figure 8. Reading disturbance according to the (BoE) factor only for the fast reader group. Labels correspond to median values for
each distribution. The two groups a and b, representing significant different distributions, are extracted from the Nemenyi post-hoc
analysis.
Table 6. Multi-level models of reading disturbance with regression coefficients (standard errors, t-value) for fixed part and with
variance components (standard error) for random part. Significance of estimates is noted ***(p < 0.001),**(p < 0.01) or * (p < 0.05).
Models Null Model Model 1 Model 2 Best Model
Fixed part
Intercept 2.79 (0.43; 6.53)*** 2.05 (0.86; 2.39)* 6.41 (1.56; 4.12)*** 1.13 (1.73; 6.52)***
Sensitivity 1.56 (0.46; 3.39)** 1.56 (0.461; 3.39)**
Reading slowness 2.6e-03 (5.48e-04; 4.69)*** 2.57e-03 (5.48e-4; 4.67)***
LAeq 0.13 (0.021; 6.46)*** 1.33e-01 (2.06e-02; 6.46)***
Pseudo R fixed effects 0 0.02 0.44 0.46
Random part
Participants 4.60 (2.15) 4.60 (2.15) 1.92 (1.39) 1.92 (1.39)
Sound sequences 0.13 (0.36) 0.00 (0.00) 0.13 (0.36) 0.00 (0.00)
Residual 1.42 (1.19) 1.41 (1.19) 1.42 (1.19) 1.41 (1.19)
Goodnesss of fit
AIC 1510.5 1495.9 1503.3 1488.7
BIC 1526.8 1516.23 1527.7 1517.2
The global variance of the “Null model” is 6.15. The variance at the participant level (4.60–1.92/4.60 = 58%)
multi-level analysis shows that the variance due to the (Tab. 6).
participants is 4.60 which represents 75% of the global vari-
ance. The variance due to a change of the sound sequence 3.4 Comprehension rate
represents only 2% of the global variance. Finally, 33% of
the total variance cannot be explained by any of these For each sound sequence, the comprehension rate of a
random parameters. If we introduce in the models the participant is the percentage of good answers at the
acoustic indicators as fixed effects, the best model is comprehension question. As there are four texts during each
obtained with LAeq (Model 1). It reduces the random sound sequence, the comprehension rate takes only five
part of the global variance (6.15–6.01 = 0.14) of 2% values that are 1, 0.75, 0.5, 0.25 and 0. Normal distribution
(0.14/6.15). If both personal factors are included as fixed is not assumed either for the data nor for residuals so non-
effects in the Model 2, the fixed part explains 44% of the parametric tests are used again. There is no significant
total variance because it reduces the random part of the difference between speed reading groups (Kruskal–Wallis
global variance (6.15–3.47 = 2.68) of 44% (6.68/6.15). p-value = 0.117) neither between noise sensitivity groups
Globally, the fixed part of the final best Model with the (Kruskal–Wallis p-value = 0.873) for the comprehension
two personal factors and the LAeq explains 46% of the rate. All participants succeeded quite well to the exercise
total variance. It is interesting to note that the acoustic indi- whatever their personal factors. It must be remembered
cator LAeq (Model 1) explains 100% of the variance at the that the cognitive test has been initially designed for
sound sequence level (0.13–0.00/0.13 = 100%) and that 10-year-old children. All participants are then included
the two personal factors (Model 2) explain 58% of the together in a non-parametric repeated measure design.12 C. Lavandier et al.: Acta Acustica 2022, 6, 3
Figure 9. Influence of the (BoE) factor on the percentage of perfect scores.
The (NoP) factor has no influence of the comprehension The joint influence of the acoustical characteristics of the
rate, and there is no significant difference between any pairs sound sequences and personal factors, such as noise sensitiv-
of sequences. On the contrary, the (BoE) factor has a signif- ity and speed-reading ability, have been studied on cogni-
icant influence on the comprehension rate (Friedman tive performance as well as on reading disturbance. The
p-value < 0.001) with a decrease of the comprehension rate main results can be summarized:
following the increase of the background noise.
Another way to represent this effect is to calculate for The reading speed decreases during the rising front of
each category, the ratio of perfect ratings that correspond a peak, and goes back to its former regular reading
to 4 good answers at the four comprehension questions speed during the descending front of the peak.
(Fig. 9). For example, for the sound sequences 13–16, there The slowdown in reading due to the rising front of a
are 29 4 observations (4 stimuli and 29 participants). noise peak is increased for participants that are slow
Among these 116 observations, only 94 reached 1 as com- readers.
prehension rate. The ratio of perfect answers is then equal The comprehension of the text read decreases as the
to 0.81. background sound level increases, even if the reading
speed does not change with the background sound
level.
Reading disturbance is governed by personal factors,
4 Discussion noise sensitive participants declaring higher reading
4.1 Synthesis disturbance than non-sensitive ones, as well as slow
readers declaring higher disturbance than fast readers.
A laboratory experiment has been carried out in order Reading disturbance is influenced by the sound pres-
to reveal the influence of fluctuating road traffic noise on sure levels of the sequences, not by the number of
the disturbance perceived by participants during an easy peaks.
reading task as well as their performance, inside a living The influence of the sound pressure levels is only
room with closed windows. Sixteen 2-min sound sequences revealed for noise sensitive participants and for fast
were created with one to four noise peaks with an emer- readers.
gence varying from 9 to 24 dB(A) with a 5 dB(A) step,
keeping the maximum sound level constant for each noise 4.2 Reading disturbance
event. The consequence of such a design is that all pass-
bys can be considered as quite similar, but the global sound Globally, it can be said that noise sensitive participants
level varies from 31 dB(A) to 41 dB(A), and the back- and slow readers rated the sequences for reading distur-
ground sound level varies from 23 dB(A) to 37 dB(A). bance in the same range of values around 3. Fast readersC. Lavandier et al.: Acta Acustica 2022, 6, 3 13
and non-sensitive participants rated sequences around 1, related to the Bck37_Em9 sound sequences. This availabil-
within a scale range from 0 to 10. The noise sensitivity ity allows them to be more aware of noise, even if it does
factor influenced the reading disturbance. This is in line not necessarily affect their reading ability during the car
with literature [41, 42], which demonstrated that sensitive pass-bys.
persons are more annoyed than non-sensitive persons by In our study, the only sound sequences which are rated
traffic noise in a laboratory context. These ratings show higher than the others on the reading disturbance scale are
that participants were lightly disturbed for reading because the loudest ones, whose background noise level reaches
the sound levels are quite low, although they are realistic for 37 dB(A), with 9 dB(A) of emergence for the events. In
a living room with closed double glass window in an urban buildings or offices, the continuous background noise is gen-
context. Kurra et al. had similar results on reading distur- erally due to ventilation sounds. Hongisto et al. [50] found
bance in a laboratory context at such low levels [43]. The that ventilation sounds at about 40 dB(A) were rated in
ratings of reading disturbance are low also because the the middle of the scale of disturbance for participants
activity was easy for adult participants, as it was initially who were not working, but were instructed to imagine that
designed for 10-year-old children. It has already been shown they were in a corresponding acoustic environment for a
that the difficulty of the task is an important factor for the whole work day. In order to avoid reading or working dis-
influence of a sound variable on performance [44, 45]. turbance, it could be recommended to limit the background
The influence of the (NoP) factor is not revealed in this sound level under 37 dB(A). It is interesting to note that in
study. This is not in line with literature for road traffic noise. France, acoustic regulation demands that the background
For example, Gilles et al. [9] found that the increase of the sound level does not exceed 35 dB(A) due to inside building
number of vehicles (from 10 to 50 pass-bys for 3-min equipment [51].
sequences that corresponds to an increase of 6–30 pass-bys
for 2-min sequences) increases the noise annoyance for 4.3 Comprehension rate
participants that did not achieve any task but imagined
themselves at home while relaxing. In their study, the sound Finally, the comprehension rate was influenced by the
levels varied from 55 to 62 dB(A) for open windows. Trollé background sound level. There is a large literature on the
et al. [46] found also that the increase of the traffic flow effect of noise on task performance of school pupils, but less
(from 20 to 40 pass-bys for 3-min sequences that corresponds for adults with the reading comprehension rate. Chitwood
to an increase of 13–26 pass-bys for 2-min sequences) and Vaughn [52] found that there is no influence of the type
increases the unpleasantness of the sound environment for of background noise (silence, lyrical music and pink noise)
participants who were asked to imagine themselves outdoor on reading comprehension for young adults, but in their
reading at a terrace of a café. In their study, the sound levels study, the sound levels were not controlled as the experi-
varied from 50 to 60 dB(A). In this study, participants were ment was carried out on line, through a website with per-
involved in a real reading activity, exposed to a smaller sonal headphones.
number of events and to lower sound pressure levels.
This context may explain differences in the results (see also 4.4 Limitations
Sect. 4.4 concerning limitations of this study).
This influence of the (BoE) factor is only revealed for A first limitation to this study concerns the design of the
noise sensitive participants and for fast readers. This result sound sequences. The study focused on a context of distur-
is not intuitive for fast readers, and could be explained with bance at home with the windows closed, which may explain
the reading cognitive processes. In adults, reading requires the low sound levels of the sound scenes. It would be inter-
two types of processes: automatic processes and controlled esting in a future study to design an experiment around a
processes [47]. The controlled processes require significant corpus of open window sound scenes, which would increase
cognitive effort and attentional resources according to the the sound level and the resulting measured disturbance
theory of Schneider and Shiffrin [48]. The performance levels. It would be also necessary to respect the feeling of
linked to these processes is then sensitive to disruption. pass-by from one side to the other with stereo recordings
Two kind of readers could then be differentiated. Those (without SimScene simulator) or with spatial effect with
with a highly automated reading who could be called the VBAP system of the laboratory. Furthermore, it would
“expert” readers, and those with more controlled reading be interesting to introduce more variability in the noise
who are less experts [49]. In this perspective, fast readers peaks, in terms of spectral content and temporal variability,
could be considered as more experts than slow readers. in order to simulate the real variability of road traffic in a
The rising front of the peaks influences the reading speed, residential area subject to noise emergence.
especially for slow readers. The rising front must therefore In addition, the designed experimental set-up is interest-
certainly mobilize attentional resources, which can disrupt ing to study the cognitive impact of car pass-bys, evaluated
cognitive activity when it already demands some of the with the time needed to read a line of a text and with the
subject’s resources. Their reading ability is affected by the comprehension rate. This design is less interesting for the
rising front of the peak, but their reading disturbance is study of the reading disturbance due to fluctuating sounds
not influenced by the acoustic factors of the sound because it is already well established that the sound level is
sequences. In contrast, the attentional availability of fast the first factor which creates disturbance [53–55]. In this
readers may explain their increased reading disturbance configuration with the control of LAmax, the influence of14 C. Lavandier et al.: Acta Acustica 2022, 6, 3
the number of peaks on reading disturbance could not be allows analysing not only the reading speed in real time
revealed, because it is masked by the variation of the back- but also possible eye retro-saccades during noise peaks.
ground sound level, covariate with the emergence of peaks The study of the pupil dilation could also be associated to
(+15 dB(A) between the smallest and the highest back- the physiological impact of the emergence of a peak [57,
ground noise level as well as +15 dB(A) for levels of 58]. It is also important to increase the number of partici-
emergences variations), which is much higher than the vari- pants in order to have at least 30 persons in each sub-group
ations of sound levels due to the increase of the number of of sensitivity and reading ability.
peaks (maximum +4 dB(A) between one and four pass- In order to increase the impacts on disturbance, it could
bys). Vogt already showed that in laboratory, the number be interesting to virtually open the windows to increase the
variation of events (aircraft flyovers in his study) affected background sound level, to include feeling of spatial vehicle
the subjective responses of annoyance less than the sound movements, but also to modify the perception question that
level variation [56]. was focused on acute reading disturbance due to sound in
The second limitation to the study concerns the tasks this experiment. It would be interesting to ask for overall
demanded to participants. The reading task was indeed ini- annoyance as these ratings could be higher than reading
tially built for children. Hence it was maybe too simple to disturbance [59]. Kurra et al. [60] even observed that the
observe a pronounced disturbance among experienced read- range of the annoyance scale is increased if the question
ers. Placing participants in a larger discomfort zone, with a concerns the home projected annoyance due to the sound
more complex cognitive task, and more disturbing sound environment and not the overall annoyance.
scenes, would amplify the effects observed in this study. Finally, the same experiment could be carried out again
This will be the subject of a future study. but instead of choosing control on LAmax, the equalization
could be on LA90, or on LAeq. With such a design, the anal-
ysis could give more results on the impact of the level of
5 Conclusion and outlook emergence and of the number of peaks on perceived
disturbance.
This experiment was able to reveal impacts of road traf-
fic noise with car pass-bys on cognitive performances. When
the sound level does not vary like in the background noise,
Data availability statement
and for low sound levels in the range of 23 dB(A) to 37 dB Data are available on request from the authors.
(A), the reading time does not depend on the sound level
itself. When the sound level is fluctuating, the time needed
to read a line increases during the rising front of a peak, and Conflict of interest
goes back to the former regular reading speed during the
descending front. Globally, this increase equals to 8.8% Authors declared no conflict of interests.
whatever the noise sensitivity, but reaches 14% for slow
readers. Consequently, this reading slowdown is not due References
to the value of the sound pressure level itself, but to the
increase in the sound pressure level. 1. WHO: Burden of disease from environmental noise: quan-
The influence of noise sensitivity and reading fluency on tification of healthy life years lost, F. Theakston, Ed., World
reading disturbance is characterized by a higher distur- Health Organization, Regional Office for Europe, Copen-
bance for slow readers compared to fast reader, and higher hagen. 2011.
disturbance for noise sensitive persons compared to non- 2. H.M.E. Miedema, C.G. Oudshoorn: Annoyance from trans-
portation noise: Relationships with exposure Metrics DNL
sensitive persons. This higher reading disturbance for slow
and DENL and their confidence intervals. Environmental
readers is associated with a reading slowdown in the rising Health Perspectives 109 (2001) 409–416.
front of the peaks. The influence of the acoustic indicators is 3. Science for Environment Policy: Future brief: Noise abate-
very small compared to the influence of personal factors. ment approaches. Produced for the European Commission
There is even no influence of the number of events on the DG Environment by the Science Communication Unit,
reading disturbance. UWE, Bristol, 2017. Available on the 8th of March 2021
In order to go further in this topic, it would be interest- at: http://ec.europa.eu/science-environment-policy.
4. T. Kaczmarek, A. Preis: Annoyance of time-varying road-
ing to test the impact of the characteristics of the peak, such traffic noise. Archives of Acoustics 35, 3 (2010) 383–393.
as the slope of the rising front or the duration of the peak, https://doi.org/10.2478/v10168-010-0032-2.
on the reading speed. The experiment protocol would have 5. R. Guski, D. Schreckenberg, R. Schuemer: WHO Environ-
to be longer, with longer sequences built with more pass- mental Noise Guidelines for the European Region: A
bys. It would be also possible to study the speed of the read- Systematic Review on Environmental Noise and Annoyance.
ing during the installed peaks if these ones would last International Journal of Environmental Research and Public
Health 14, 12 (2017) 1539. https://doi.org/10.3390/
longer, studying train pass-bys instead of car pass-bys for
ijerph14121539.
example. The text to be read could be longer too, but 6. A. Can, L. Leclercq, J. Lelong, J. Defrance: Capturing urban
maybe more difficult, keeping the idea of calibrating the traffic noise dynamics through relevant descriptors. Applied
difficulty of each line of text. Another tool that could be Acoustics 69, 12 (2008) 1270–1280. https://doi.org/10.1016/
useful for further experiments is the eye-tracker, which j.apacoust.2007.09.006.C. Lavandier et al.: Acta Acustica 2022, 6, 3 15
7. P. Lercher, A. Bockstael, B. De Coensel, L. Dekoninck, D. 2021 at https://www.frontiersin.org/article/10.3389/fpsyg.
Botteldooren: The application of a notice-event model to 2020.570761.
improve classical exposure-annoyance estimation. Journal of 21. D. Schreckenberg, C. Belke, J. Spilski: The development of a
the Acoustical Society of America 131, 4 (2012) 3223–3223. multiple-item annoyance scale (MIAS) for transportation
https://doi.org/10.1121/1.4708019. noise annoyance. International Journal of Environmental
8. S.E. Samuels, J. Parnell: Peak noise events occurring in road Research and Public Health 15 (2018) 971. https://doi.org/
traffic noise, in Proceedings of Acoustics 2004, Gold Coast, 10.3390/ijerph15050971.
Australia. 2004. 22. M.R. Vasilev, J.A. Kirkby, B. Angele: Auditory distraction
9. L.A. Gille, C. Marquis-Favre, A. Klein: Noise annoyance due during reading: A Bayesian meta-analysis of a continuing
to urban road traffic with powered-two-wheelers: Quiet controversy. Perspectives on Psychological Science 13, 5
periods, order and number of vehicles, Acta Acustica United (2018) 567–597. https://doi.org/10.1177/1745691617747398.
with Acustica 102, 3 (2016) 474–487. https://doi.org/ 23. J.L. Szalma, P.A. Hancock: Noise effects on human perfor-
10.3813/AAA.918966. mance: A meta-analytic synthesis. Psychological Bulletin
10. J.M. Wunderli, R. Pieren, M. Habermacher, D. Vienneau, 137, 4 (2011) 682–707. https://doi.org/10.1037/a0023987.
C. Cajochen, N. Probst-Hensch, M. Röösli, M. Brink: 24. J.R. Wessel, A.R. Aron: Unexpected events induce motor
Intermittency ratio: A metric reflecting short-term temporal slowing via a brain mechanism for action-stopping with
variations of transportation noise exposure. Journal of global suppressive effects. Journal of Neuroscience 33, 47
Exposure Science & Environmental Epidemiolog 26, 6 (2013) 18481–18491. https://doi.org/10.1523/JNEUROSCI.
(2016) 575–585. https://doi.org/10.1038/jes.2015.56. 3456-13.
11. M. Brink, B. Schäffer, D. Vienneau, M. Foraster, R. Pieren, I. 25. R. Dedieu, C. Lavandier, C. Camier, S. Berger: Evaluation du
C. Eze, C. Cajochen, N. Probst-Hensch, M. Röösli, J.M. confort acoustique en logement résidentiel : Description du
Wunderli: A survey on exposure-response relationships for système de reproduction sonore adapté aux expériences
road, rail, and aircraft noise annoyance: Differences between perceptives envisagées, in Proceedings of the French Congress
continuous and intermittent noise. Environment Interna- of Acoustics, Le Havre. 2018.
tional 125 (2019) 277–290. 26. V. Pulkki: Virtual sound source positioning using vector base
12. J. Haubrich, S. Benz, M. Brink, R. Guski, U. Isermann, amplitude panning. Journal of the Audio Engineering Society
B. Schäffer, R. Schmid, D. Schreckenberg, J.M. Wunderli: 45, 6 (1997) 456–466.
Leq + X: Re-Assessment of exposure-response relationships 27. M. Rossignol, G. Lafay, M. Lagrange, N. Misdariis:
for aircraft noise annoyance and disturbances to improve SimScene: A web-based acoustic scenes simulator, in Pro-
explained variance, in Proceedings of the ICA, 23rd Interna- ceedings of the Web Audio Conference, IRCAM, Paris
tional Congress on Acoustics, Aachen, Germany. 2019. France. 2014.
13. H. Héritier, D. Vienneau, M. Foraster, I. Collins Eze, 28. J. Terroir, C. Lavandier: Perceptual impact of distance on
E. Schaffner, L. Thiesse, F. Rudzik, M. Habermacher, high-speed train sound quality. Acta Acustica United with
M. Köpfli, R. Pieren, M. Brink, C. Cajochen, J.M. Wunderli, Acustica 100, 2 (2014) 328–340. https://doi.org/10.3813/
N. Probst-Hensch, M. Röösli: Transportation noise exposure AAA.918712.
and cardiovascular mortality: A nationwide cohort study 29. A. Pate, C. Lavandier, A. Minard, I. Le Griffon: Perceived
from Switzerland. European Journal of Epidemiology unpleasantness of aircraft flyover noise: Influence of temporal
32, 4 (2017) 307–315. https://doi.org/10.1007/s10654-017- parameters. Acta Acustica United with Acustica 103 (2017)
0234-2. 34–47. https://doi.org/10.3813/AAA.919031.
14. M. Brink, P. Lercher, A. Eisenmann, C. Schierz: Influence 30. S. Guéraud, C. Royer: On-line investigations of inference
slope of of rise and event order of aircraft noise events on high production in skilled and less-skilled ten years old children, in
resolution actimetry parameters. Somnologie 12 (2008) 118– 26th Annual Meeting of the Society for Text and Discourse,
128. https://doi.org/10.1007/s11818-008-0345-9. Kassel, Germany. 2016.
15. R. Guski, U. Felscher-Suhr, R. Schuemer: The concept of 31. H. Guinet, C. Royer, H. Labat, S. Guéraud: Inferential
noise annoyance: How international experts see it. Journal of processes in 8 to 10 years old children. New factors which
Sound and Vibration 223, 4 (1999) 513–527. https://doi.org/ may explain development, in 22th Annual Meeting of Society
10.1006/jsvi.1998.2173. for the Scientific Study of Reading, Newport Beach (USA).
16. D. Ouis: Annoyance from Road Traffic noise. Journal of 2020. [postponed to 2022].
Environmental Psychology 21, 1 (2001) 101–120. 32. M. Schutte, S. Sandrock, B. Griefahn: Factorial validity of
https://doi.org/10.1006/jevp.2000.0187. the noise sensitivity questionnaire. Noise Health 9, 37 (2007)
17. K. Paunović, B. Jakovljević, G. Belojević: Predictors of noise 96–100. https://doi.org/10.4103/1463-1741.37425.
annoyance in noisy and quiet urban streets. Science of the 33. B. Griefahn: Determination of noise sensitivity within an
Total Environment 407, 12 (2009) 3707–3711. https://doi. internet survey using a reduced version of the noise sensitiv-
org/10.1016/j.scitotenv.2009.02.033. ity questionnaire. Journal of the Acoustical Society of
18. H.M.E. Miedema: Annoyance caused by environmental America 123, 5 (2008) 3449.
noise: Elements for evidence-based noise policies. Journal of 34. W.H. Kruskal, W.A. Wallis: Use of ranks in one-criterion
Social Issues 63, 1 (2007) 41–57. https://doi.org/10.1111/ variance analysis. Journal of the American Statistical Asso-
j.1540-4560.2007.00495.x. ciation 47, 260 (1952) 583–621. https://doi.org/10.2307/
19. P. Lercher: Noise in cities: Urban and transport planning 2280779.
determinants and health in cities, in Integrating Human 35. D.F. Bauer: Constructing confidence sets using rank statis-
Health into Urban and Transport Planning, M. Nieuwen- tics. Journal of the American Statistical Association 67, 339
huijsen, H. Khreis, Eds., Springer International Publishing, (1972) 687–690. https://doi.org/10.1080/01621459.1972.
Cham. 2019, pp. 443–481. 10481279.
20. S. Versümer, J. Steffens, P. Blättermann, J. Becker-Schweitzer: 36. M. Hollander, W. Douglas: Nonparametric Statistical
Modeling evaluations of low-level sounds in everyday situations Methods. John Wiley and Sons, New York, 1973, pp. 139–146.
using linear machine learning for variable selection. Frontiers 37. P. Nemenyi: Distribution-free Multiple Comparisons. PhD
in Psychology 11 (2020) 2593. Available on the 8th of March Dissertation, Princeton University, 1963.You can also read