INOX Kolkata Metro - cloudfront.net
←
→
Page content transcription
If your browser does not render page correctly, please read the page content below
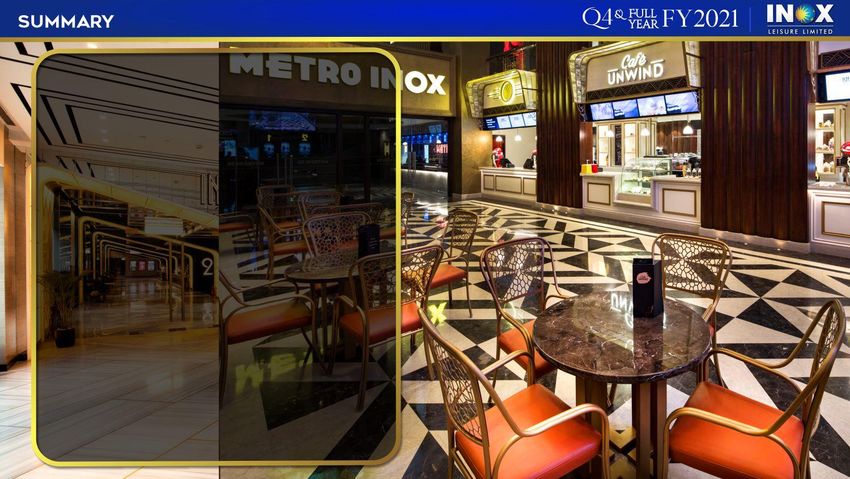
INOX Kolkata Metro

              1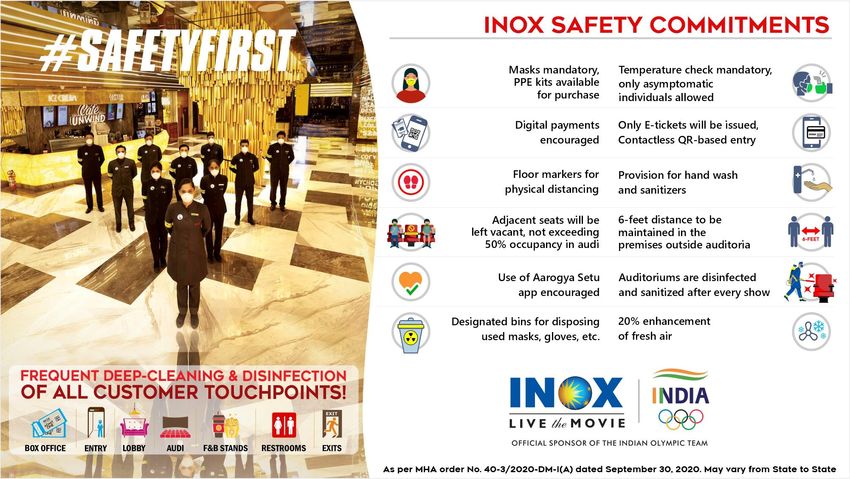
THIS PRESENTATION (PRESENTATION) IS NOT AN OFFER TO SELL ANY SECURITIES OR A SOLICITATION TO BUY ANY
SECURITIES OF INOX LEISURE LIMITED (THE “COMPANY”) OR ITS SUBSIDIARY (TOGETHER WITH THE COMPANY, THE
“GROUP”). The material that follows is a Presentation of general background information about the Company’s activities as at the date of
the Presentation or as otherwise indicated. It is information given in summary form and does not purport to be complete and it cannot be
guaranteed that such information is true and accurate. This Presentation has been prepared by and is the sole responsibility of the
Company. By accessing this Presentation, you are agreeing to be bound by the trading restrictions. It is for general information purposes
only and should not be considered as a recommendation that any investor should subscribe to or purchase the Company’s equity shares
or other securities.

This Presentation includes statements that are, or may be deemed to be, “forward-looking statements”. These forward-looking statements
can be identified by the use of forward-looking terminology, including the terms “believes”, “estimates”, “anticipates”, “projects”, “expects”,
“intends”, “may”, “will”, “seeks” or “should” or, in each case, their negative or other variations or comparable terminology, or by
discussions of strategy, plans, aims, objectives, goals, future events or intentions. These forward-looking statements include all matters
that are not historical facts. They appear in a number of places throughout this Presentation and include statements regarding the
Company’s intentions, beliefs or current expectations concerning, amongst other things, its results or operations, financial condition,
liquidity, prospects, growth, strategies and the industry in which the Company operates. By their nature, forward-looking statements
involve risks and uncertainties because they relate to events and depend on circumstances that may or may not occur in the future. The
factors which may affect the results contemplated by the forward looking statements could include, among others, future changes or
developments in (i) the Group’s business, (ii) the Group’s regulatory and competitive environment, and (iii) political, economic, legal and
social conditions in India or the jurisdictions in which our Group operates. Forward-looking statements are not guarantees of future
performance including those relating to general business plans and strategy of the Company, its future outlook and growth prospects, and
future developments in its businesses and its competitive and regulatory environment. No representation, warranty or undertaking,
express or implied, is made or assurance given that such statements, views, projections or forecasts, if any, are correct or that the
objectives of the Company will be achieved.

There are some important factors that could cause material differences to Company’s actual results. These include (i) our ability to
successfully implement our strategy (ii) our growth and expansion plans (iii) changes in regulatory norms applicable to the Company (iv)
technological changes (v) investment income (vi) cash flow projections etc. The Company, as such, makes no representation or warranty,
express or implied, as to, and does not accept any responsibility or liability with respect to, the fairness, accuracy, completeness or
correctness of any information or opinions contained herein. The information contained in this Presentation, unless otherwise specified is
only current as of the date of this Presentation. The Company assumes no responsibility to publicly amend, modify or revise any forward-
looking statements, on the basis of any subsequent development, information or events, or otherwise. Unless otherwise stated in this
Presentation, the information contained herein is based on management information and estimates. The information contained herein is
subject to change without notice and past performance is not indicative of future results. The Company may alter, modify or otherwise
change in any manner the content of this Presentation without obligation to notify any person of such revision or changes.

This document is just a Presentation and is not intended to be and does not constitute a “prospectus” or “offer document” or a “private
placement offer letter” or an “offering memorandum” or an “offer” or a solicitation of any offer to purchase or sell any securities. It is
clarified that this Presentation is not intended to be a document offering for subscription or sale of any securities or inviting offers from the
Indian public (including any section thereof) or from persons residing in any other jurisdiction including the United States for the
subscription to or sale of any securities including the Company’s equity shares. No part of it should form the basis of or be relied upon in
connection with any investment decision or any contract or commitment to purchase or subscribe for any securities.

This document has not been and will not be reviewed or approved by a regulatory authority in India or by any stock exchange in India.
This document and its contents should not be forwarded or delivered or transmitted or disseminated in any manner to any person other
than its intended recipient and should not be reproduced or copied in any manner whatsoever.                                         2
• Key Highlights
• Financial Highlights: Q4 & Full Year FY21
• Shareholding Structure
• Property Openings
• Screen Outlook FY22
• Movie releases in Q4FY21
• Upcoming movies
• COVID-19 Initiatives And Planning
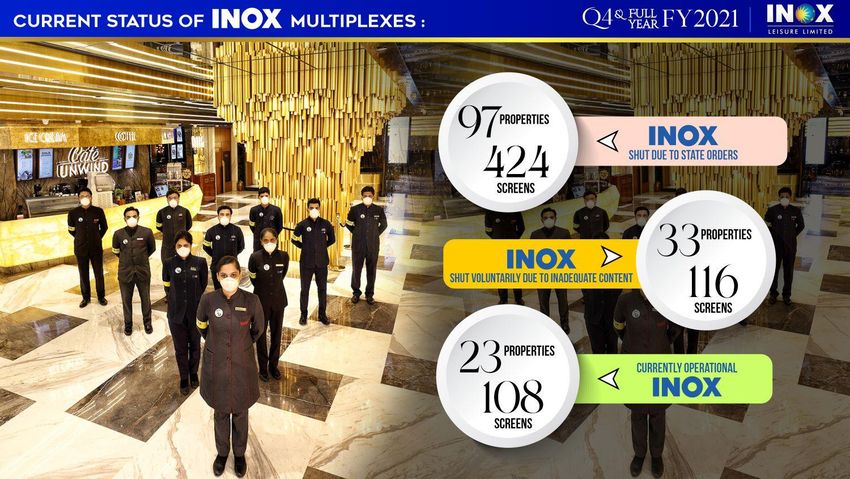
• Current Status of INOX Multiplexes
• Engagement With Landlords
• Engagement With Distributors & Producers
• INOX Safety Commitments
• Cash-flow Planning
• Annexure
3
4
₹119cr   ₹-60cr   ₹-74cr

₹376cr   ₹40cr    ₹-2cr
                           5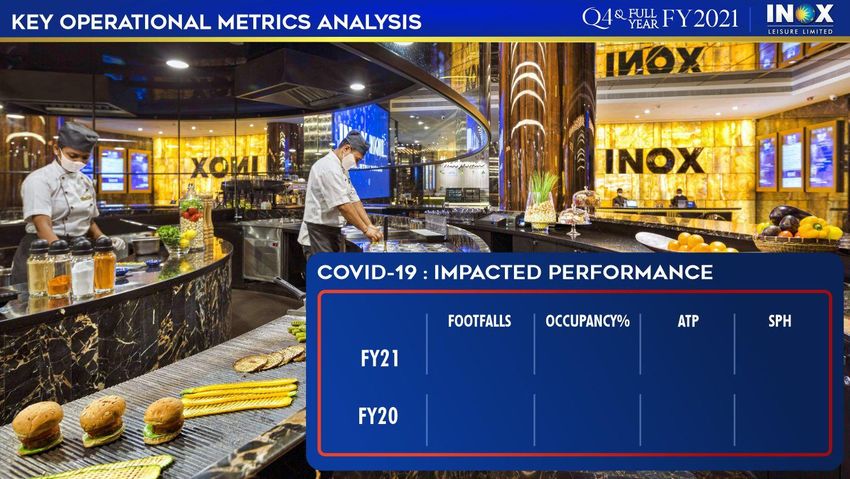
₹148cr     ₹-204cr   ₹-257cr

₹1,915cr   ₹347cr    ₹141cr

                               6
REVENUE BREAKUP ANALYSIS
Quarterly YoY Comparison in ₹ Cr Full Year YoY Comparison in ₹ Cr
-68% -92%
2,00 0 200
376 1,915
140
29 1,80 0
134 180
35 119 179
120 1,60 0 160
148
94
52% 1,40 0
497
140
100
* 44 -53%
Other Revenues
* 63
1,20 0 120
Advertisement
80
-94% 2 1,00 0 100
-98% 3
60
24 Net Food & Beverage
800 80
28
Net Box Office
600 60
218 -74% 1,105
-94%
40
400 40
20
49 54
-78%
200 20
-95%
- -
-
Q4FY20 Q4FY21 FY20 FY21
*Note: Other Revenues include an old Claim settled for ₹23.75 crs.
For visibility of bars, above charts are prepared independently on different scales.
COVID-19 Impacted Revenues in Q4/FY21
%Share Q4FY20 Q4FY21 FY20 FY21
Net Box Office 58% 41% 58% 36%
Net Food & Beverage 25% 20% 26% 19%
Advertisement 9% 2% 9% 2%
Other Revenues 8% 37% 7% 43%
Total Revenues 100% 100% 100% 100%
7
Due to rounding-off, figures presented in the charts and table may not add up precisely to the totals provided.
34Lakhs                      10%             ₹172   ₹78

                              128Lakhs                      24%             ₹202   ₹78
Footfalls with Management properties: Q4FY21: 34.3 lacs, Q4FY20: 134 lacs

                                                                                         8
38Lakhs                       8%   ₹170   ₹77

                                 660Lakhs                      28%    ₹200   ₹80
Footfalls with Management properties: FY21: 39 lacs, FY20: 693 lacs
                                                                                   9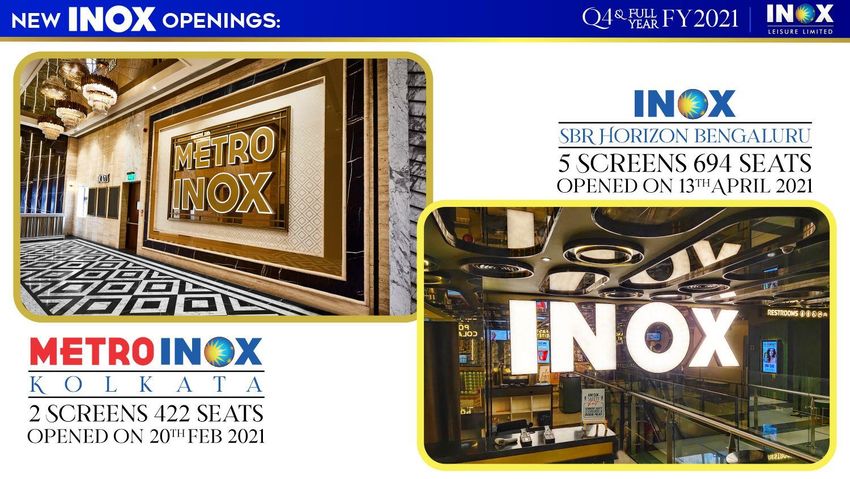
60. 0%

   50. 0%

   40. 0%

   30. 0%

   20. 0%

                  42.0%               47.0%              43.8%               46.6%

   10. 0%

    0.0 %

                 Q4FY20              Q4FY21               FY20                FY21

100.0%

 90.0%

 80.0%

 70.0%

 60.0%

 50.0%

                 73.6%               72.3%               74.9%               71.6%
 40.0%

 30.0%

 20.0%

 10.0%

  0.0%

                Q4FY20              Q4FY21                 FY20                FY21
            Note: In Q4/ FY21, F&B margin is affected due to low off-take and higher wastages
                                                                                                10
            NBOC = Net Box Office Collection
IND AS 116 IMPACT ON PROFIT & LOSS
Q4FY21 Q3FY21 Q4FY20 FY21 FY20 In ₹ Cr
Consolidated Profit & Loss Ind AS 116 Without Without Without Ind AS 116 Without Without
Reported Reported
Impact Ind AS 116 Ind AS 116 Ind AS 116 Impact Ind AS 116 Ind AS 116
Total Revenue 119 - 119 21 376 148 - 148 1,915
Exhibition Cost 23 - 23 3 94 26 - 26 496
Food & Beverages Cost 7 - 7 1 25 8 - 8 125
Employee Benefits Expense 26 - 26 21 33 87 - 87 142
Property Rent & CAM 19 49 67 46 83 48 74 123 368
Rent concessions (Note 1) -26 26 - - - -222 222 - -
Power & Fuel, R&M 24 - 24 13 32 46 - 46 156
Other Expenses 32 - 32 16 70 63 - 63 279
Total Expenses 104 75 179 101 337 56 296 352 1,567
EBITDA 15 -75 -60 -79 40 92 -296 -204 347
Depreciation & Amortisation 70 -42 28 28 28 283 -170 113 108
EBIT -55 -33 -88 -107 12 -191 -126 -317 239
Finance Cost 62 -59 3 4 4 251 -234 17 12
Exceptional Items (Note 2) 4 - 4 - - 4 - 4 -
PBT -121 26 -95 -111 7 -446 108 -339 228
Current tax - - - - 0.09 - - - 73
Deferred tax -26 6 -19 -28 3 -107 27 -80 7
Impact of deferred tax asset
remeasurement on account of change - - - - 7 - - - 7
in tax rate
Taxation pertaining to earlier years -1.7 - -1.7 - -0.14 -1.8 - -1.8 -0.6
PAT -94 19 -74 -83 -2.5 -338 81 -257 141
Basic Earnings Per Share (EPS) -8.37 1.72 -6.65 -7.87 -0.25 -32.22 7.69 -24.53 14.35
Note : 1) The Company has recognised rent concessions aggregating to ₹ 26 cr/₹ 222 cr (after adjusting rent expense of ₹ 6.4cr/₹7.59 cr) for the quarter/year ended 31 March 2021. The Group has applied the
practical expedient to all COVID-19 related rent concessions that meet the conditions in paragraph 46B of the Ind AS 116: Leases, as amended by the Companies (Indian Accounting Standards) Amendment Rules,
2020 and elected not to assess whether such rent concession is a lease modification. In accordance with principles of fair presentation, the amount of rent concessions has been disclosed as a separate line item in
the financial results.
2) Exceptional item during the quarter and year ended 31 March 2021 is towards entertainment tax subsidy recoverable in respect of one of the multiplexes being written off, after adjusting the corresponding
balance in the deferred revenue account.
Due to rounding-off, figures presented in the table may not add up precisely to the totals provided. 11STRONG BALANCE SHEET AS ON 31st March 2021
In ₹ Cr
Consolidated Balance Sheet Mar-21 Mar-20
Sources of Funds
Share Capital 112 103
[+]Other Equity 520 552
[+]Interest in INOX Benefit Trust, at cost - (33)
Total Shareholder funds
[+]Non-Controlling Interest
633
0.01
622
0.01
₹
Total Equity 633 622
[+]Gross Debt 104 158
[+]Lease Liability 2,740 2,662
[+]Other Non-Current Liabilities 81 92
Total Sources of Funds 3,558 3,533
Application of Funds
Fixed Assets (Excl Right of Use) 1,021 1,087
[+]Right of Use 2,116 2,142
[+]Other Non-Current Assets 504 413
[+]Net Current Assets Notes
*During FY 2019-20, 'IND AS 116: Leases' has replaced the earlier lease standard 'Ind AS17: Leases' , thereby having
Other Current Assets 64 129
significant impact on the financial statements from F.Y. 2019-20 onwards, particularly recognition of Right of Use assets
Cash & Bank Balance and Liquid Mutual funds 78 45 and Lease liability. Since it has no business impact, the impact of Ind AS116 for Mar’21 and Mar’20 is excluded while
[-] Current Liabilities 226 282 computing EBIT, PAT, Equity, Gross debts and the corresponding ratios for Mar’21 and March'20 are computed
accordingly.
Net Current Assets (84) (108) 1. Net Debt = [Gross Debt] Less [Cash & Bank and Liquid MF Investments]
Total Application of funds 3,558 3,533 2. Net Debt to Equity is calculated by excluding impact of Ind AS116 from Equity , also lease liability has been excluded from
Net Debt
3. ROE (TTM) is calculated by excluding impact of Ind AS116 from PAT and Equity
Key Balance sheet Ratios *Mar-21 *Mar-20 4. ROCE (TTM) is calculated by excluding impact of Ind AS116 on EBIT & Equity, also lease liability is excluded from Gross Debt
5. ROE (TTM) : PAT/Avg. Equity, ROCE: EBIT/Avg. Capital Employed (Capital Employed = Equity + Gross Debt)
Net Debt : Equity 0.02 0.10 6. Due to rounding-off, figures presented in the above table may not add up precisely to the totals provided and percentages
Return on Equity (ROE) -22.6% 13.7% may not precisely reflect the rounded-off figures.
Return on Capital Employed (ROCE) -25.1% 20.6% 12OPERATIONAL FIXED COST
Employee Benefit Expense (Incl. Agency Power & Fuel, R&M (₹ Cr)
Manpower) (₹ Cr)
38.6
45.0
40.0
32.3
80.0
72.2 67.5
35.0
70.0
30.0
24.1
25.0
60.0
37.0
20.0
50.0
15.0
12.8
24.9 25.3
40.0
30.0
15.7
10.0
3.8 5.2
20.0
5.0
10.0
-
Q3FY20 Q4FY20 Q1FY21 Q2FY21 Q3FY21 Q4FY21 Q3FY20 Q4FY20 Q1FY21 Q2FY21 Q3FY21 Q4FY21
*Rent & CAM (₹ Cr) Other Overheads (₹ Cr)
120 .0 40.0
35.8 35.6
97.1 35.0
82.7
100 .0
67.2
30.0
80.0
25.0
20.5
60.0
46.4
20.0
40.0 13.5 12.1
9.6
15.0
20.0
0 0
10.0
- 5.0
Q3FY20 Q4FY20 Q1FY21 Q2FY21 Q3FY21 Q4FY21 Q3FY20 Q4FY20 Q1FY21 Q2FY21 Q3FY21 Q4FY21
*During FY 2019-20, 'IND AS 116: Leases' has replaced the earlier lease standard 'Ind AS17: Leases‘, thereby having significant impact on the
financial statements from F.Y. 2019-20 onwards, particularly recognition of Right of Use assets and Lease liability. Since it has no business impact
the above Rent & CAM excludes impact of INDAS 116 in all the quarters.
Note: In this slide, Agency manpower has been regrouped from Other overheads into Employee benefit Expense 13SHAREHOLDING STRUCTURE
Share Price Performance
600
Market Data As on 23-Apr-21
500 No. of Shares Outstanding (Cr) 11.3
400 Face Value ( ₹ ) 10.0
300 Price ( ₹ ) 270.5
200 52 week High/Low ( ₹ ) 358.55/158.20
100 Market Capitalisation ( ₹ Cr) 3,047
0 Source: BSE
Oct-15
Oct-16
Oct-17
Oct-18
Oct-19
Oct-20
Apr-15
Apr-16
Apr-17
Apr-18
Apr-19
Apr-20
Apr-21
Jul-15
Jul-16
Jul-17
Jul-18
Jul-19
Jul-20
Jan-16
Jan-17
Jan-18
Jan-19
Jan-20
Jan-21
Source: BSE, * Calculated from April 1, 2015 to February 24,2020 on daily basis
Key Institutional Investors – 23-Apr-2021 %
ICICI Prudential MF 9.48%
% Shareholding as on 23rd Apr 2021 BNP Paribas 4.52%
Public/Others, 16.76% Kuwait Investment Authority Fund 3.09%
HDFC MF 2.86%
DSP MF 2.67%
Promoter &
Promoter Abu Dhabi Investment Authority 2.54%
Group, Taiyo Greater India Fund 2.42%
47.38% DII, 20.00%
Nippon MF 1.36%
Eastspring Investments 1.12%
Sundaram MF 1.06%
FII, 15.86%
Source: BSE Source: Company 14Properties Openings
Property Openings Opened Property Screens Seats
Gurgaon Ardee 13-Jan-21 1 4 120
Gurgaon Sapphire Sec 90 13-Jan-21 1 4 752
Salem Reliance Mall 13-Jan-21 1 3 801
R Mall Thane 26-Jan-21 1 4 240
Kolkata Metro 20-Feb-21 1 2 422
FY21 Property Openings 5 17 2335
Bengaluru SBR Horizon 13-Apr-21 1 5 694
1516
SCREEN OUTLOOK FOR FY22
                        FY22 Pipeline                                                       Properties Screens   Seats
Properties/Cities             Properties Screens Seats             Upto Apr'21                    153      648   147,436
Bengaluru SBR Horizon1               1            5        694     FY22 Expected Openings          10       44     8,156
Tumkur2                              1            5       1,061    At the End of FY22             163      692   155,592
             2
Bhilwara                             1            3        670     Additions Post FY22            137      958   178,607
                 2
Guwahati                             1            4        158     Leading to                     300    1,650   334,199
         2
Jaipur                               1            3        550
Dhanbad2                             1            4        887
Hyderabad3                           1            8       1,483
             3
Gurgaon                              2           11       1,893
         3
Patna                                1            3        600
Vizag3                               1            3        854
FY22 Pipeline Total                 11           49       8,850
Note:
1. Bengaluru SBR Horizon open date : 13th Apr’21
2. In the above table, 19 screens are carried forward from the
    FY21 pipeline. 90% of the work is complete on these screens.
3. Opening of the remaining 25 screens will be decided once
    situation normalizes.
                                                                                                                           17
One of India’s Largest Multiplex Chain
PUNJAB | 3 Properties | 13 Screens
UTTAR PRADESH | 12 Properties | 54 Screens
DELHI | 5 Properties | 16 Screens JHARKHAND | 1 Property | 4 Screens
HARYANA | 8 Properties | 27 Screens
RAJASTHAN | 13 Properties | 47 Screens
MADHYA PRADESH | 5 Properties | 28 Screens Assam | 1 Property | 2 Screens
GUJARAT | 20 Properties | 81 Screens WEST BENGAL | 16 Properties | 61 Screens
ODISHA | 4 Property | 14 Screens
MAHARASHTRA | 28 Properties | 133 Screens
CHHATTISGARH | 2 Properties | 8 Screens
GOA | 4 Properties | 14 Screens
TELANGANA | 3 Properties | 19 Screens
KARNATAKA |13 Properties | 54 Screens
ANDHRA PRADESH | 8 Properties | 33 Screens
KERALA |1 Property | 6 Screens TAMIL NADU | 6 Properties | 34 Screens
*Includes 8 Management Properties with 29 screens and 7355 seats 18Movies Released in Q4FY21
KRACK UPPENA POGARU
MASTER
[TELEGU] [TELEGU] [KANNADA]
[TAMIL]
9th Jan 2021 12th Feb 2021 19th Feb 2021
13th Jan 2021
CAST CAST CAST
CAST
Ravi Teja, Varalaxmi, Vijay Sethupathi, Kriti Druva Sarja, Rashmika
Vijay, Vijay Sethupathi,
Shruti Hassan Shetty, Vaishnav Tej DIRECTOR
DIRECTOR
DIRECTOR DIRECTOR Nanda Kishore
Lokesh Kanagaraj
Gopichand Malineni Buchi Babu Sana
ROOHI MUMBAI SAGA GODZILLA VS. KONG
JATHI RATNALU [ENGLISH]
[HINDI] [HINDI]
[TELEGU] 24th Mar 2021
11th Mar 2021 19th Mar 2021
11th Mar 2021 CAST
CAST CAST
CAST Millie Bobby Brown,
Rajkumar Rao, Janhvi John Abraham,
Naveen Polishetty, Alexander Skarsgård
Kapoor Emraan Hashmi
Priyadarshi DIRECTOR
DIRECTOR DIRECTOR
DIRECTOR Adam Wingard
Hardik Mehta Sanjay Gupta
Anudeep
19Upcoming Bollywood Movie Line Up
Film Name Language Starcast Director
BUNTY AUR BABLI 2 HINDI RANI MUKERJI, SAIF ALI KHAN, SIDDHANT CHATURVEDI, SHARVARI WAGH VARUN V SHARMA
SOORYAVANSHI HINDI AKSHAY KUMAR, KATRINA KAIF, GULSHAN GROVER, CAMEO AJAY DEVGAN & RANVEER SINGH ROHIT SHETTY
SATYAMEVA JAYATE 2 HINDI JOHN ABRAHAM, DIVYA KHOSLA KUMAR MILAP ZAVERI
BELL BOTTOM HINDI AKSHAY KUMAR, MRUNAL THAKUR RANJIT TIWARI
RANVEER SINGH, DEEPIKA PADUKONE, SAHIL KHATTAR, CHIRAG PATIL, AMMY VIRK, DHAIRYA KARWA, TAHIR
83 (3D/2D) HINDI RAJ BHASIN etc. KABIR KHAN
SHAMSHERA HINDI RANBEER KAPOOR, SANJAY DUTT, VAANII KAPOOR KARAN MALHOTRA
CHANDIGARH KARE AASHIQUI HINDI AYUSHMANN KHURRANA, VAANI KAPOOR ABHISHEK KAPOOR
GANGUBAI KATHIAWADI HINDI ALIA BHATT, AJAY DEVGAN, SHANTANU MAHESHWARI SANJAY LEELA BHANSALI
ATRANGI RE HINDI AKSHAY KUMAR, SARA ALI KHAN, DHANUSH ANAND L RAI
ATTACK HINDI JOHN ABRAHAM, RAKUL PREET SINGH, PREMHANSH, JACQUELINE FERNANDEZ LAKSHYA RAJ ANAND
JAYESHBHAI JORDAAR HINDI RANVEER SINGH, SHALINI PANDEY, BOMAN IRANI, RATNA PATHAK DIVYANG THAKKAR
ANEK HINDI AYUSHMANN KHURRANA ANUBHAV SINHA
DHAAKAD HINDI KANGANA RANAUT, ARJUN RAMPAL, DIVYA DUTTA RAZNEESH GHAI
MAIDAAN HINDI AJAY DEVGAN, KEERTHY SURESH AMIT RAVINDRANATH SHARMA
PRITHVIRAJ (DIWALI) HINDI AKSHAY KUMAR, MANUSHI CHHILAR DR CHANDRAPRAKASH DWIVEDI
JERSEY (DIWALI) HINDI SHAHID KAPOOR, MRUNAL THAKUR, PANKAJ KAPOOR GOWTAM TINNANURI
BHOOL BHULAIYAA 2 HINDI KARTIK ARYAN, KIARA ADVANI, TABU, RAJPAL YADAV ANEES BAZMEE
BRAHMASTRA (PART 1) HINDI RANBIR KAPOOR, ALIA BHATT, AMITABH BACHCHAN, MOUNI ROY, NAGARJUNA AYAN MUKHERJEE
HEROPANTI 2 HINDI TIGER SHROFF, SUTARIA AHMED KHAN
LAL SINGH CHADDHA HINDI AMIR KHAN, KAREENA KAPOOR KHAN ADVAIT CHANDAN
BACHCHAN PANDEY HINDI AKSHAY KUMAR, KRITI SANON, ARSHAD WARSI, JACQUELINE FERNANDEZ, PANKAJ TRIPATHI FARHAD SAMJI
PATHAN HINDI SHAH RUKH KHAN, DEEPIKA PADUKONE, DIMPLE KADADIA SIDDHARTH ANAND
EK VILLAIN RETURNS HINDI JOHN ABRAHAM, DISHA PATANI, TARA SUTARIA, ARJUN KAPOOR MOHIT SURI
LUV RANJAN'S NEXT - RANBIR KAPOOR HINDI RANBIR KAPOOR, SHRADDHA KAPOOR, BONEY KAPOOR, DIMPLE KADADIA LUV RANJAN
Based on various public sources 20Upcoming English Movie Line Up
Film Name Language Starcast Director
TOP GUN 2 MAVERICK ENGLISH JENNIFER CONNELLY, TOM CRUISE, JON HAMM JOSEPH KOSINSKI
MINIONS : THE RISE OF GRU ENGLISH/HINDI Voices of LUCY LAWLESS, JULIE ANDREWS, STEVE CARELL KYLE BADLA, BRAD ABLESON
BLACK WIDOW ENGLISH SCARLET JOHANSSON, FLORENCE PUGH, ROBERT DOWNERY JR CATE SHORTLAND
JUNGLE CRUISE (3D) ENGLISH DWAYNE JOHNSON, EMILY BLUNT, JESSE PLEMONS, JACK WHITEHALL, PAUL GIAMATTI JAUME COLLET-SERRA
THE SUICIDE SQUAD 2 ENGLISH MARGOT ROBBIE, TAIKA WAITITI, IDRIS ELBA, JOEL KINNAMAN JAMES GUNN
THE BOSS BABY : FAMILY BUSINESS ENGLISH Voices of JEFF GOLDBLUM, JAMES MARSDEN, ALEC BALDWIN, EVA LONGORIA TOM MCGRATH
DUNE (3D, IMAX 3D) ENGLISH ZENDAYA, REBECCA FERGUSON, TIMOTHÉE CHALAMET DENIS VILLENEUVE
VENOM: LET THERE BE CARNAGE ENGLISH TOM HARDY, MICHELLE WILLIAMS, WOODY HARRELSON ANDY SERKIS
NO TIME TO DIE (BOND 25) ENGLISH DANIEL CRAIG, NAOMIE HARRIS, LEY SEYDOUX, RALPH FIENNES DANNY BOYLE
THE ETERNALS ENGLISH ANGELINA JOLIE, SALMA HAYEK, RICHARD MADDEN, KIT HARINTON CHLOE ZHAO
MISSION IMPOSSIBLE 7 ENGLISH REBECCA FERGUSON, TOM CRUISE, HAYLEY ATWELL CHRISTOPHER MCQUARRIE
KING RICHARD ENGLISH WILL SMITH, AUNJANUE ELLIS, JON BERNTHAL, LIEV SCHREIBER REINALDO MARCUS GREEN
SPIDERMAN - NO WAY HOME ENGLISH TOM HOLLAND, ZENDAYA, BENEDICT CUMBERBATCH, MARISA TOMEI, JAMMIE FOX JON WATTS
THE MATRIX 4 - IMAX ENGLISH KEANU REEVES, JONATHAN GROFF, CARRIE-ANNE MOSS, YAHYA ABDUL-MATEEN II LANA WACHOWSKI
KINGSMAN : THE GREAT GAME ENGLISH RALPH FIENNES, STANLEY TUCCI, DANIEL BRÜHL, MATTHEW GOODE, GEMMA ARTERTON MATTHEW VAUGHN
MORBIUS ENGLISH MICHAEL KEATON, JARED LETO, ADRIA ARJONA, MATT SMITH DANIEL ESPINOSA
DEATH ON THE NILE ENGLISH GAL GADOT, KENNETH BRANAGH, ARMIE HAMMER SIR KRENETH BRANAGH
THE BATMAN ENGLISH CHARLIE CARVER, ROBERT PATTINSON, ZOË KRAVITZ, COLIN FARRELL MATT REEVES
DOCTOR STRANGE IN THE MULTIVERSE OF
MADNESS ENGLISH Elizabeth Olsen, Rachel McAdams, Benedict Cumberbatch Sam Raimi
Based on various public sources
21Upcoming Other Indian Languages Movie Line Up
Film Name Language Starcast Director
TUCK JAGADISH TELUGU NANI, AISHWARYA RAJESH, RITU VARMA SIVA NIRVANA
ACHARYA TELUGU CHIRANJEEVI, RAM CHARAN TEJA, KAJAL AGARWAL KORTALA SIVA
MARAKKAR ARABIKADALINTE SIMHAM MALAYALAM MOHANLAL, SUNIEL SHETTY, ARJUN SARJA, KEERTHY SURESH, PRABHU PRIYADARSHAN
DOCTOR TAMIL SIVAKARTHIKEYAN,PRIYANKA ARUL MOHAN NELSON DILIPKUMAR
KAATHUVAKULA RENDU KADHAL TAMIL VIJAY SETHUPATHI, NAYANTHARA,SAMANTHA VIGNESH SHIVAN
VALIMAI TAMIL AJITH KUMAR, HUMA QURESHI, KARTIKEYA, PAVAL NAVAGEETHAN, YOGI BABU VINOTH H
THUKLAQ DARBAR TAMIL VIJAY SETHUPATHI, GAYATHRI
MOST ELIGIBLE BACHELOR TELUGU AKHIL AKKINENI, POOJA HEGDE BOMMARILLU BHASKAR
MAJOR HINDI/TELUGU ADIVI SESH, SOBHITA DHULIPALA, SAIEE MANJREKAR SASHI KIRAN TIKKA
COBRA TAMIL VIKRAM, IRFAN PATHAN, SRINIDHI SHETTY, ANAND RAJ AJAY GNANAMUTHU R
HINDI/KANNADA/TAMIL/ YASH, SANJAY DUTT, RAVEENA TANDON, SRINIDHI SHETTY, ANANT NAG, PRAKASH RAJ
K.G.F. CHAPTER 2 TELUGU/MALAYALAM etc. PRASHANTH NEEL
ANNABELLE SUBRAMANIAM TAMIL VIJAY SETHUPATHI, TAPSEE PANNU, RADHIKA SARATHKUMAR, DEEPAK SUNDARRAJAN
HINDI/TAMIL/TELUGU/
RADHE SHYAM MALAYALAM PRABHA, POOJA HEGDE RADHA KRISHNA KUMAR
HINDI/TELUGU/KANNADA/
PUSHPA MALAYALAM/TAMIL ALLU ARJUN, RASHMIKA MANDANNA SUKUMAR BANDREDDI
AYALON TAMIL SIVAKARTHIKAYEN
MAHA SAMUDRAM TELUGU SHARWANAND, SIDDHARTH, ADITI RAO HYDARI AJAY BHUPATHI
F3 TELUGU VENKATESH DAGGUBATI, VARUN TEJ, TAMMANAH BHATIA, MEHREEN PIRZAADA ANIL RAVIPUDI
HINDI/MALAYALAM/TAMIL VIJAY DEVARKONDA, ANANYA PANDAY, RAMYA KRISHNAN, RONIT ROY, VISHU REDDY,
LIGER /TELUGU MAKRAND DESHPANDE PURI JAGANNATH
UNTITLED SURYA TAMIL SURYA PANDIYARAJ
HINDI/TAMIL/TELUGU/
RRR MALAYALAM JR NTR, RAM CHARAN, ALIA BHAT, AJAY DEVGAN, DAISY EDGER-JONES S S RAJAMOULI
ANNATHEY TAMIL RAJANIKANTH, NAYANTHARA, KEERTHY SURESH SIVA
SARKARU VARI PATA TELUGU MAHESH BABU, KEERTHY SURESH PARASURAM
Based on various public sources
2223
24
•

•

    25
•
•
26[Only in States wherein 50% capacity
cap is applicable]
27CASH FLOW PLANNING
• 19 screens are 90% completed; hence would require an
additional CAPEX of ₹8 to ₹10 Crs.
• Opening of the remaining 25 screens will be decided
once the situation normalizes and would require a
CAPEX of ~₹65 crs
• The liquidity position is very strong.
• As on 25th Apr 2021, we have liquidity of more than ₹130 cr
(including undrawn limits of ₹87 cr)
• INOX has passed an enabling resolution to raise upto ₹300 cr
• INOX owns 6 cinema properties and a head office. As per current
market valuation, if required, we can raise ₹350 cr by doing a
‘sale-lease back’ of these properties
• As on 25th Apr’21, Net D/E ratio: 0.05x
• As on 25th Apr’21, our ‘Gross Debt’ is ~₹103 cr (Net Debt ₹55 cr).
2829
CONSOLIDATED BALANCE SHEET
                                                                                                                                 In ₹ Cr
   Equity & Liabilities                                   Mar-21     Mar-20             Assets                         Mar-21    Mar-20
   Equity:                                                                              Non-Current Assets:
     Equity Share Capital                                     112        103             Property, Plant & Equipment      941       975
     Other Equity                                             520        552             Capital work-in-progress          57        85
     Interest in Inox Benefit Trust, at cost                   -          (33)           Right of Use                   2,116     2,142
   Equity attributable to owners of the company               633        622             Goodwill                          18        18
   Non-Controlling Interest                                  0.01        0.01             Other Intangible Assets           6         8
   Total Equity                                                633         622            Other Investments                0.1       0.2
                                                                                          Loans                           105       102
   Non-current liabilities:
                                                                                          Other Financial Assets           87        95
     Borrowings                                                47          20
                                                                                          Deferred Tax Assets (Net)       284       177
     Lease Liability                                        2,659       2,592
                                                                                          Income Tax Assets (Net)           1         7
     Other Financial Liabilities                                7           7
                                                                                          Other Non Current Assets         28        31
     Provisions                                                17          18
                                                                                        Total Non Current Assets         3,642     3,641
     Other Non-current Liabilities                             58          66
                                                                                        Current Assets:
   Total of Non-Current Liabilities                          2,787       2,704
                                                                                          Inventories                      10       14
   Current Liabilities:
                                                                                          Other Investments                0.4        1
     Borrowings                                                20        103              Trade receivables                  4      63
     Lease Liability                                           81          70             Cash and cash equivalents          8      40
     Trade Payables                                           105        130              Bank Balances                    70         4
     Other Financial Liabilities                               97        115              Loans                            0.3        9
     Other Current Liabilities                                 42          51             Other Financial Assets           0.3      0.3
     Provisions                                                19          20             Income Tax Assets (net)           -        -
     Income Tax Liabilities (Net)                              -            3             Other Current Assets             49       43
   Total of Current Liabilities                                364        489           Total Current Assets               142       174
   Total Equity & Liabilities                                3,784       3,815          Total Assets                     3,784     3,815

                                                                                                                                           30
Due to rounding-off, figures presented in the charts and table may not add up precisely to the totals provided.
CONSOLIDATED PROFIT & LOSS (Including INDAS116)
Particulars Q4FY21 Q4FY20 YoY % Q3FY21 QoQ % FY21 FY20 YoY % In ₹ Cr
Total Revenue 119 376 -68.4% 21 466.7% 148 1,915 -92.3%
Exhibition Cost 23 94 -75.5% 3 666.7% 26 496 -94.8%
Food & Beverages Cost 7 25 -72.0% 1 600.0% 8 125 -93.6%
Employee Benefits Expense 26 33 -21.2% 21 23.8% 87 142 -38.7%
Property Rent & CAM 19 8 137.5% 25 -24.0% 48 102 -52.9%
Rent concessions (Note 1) (26) - (54) -51.9% (222) -
Power & Fuel, R&M 24 32 -25.0% 13 84.6% 46 156 -70.5%
Other Expenses 32 70 -54.3% 16 100.0% 63 279 -77.4%
Total Expenses 104 262 -60.3% 25 316.0% 56 1,301 -95.7%
EBITDA 15 115 -87.0% (4) -475.0% 92 614 -85.0%
Depreciation & Amortisation 70 74 -5.4% 71 -1.4% 283 264 7.2%
Finance Cost 62 61 1.6% 62 0.0% 251 221 13.6%
Exceptional Items (Note 2) 4 4
PBT (121) (21) 476.2% (137) -11.7% (446) 129 -445.7%
Current tax - 0.09 -100.0% - - 73 -100.0%
Deferred tax (26) (7) 271.4% (34) -23.5% (107) (28) 282.1%
Impact of deferred tax asset remeasurement on
- 69 -100.0% - - 69 -100.0%
account of change in tax rate
Taxation pertaining to earlier years (1.7) (0.1) 1600.0% - (1.8) (0.6) 200.0%
PAT (94) (82) 14.6% (103) -8.7% (338) 15 -2353.3%
Basic Earnings Per Share (EPS) (8.37) (8.36) 0.1% (9.62) -13.0% (32.22) 1.53 -2205.9%
Note : 1) The Company has recognised rent concessions aggregating to ₹ 26 cr/₹ 222 cr (after adjusting rent expense of ₹ 6.4cr/₹7.59 cr) for the quarter/year ended 31 March 2021. The Group has applied the practical
expedient to all COVID-19 related rent concessions that meet the conditions in paragraph 46B of the Ind AS 116: Leases, as amended by the Companies (Indian Accounting Standards) Amendment Rules, 2020 and elected not
to assess whether such rent concession is a lease modification. In accordance with principles of fair presentation, the amount of rent concessions has been disclosed as a separate line item in the financial results.
2) Exceptional item during the quarter and year ended 31 March 2021 is towards entertainment tax subsidy recoverable in respect of one of the multiplexes being written off, after adjusting the corresponding balance in the
deferred revenue account.
Due to rounding-off, figures presented in the above table may not add up precisely to the totals provided and percentages may not precisely reflect the rounded-off figures. 31TRACK RECORD OF AGGRESSIVE EXPANSION
32Well Diversified Presence Across India
153 Properties * 69 Cities
South, 31, East, 24, East, 10,
South, 15,
• Well Diversified 20% 16%
22% 15%
Distribution of
Multiplexes
across India
West, 23,
West, 57, 33%
• Access to Wide North, 41, 27%
37% North, 21,
30%
Variety of
Regional Content 648 Screens 147,436 Seats
East, 89, East, 22,124
South, South,
• Lower 146, 23%
14%
32,988 , 22%
, 15%
Dependency on
Hindi and English
Content
North, North, West,
157, 24% 34,781 , 24%
West, 256, 39% 57,543 , 39%
*Includes 8 management properties with 29 screens and 7,355 seats 33Balesh Talapady
AVP – Investor Relations & Business Analysis
022- 4062 6927 |
Balesh.Talapady@inoxmovies.com
34You can also read