INQUIRY INTO ROAD SAFETY - August 2021
←
→
Page content transcription
If your browser does not render page correctly, please read the page content below
INQUIRY INTO ROAD SAFETY
                                       August 2021
To:
Joint Select Committee on Road Safety
Parliament House
CANBERRA ACT 2600

From:
Professor (Em.) Raphael Grzebieta, PhD
Emeritus Professor (Road Safety)
Transport and Road Safety (TARS) Research Centre,
School of Aviation, UNSW Sydney

Adjunct Professor
Victorian Institute of Forensic Medicine
Monash University Department of Forensic Medicine

Dear Joint Select Committee on Road Safety,
Re: INQUIRY INTO ROAD SAFETY
I am pleased to provide my perspective of what aspects of road safety in Australia that I
see need to be, and can be, addressed immediately. A summary bio is provided in
Appendix A.
Firstly, these are my personal opinions and not necessarily those of TARS, UNSW or
VIFM, Monash University. I am prepared to offer expert opinion regarding any questions
the committee may want to ask regarding these issues. I would also propose that
colleagues of mine with whom I have worked can also be approached by the committee to
provide testimony in the specific areas I will cover in this submission. They are Professor
Emeritus Ann Williamson from UNSW on Heavy Vehicle and Workplace Safety, Professor
Jake Olivier on the pedestrian impact and cyclist safety statistics from UNSW, A/Prof
George Rechnitzer on heavy truck vehicle crashworthiness, and A/Prof Rechnitzer and
Mrs Tia Gaffney regarding vehicle rollover crashworthiness and EDR crash investigations.
Secondly, can I say at the outset that I have a long history and track record in making
submissions to government inquests focussing on aspects of road safety. I also regularly
provide expert opinion to Coronial Inquests on aspects of road safety and crash
investigations. My last submission to a government inquiry was to the Federal
Government’s “Senate Standing Committee on Rural and Regional Affairs and Transport
Grzebieta: Page 2 of 25

References Committee Inquiry” into “Aspects Of Road Safety In Australia” together with
Prof. Ann Williamson and Prof. Jake Olivier. Whilst we did not make any specific
recommendations but rather provided scientific information concerning certain aspects of
road safety problems and any evidentiary support for countermeasures, I note a number of
recommendations were made:
https://www.aph.gov.au/Parliamentary_Business/Committees/Senate/Rural_and_Regional
_Affairs_and_Transport/Road_safety/~/media/Committees/rrat_ctte/Road_safety/Interim_
Report/report.pdf.
I note that the government response was:
https://www.aph.gov.au/DocumentStore.ashx?id=433120a6-95b4-40bc-8f0e-
0238a0d280c9
which supported most of the recommendations but not all of them. My focus is on those
aspects of road safety problems where I see have not been addressed by the government
response (either adequately or at all) and where there is an overwhelming need to act and
a strong evidence based solution exists.

Speed limits throughout Australia.
This is a particularly challenging topic for politicians in general and the most contentious
issue regarding any developments of road safety strategy (see: Mooren at al 2013) 1. Not
enough progress is being done in this space. This is mostly because of Political pushback.

Speed limits set throughout Australia are often inappropriately high for the road conditions
within which vehicles have to travel. The key factors in settings speed limits appeared to
be at odds with the safe system strategy and principles outlined in numerous scientific
publications and in Austroads guidelines. Wooley at al. (2018)2 in the Austroads ‘Towards
Safe System Infrastructure: A Compendium of Current Knowledge’ states:
     “ Speed is at the heart of a Safe System and aspirational design speeds include: 30 km/h (car
       vs pedestrian/cyclist), 50 km/h (car vs car side impact at 90 degrees) and 70 km/h (car vs car
       head-on).”

Speed limits on any rural road that does not have roadside safety barriers to prevent
run-off-the-road-crashes and median safety barriers that prevent head-on collisions, need
to be set to a maximum speed limit of 80 km/h. The survivability of occupants travelling in
a 5 star NCAP vehicle is at it’s maximum survivability range in a vehicle to vehicle head-on
impact or an impact into a large tree in the range of between 70 and 80 km/h. Similarly, the
Wramborg (2005) curves shown in Wooley at al. (2018) indicate an aspirational operating
speed of 70 km/h limit for a Safe System. So why not set Australia’s maximum speed limit
for any road where the possibility of a head-on or tree collision can occur (most Australian
rural roads) closer to this speed limit?
A run-off-the-road crash into one of the trees visible in Figure 1 would likely not be
survivable at an impact speed of 100 km/h in any car or SUV regardless of their

1
    Mooren, L, Grzebieta, R H, Job, S, (2013). Speed - the biggest and most contested road killer, 2013 Australasian
    College of Road Safety Conference – “A Safe System: The Road Safety Discussion” Adelaide.
    https://acrs.org.au/article/speed-the-biggest-and-most-contested-road-killer/ (includes PPT presentation)
2
    Woolley J., Stokes C., Turner B., Jurewicz C., (2018). Towards Safe System Infrastructure: A Compendium of Current
    Knowledge, Austroads Publication No. AP-R560-1, Project Manager: Brodie C., ISBN 978-1-925671-28-5. AP-R560-18-
    Towards_Safe_System_Infrastructure_A_Compendium_of_Current_Knowledge (austroads.com.au)

                  Submission to Joint Select Committee on Road Safety: Inquiry Into Road Safety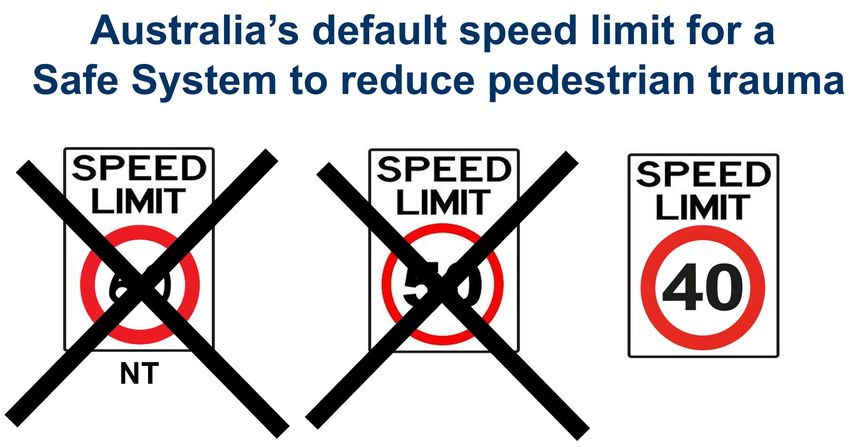
Grzebieta: Page 3 of 25

crashworthiness or ANCAP star rating. We commonly see speed limits of 100 km/h on
rural roads, e.g. those shown in Figure 1.

        Figure 1: Typical rural roads where speed limits have been set to 100 km/h

We even see speed limits of 110 km/h set in Western Australia and 130 km/h in the
Northern Territory (NT) on roads where there are no median barriers, shoulder sealing or
tactile line marking. Outer regional, remote and very remote regions along with the NT
have one of the worst fatality rates per head of population of any OECD nation (see below
graph from the BITRE webpage). This is due mainly to speed but also fatigue, drink driving
and distraction behavioural issues.

  Source: BITRE – https://www.bitre.gov.au/publications/ongoing/international_road_safety_comparisons

             Submission to Joint Select Committee on Road Safety: Inquiry Into Road Safety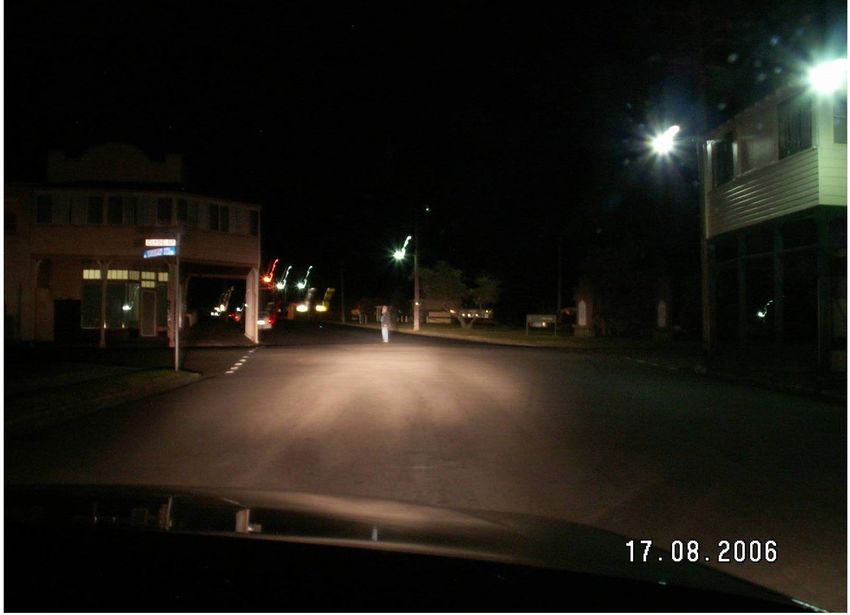
Grzebieta: Page 4 of 25

It is difficult for the general community to understand the effects of speed and the kinetic
energy associated with a travelling speed. However, if presented in the form of visualising
equivalent speed to driving/riding/jumping off the roof or out of a window of a building, the
physics of the problem starts to be understood very quickly as shown in Figure 2. It
becomes obvious that a driver and passengers, a motorcyclist or a pedestrian would balk at
being willing to drive off, ride off or jump off the roof or out of a window of a multistorey
storey building hoping to survive hitting the ground below, even in a 5 star ANCAP vehicle
and/or wearing the best of personal protection such as a helmet and protective clothing.

                                  What is a survivable impact speed?

Figure 2: Equivalent speed reached at ground level if driving/riding/jumping off roof or out
          the window of multi storey building and crashing into a hard object e.g. ground,
          tree, pole or bridge pillar. (building diagram source: Murray N.W. (1995)3)

Thus, I am recommending that an Australian wide default speed limit in the Australia Road
Rules - Part 3 Reg 25, of 80 km/h for rural roads that are not a built up area and that have
had no or minimal road safety treatment, e.g. AusRAP 1 to 3 star roads which are most
Australia rural roads. For definition of AusRAP star rating see David Moir’s presentation 4
and key extracts from it shown in Figure 3.
A common point of resistance to lowering speed limits on rural roads has been the argument
related to travel times and fatigue. The fatigue argument is a myth which should be dismissed
immediately. Both the travel time and fatigue issue has been well covered by Wooley et al
(2018)2 in the Austroads publication Austroads ‘Towards Safe System Infrastructure: A
Compendium of Current Knowledge’ where they state:
     “ …The travel time argument is often raised by the community around a perception that lower
       speed limits will dramatically increase travel times and hence fatigue, especially in rural areas.
       Evidence to date suggests that where speed limits are lowered, net road injury reduces and
       there appears to be no dominating effect of fatigue crashes. …

       Dutschke and Woolley (2010) presented a study into the effects on travel times by the change
       in speed limit from 110 km/h to 100 km/h along a number of rural highways in South Australia.
       … ….In relative terms, this means that a journey that took 60 minutes at 110 km/h would take
       between 61 and 66 minutes at 100 km/h.”

3
    Murray, N.W. (1995). When It Comes to the Crunch: The Mechanics of Car Collisions, World Scientific Publishing
    Company, ISBN-10: 9810220960
4
    Moir D., (2008). Safer Roads Seminar, RACWA, https://www.slideshare.net/EngineersAustralia/safer-roads-by-david-
    moir?from_action=save

                 Submission to Joint Select Committee on Road Safety: Inquiry Into Road Safety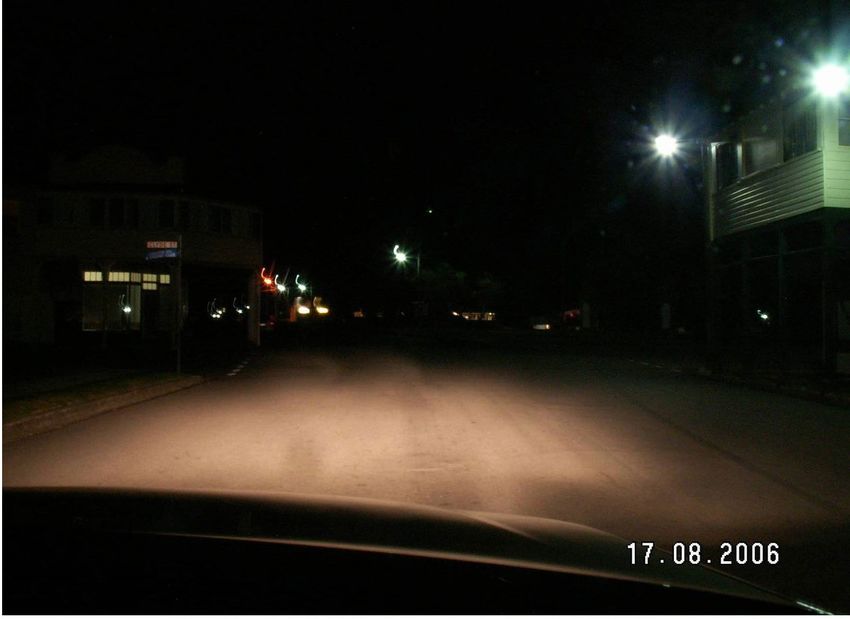
Grzebieta: Page 5 of 25

  Figure 3: Examples of 2, 3 and 4 Star Rated roads. Source – David Moir AusRAP Safer
                         Roads Seminar, RACWA, August 2008

Theoretically the travel time for a 100 km journey at 80 km/h would be 15 minutes longer than
the same journey travelled at 100 km/h. However as pointed out by Wooley et al (2013)2,
  “ The proportional increase in travel time will generally be less than the decrease in speed limit.
    There are a number of reasons for this:

     • The actual reduction in average travel speed is less than the reduction in speed limit

     • Vehicles are unlikely to travel at free speeds for 100% of a journey

     • Other sources of influence on a vehicle’s speed can include townships, intersections,
       curves, grade changes and interactions with other traffic.”

In other words, if the speed limit on a rural road was decreased from 100 km/h to 80 km/h for
an AusRAP 3 star or less rural road, the expected increase in travel time would likely be less
than 15 minutes longer and more like between 1 to 12 minutes longer. One would think that an
extra 12 minutes added to a 100 km journey would be worth saving lives and a small
inconvenience for the majority of drivers on rural roads that do not have any median and
roadside barriers.

            Submission to Joint Select Committee on Road Safety: Inquiry Into Road Safety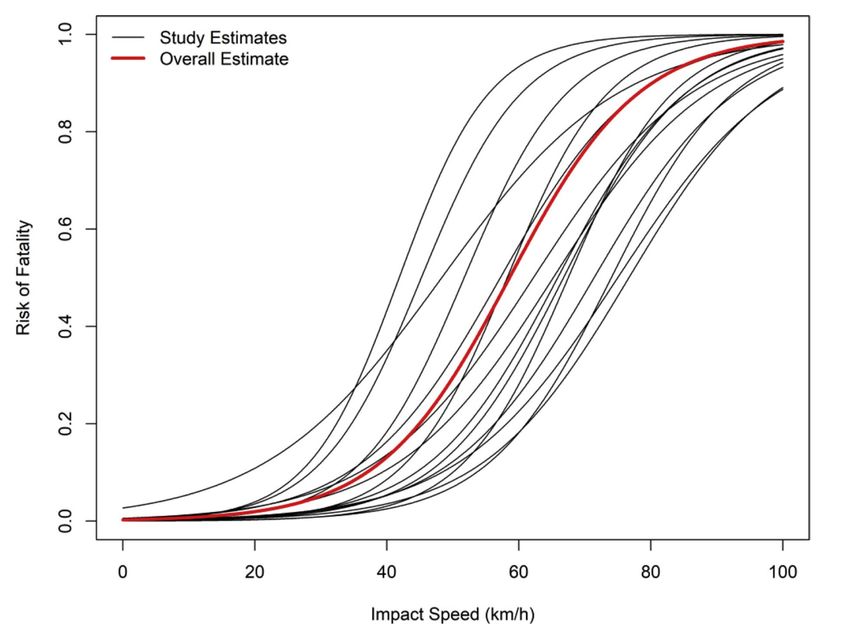
Grzebieta: Page 6 of 25

Moreover, Tingvall and Haworth (1999)2,5 point out that from the ethical and moral imperative,
     “ It can never be ethically acceptable that people are killed or seriously injured when moving
       with the road transport system…

       … The designers of the system are always ultimately responsible for the design, operation and
       use of the road transport system and thereby responsible for the level of safety within the
       entire system…

       …If road users fail to obey these rules due to lack of knowledge, acceptance or ability, or if
       injuries occur, the system designers are required to take necessary further steps to counteract
       people being killed or seriously injured…

       … Life and health can never be exchanged for other benefits within the society

       …Whenever someone is killed or seriously injured, necessary steps must be taken to avoid a
       similar event... "

Hence, any arguments concerning travel times should be considered in light of the above.
Given the massive lockdown restrictions to prevent deaths in COVID-19 related infections,
where less people have died from COVID than those in a year on Australian Roads, from an
ethics and moral perspective the Joint Select Committee should give serious consideration to
this proposal. It is a scientifically valid and ethically moral step forward that could be taken in
road trauma reduction consistent with Safe System principles. 80 km/h is a more forgiving
travel speed than 100 km/h, 110 km/h or 130 km/h in terms of human factors perception and
reaction time as well as crash severity if travelling in a ANCAP 5 star vehicle. If the road has
sealed shoulders, tactile line marking and roadside and median safety barriers installed, then
the speed limit can be set higher, e.g. such as for a 4 star road to 90 or 100 km/h or even
110 km/h for 5 star dual carriageway.
Recommendation 1: That the Australian national default speed limit be set to 80 km/h for
                  undivided roads that have had minimal road safety treatment (e.g.
                  AusRAP 3 star or less roads with no median barriers) and that this is set
                  out in the Australia Road Rules - Part 3, Regulation 25 Speed-Limit
                  Elsewhere.

Regarding speed limits for the urban environment, there have been numerous calls for
setting the speed limit to 30 km/h in pedestrian intensive areas such as CBDs and Town
Centres. There are some submissions to this inquiry recommending this speed limit be
adopted throughout the suburban residential streets. Moreover, best practise road safety
nations such as Sweden, the Netherlands and the UK have adopted such low speed limits
and shown significant reductions in pedestrian/cyclist fatalities and serious injuries.
Reference is often made to the Wramborg curves (see: Section 4.5 in Wooley et al.
(2018)2). Whilst I do not disagree with such a recommendation, I feel that this may be a
step too far for most drivers and Local Government regulators as well as some politicians.
The default speed limit (Australia Road Rules - Part 3, Regulation 25 Speed-Limit
Elsewhere) is currently set at 50 km/h. This is too high.

5
    Tingvall, C., & Haworth, N. (1999). Vision Zero–An ethical approach to safety and mobility. Paper presented at the 6th
    ITE International Conference Road Safety & Traffic Enforcement: Beyond 2000, Melbourne, Australia.
    https://eprints.qut.edu.au/134991/3/134991.pdf

                  Submission to Joint Select Committee on Road Safety: Inquiry Into Road Safety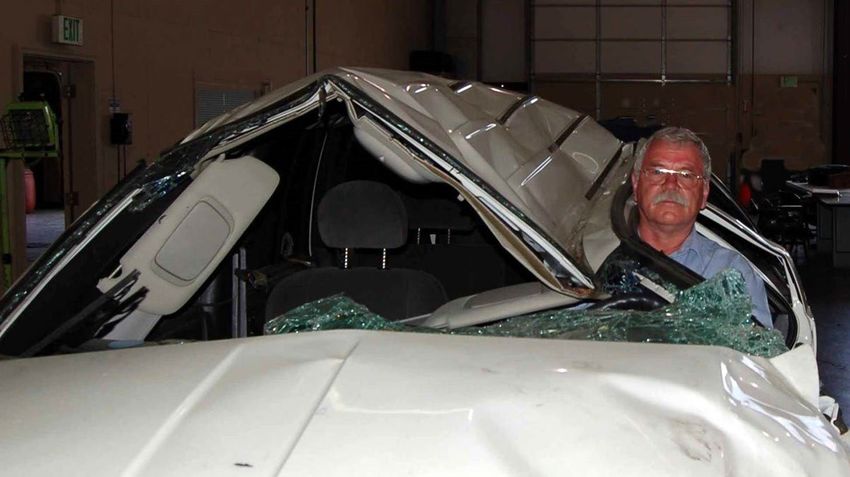
Grzebieta: Page 7 of 25

My recommendation is to set Australia’s default speed limit to 40 km/h, which is a more
politically palatable speed for most drivers travelling within a suburban residential low speed
street environment, where pedestrians are walking, mowing, chatting, cyclists are riding and
vulnerable children in particular can be found sometimes playing. This is also a speed which
has already in large part been adopted in most Australian CBDs and Town Centres as well
as outside School Zones during drop off and pick up times. I suspect there would be little
resistance to the lowering of the current default 50 km/h speed limit to 40 km/h. This 10
km/h differential would have a substantive road safety benefit and significant harm reduction
gain with respect to pedestrian and cyclist casualties, with a very strong, in fact the
strongest to date, scientific underpinning. My reasoning is as follows.
When the pedestrian impact test procedures for the consumer EuroNCAP and ANCAP car
pedestrian impact star ratings were being developed, a Japanese researcher Mizuno
(2005)6 found when he analysed pedestrian injury data, that the cumulative frequency of a
serious head injury begins to rapidly rise at collision speeds above 30 km/h. Figure 4 shows
the cumulative frequency versus impact speed. At Australia’s default speed limit of 50 km/h,
the cumulative frequency of a serious or fatal (MAIS 3-6) head injury rises to 60%.
One could deduce from this graph that 30 km/h is most likely a safer speed at which
pedestrians could be struck with only a 10% cumulative frequency of a serious or fatal
head injury, after which at higher speeds the cumulative amount rapidly rises. This would
in effect, scientifically justify the choice of a 30 km/h speed limit being proposed by a
number of road safety advocates and adopted by best road safety practise countries.
However, what this does not account for is the speed prior to impact of the vehicle, e.g. the
vehicle could have been braking prior to collision.

    Figure 4: Cumulative frequency of serious and fatal injuries versus impact speed for a car/SUV
                into pedestrian collision. MAIS is Maximum Abbreviated Injury Scale.

6
    Mizuno, Y. (2005). Summary of IHRA pedestrian safety WG activities (2005) – proposed test methods to evaluate
    pedestrian protection afforded by passenger cars, in 19th International Technical Conference on the Enhanced
    Safety of Vehicles (ESV), 6–9 June 2005, Washington, DC, US, 1–15.

                 Submission to Joint Select Committee on Road Safety: Inquiry Into Road Safety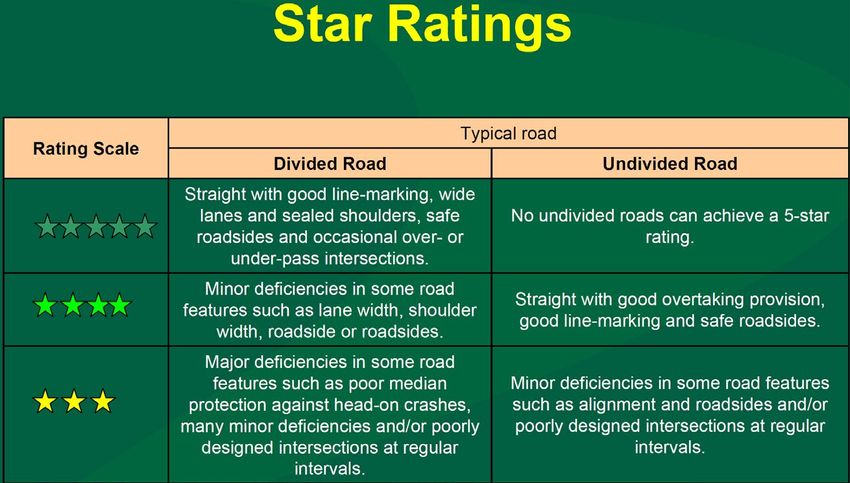
Grzebieta: Page 8 of 25

Some researchers have questioned the Wramborg (2005) fatality versus impact speed risk
curves.2,7 in terms of the data source and basis on which these curves were developed.
Woolley et al (2018)2 states:
     “ …little is known about the source of these relationships. The Wramborg (2005) conference
       paper did not provide any research references or sources of information for the impact speed
       curves. There was no way of checking these relationships against similar or prior research.
       The context of the paper is the establishment of the Vision Zero-based road hierarchy in
       Sweden, and this indirectly suggests that the curves were in use prior to 2005. Tingvall and
       Haworth (1999) also note the 10% fatality risk threshold speeds, referencing only high-level
       policy documents and keynote presentations as sources…”

Thus, it was decided by our TARS UNSW team to carry out a systematic review and meta-
analysis, which carries the greatest weight in terms of hierarchy of evidence 8 to determine
what is the fatality risk versus impact speed. 9 All published pedestrian collisions studies
were analysed in 2019 by our UNSW Sydney, Transport and Road Safety (TARS)
Research team that was led by Prof. Olivier from the School of Mathematics and Statistics
and myself from TARS UNSW together with Prof. Tom Brijs from Hasselt University in
Belgium. Fifty-five studies were identified for a full-text assessment, 27 met the inclusion
criteria, and 20 were included in a meta-analysis. Figure 5 shows an overview of S-shaped
curves synthesizing all included studies and the thicker red curve is plotted according to
the results from the multivariate meta-regression model. The study suggests that the risk
of a fatality at an impact speed of 50 km/h is around 30%, whereas at an impact speed of
40 km/h the fatality risk drops to 13% and at 30 km/h it is 5%.

          Figure 5: Plot for S-shaped curves for pedestrian fatality risk by impact speed.

7
    Wramborg, P 2005, ‘A new approach to a safe and sustainable road structure and street design for urban areas’,
    Road safety on four continents conference, 2005, Warsaw, Poland, Swedish National Road and Transport Research
    Institute (VTI), Linkoeping, Sweden, 12 pp
8
    Australian Government, Therapeutic Goods Administration, Guidelines on the evidence required to support
    indications for listed complementary medicines, https://www.tga.gov.au/book-page/scientific-indications-what-
    evidence-do-you-need-support-your-scientific-indication
9
    Hussain Q, Feng H, Grzebieta R, Brijs T, Olivier J, (2019). The relationship between impact speed and the probability
    of pedestrian fatality during a vehicle-pedestrian crash: A systematic review and meta analysis, Accident Analysis
    and Prevention, V. 129, pp. 241–249. http://website60s.com/upload/files/681_26.pdf

                  Submission to Joint Select Committee on Road Safety: Inquiry Into Road Safety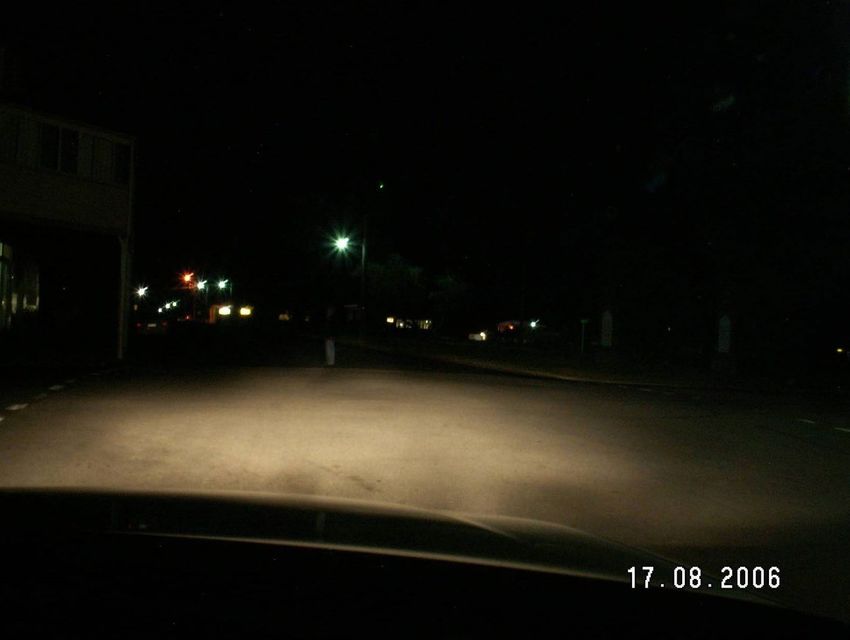
Grzebieta: Page 9 of 25

 Therefore, setting a speed limit of 40 km/h would infer a fatality risk of 13% if the driver did
 not brake at all and struck the pedestrian at this speed. Obviously, drivers could also have
 been travelling at higher speeds and braked up until the moment of impact at 40 km/h. The
 Wramborg (2005)2,7 curve for pedestrian impact infers a probability of fatality value of 45%.
 This is a significant overestimate. The Mizuno curve estimates a cumulative frequency for
 MAIS 4 to 6 which is essentially critically injured (near death) and death, of 32% for
 40 km/h and 15% for 30 km/h. Mizuno’s study was but one data set study whereas our
 systematic review involved 20 data sets.
 Further to this reasoning for adopting 40 km/h for the Australian default urban speed limit to
 help reduce pedestrian and cyclist casualties, is a car into pedestrian crash case study
 which I was involved in as an expert witness. Whilst this case study may be perceived as
 the lowest ranking evidence on the hierarchy of evidence8 but nevertheless underpinned by
 undeniable human factors and Newton’s laws of physics that have been studied for many
 decades, if not the past three centuries. The case study is of a simple crash reconstruction
 analysis which I carried out of a car into pedestrian collision that occurred at night in a small
 town in NSW. I have presented this material in Power Point form at various road safety
 seminars both in Australia and internationally. 10
 Figure 6a shows the details of the incident. A mentally handicapped adult male was
 crossing the road at an intersection in a small town center in NSW. The default speed limit
 for the town centre was 50 km/h. The pedestrian did not look or wait for the approaching
 car to pass and was struck by the vehicle in a glancing blow. The pedestrians head struck
 the windscreen and sustained a serious head injury. Tyre marks were left by the vehicle as
 a result of the driver braking just prior to impact. The driver had consumed one standard
 drink at a hotel prior to driving home and had a blood alcohol content (BAC) of 0.02. The
 Police wanted to charge the driver with exceeding the speed limit and reckless driving. In
 other words, the driver was being blamed for this incident. But was it the driver’s fault?
 Figure 6B shows that it is generally accepted for simple crash reconstruction purposes that
 the perception react time (PRT) of a driver ranges from around 1 second to 2.5 seconds
 and that a value of 1.5 seconds has been commonly accepted for real world situations. 11,12
 In that time the driver would have to first perceive the pedestrian, identify if the pedestrian
 presents a hazard, decide what action to take (brake and/or swerve) and then carry out the
 action (e.g. brake and/or swerve). Figure 6B shows that the stopping distance includes the
 distance vehicle travels during PRT and the distance over which the wheels brake creating
 skid marks. Using the ‘Speed From Skid’ equation derived from Newton’s laws commonly
 used by Police crash analysts, it was found that the driver was travelling at 50 km/h, i.e. at
 Australia’s default speed limit.

10
     https://www.surgeons.org/-/media/Project/RACS/surgeons-org/files/trauma-verification/17-r-grzebieta-safe-speed-
     limits.pdf?rev=be72114dc4ef45689dc3ffa5ede40052&hash=3994BB422E7973A805FBA4C7C061D479
     https://visionzero.rtu.lv/wp-content/uploads/sites/35/2020/12/15_R_Grzebieta_Survivable.pdf
     https://visionzero.rtu.lv/wp-content/uploads/sites/35/2020/11/V0_Program_Riga_2020_online.pdf
     https://www.trafinz.org.nz/s/raphael-grzebieta-1-524df8bd534a3.pdf
11
     Olson P.L., Driver Perception Response Time, SAE Transactions, paper No. 890731, 1989.
     https://www.jstor.org/stable/pdf/44472327.pdf
12
     Wood J. and Zhang S. (2017), Evaluating Relationships Between Perception-Reaction Times, Emergency Deceleration
     Rates, and Crash Outcomes Using Naturalistic Driving Data, South Dakota University, Mountain Plains Consortium
     MPC 17-338. https://www.ugpti.org/resources/reports/downloads/mpc17-338.pdf

                  Submission to Joint Select Committee on Road Safety: Inquiry Into Road Safety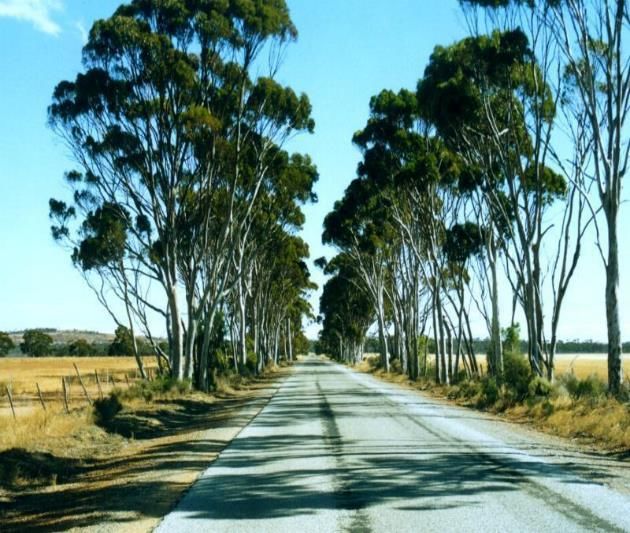
Grzebieta: Page 10 of 25

Figure 6A: Case Study – Reconstruction of Car impact into Pedestrian at night

    Submission to Joint Select Committee on Road Safety: Inquiry Into Road Safety
Grzebieta: Page 11 of 25
Figure 6B: Case Study – Reconstruction of Car impact into Pedestrian at night
Submission to Joint Select Committee on Road Safety: Inquiry Into Road SafetyGrzebieta: Page 12 of 25
This means that the driver wasn’t speeding. However, Police argued that the driver should
have seen the pedestrian and braked in time. To answer this question, the visibility of the
pedestrian from the car and intersection lighting had to be considered.
The sketch in Figure 6A and top photographs in Figure 6C shows the location of street
lighting at the intersection. Such street lighting typifies most urban streets throughout
Australia. The two top photographs in Figure 6C show that the pedestrian, even with light
non-reflective clothing would not be visible at a distance of 36 metres unless the vehicle
had operated ‘high beam’ lighting. It was found that the closest point at which a pedestrian
standing in the middle of the intersection, wearing light coloured trousers, would just be
visible was at a distance of 20 meters as shown in the bottom photograph of Figure 6C.
Using this distance of first perception of the pedestrian at 20 metres, assuming the vehicle
is travelling at 50 km/h (≈14 m/sec), and that it takes a driver on average 1.5 seconds to
perceive and react and try to apply brakes (top frame in Figure 6D), we quickly realise that
the vehicle would travel around 21 metres before the brakes would begin to act. That is,
the driver wouldn’t be able to brake before impacting the pedestrian at 50 km/h (the
Australian default speed limit). The pedestrian being struck by the vehicle at this speed
would be equivalent to jumping out the window of a three story building (see Figure 2) with
the probability of being killed of around 30% (Figure 5) and being seriously injured around
60% (Figure 4).
Let’s now consider if the vehicle was travelling at 40 km/h (11 m/sec) (middle frame in
Figure 6D). Again, if the driver takes on average 1.5 seconds to perceive and react from
the point of first perception of 20 metres and the brakes then engage, the vehicle would
travel 17 metres. The brakes are engaged over a distance of 3 metres and start to
decelerate prior to impact. Using the ‘Speed From Skid’ equation and friction coefficient of
0.6 (bottom frame in Figure 6B) we find that the vehicle has slowed to 33 km/h just before
striking the pedestrian. The pedestrian being struck at 33 km/h would be equivalent in
speed reached jumping of the roof of a house (see Figure 2) with the probability of being
killed of around 6% (Figure 5) and being seriously injured around 25% (Figure 4).
At a travel speed of 30 km/h (8.3 km/h) (bottom frame in Figure 6D), if the driver takes on
average 1.5 seconds to perceive and react and try to apply brakes at the point of first
perception of 20 metres, the vehicle would travel 12.5 metres and would only need 6
meters over which to decelerate to a full stop, i.e. total stopping distance of 18.5 metres. In
other words, no collision with the pedestrian would occur.
In conclusion (Figure 6E), do we blame the driver? No. The driver did exceptionally well,
being able to perceive and react to the pedestrian despite having a BAC of 0.02, requiring
only 1 second to activate the brake well before impacting the pedestrian. The impact
speed most likely was around 40 km/h, which possibly saved the pedestrian’s life.
Do we blame the pedestrian? No. The pedestrian was a mentally handicapped adult and
was not capable of perceiving the risk the car posed when crossing the road.
Who or what do we blame? Obviously, the street lighting was inadequate. However, it is
likely that upgrading such lighting throughout Australia would be financially prohibitive. It
becomes obvious that Australia’s default speed limit of 50 km/h is too high and we should
lower it to 40 km/h to take into account the deficient lighting infrastructure (Figure 6E).
Recommendation 2: That the Australian national urban (residential) default speed limit of
50 km/h set out in the Australia Road Rules - Part 3, Regulation 25 Speed-
Limit Elsewhere, be lowered to a Safe System survivable limit of 40 km/h.
Submission to Joint Select Committee on Road Safety: Inquiry Into Road SafetyGrzebieta: Page 13 of 25
Visibility and lighting
At 36 meters away from the crossing pedestrian
Using low beam car lights Using high beam car lights
Pedestrian not visible Pedestrian visible
At 20 meters away from the crossing pedestrian
Using low beam car lights: Pedestrian’s light blue trousers just visible
Figure 6C: Case Study – Reconstruction of Car impact into Pedestrian at night
Submission to Joint Select Committee on Road Safety: Inquiry Into Road SafetyGrzebieta: Page 14 of 25
Figure 6D: Case Study – Reconstruction of Car impact into Pedestrian at night
Submission to Joint Select Committee on Road Safety: Inquiry Into Road SafetyGrzebieta: Page 15 of 25
Figure 6E: Case Study – Reconstruction of Car impact into Pedestrian at night
Submission to Joint Select Committee on Road Safety: Inquiry Into Road SafetyGrzebieta: Page 16 of 25
Heavy Vehicle Safety.
The latest statistics regarding truck related fatalities are available from BITRE: 13
“ A total of 188 people were killed in crashes involving heavy trucks. This is an increase of 19.7
per cent compared with the total in 2018. Over ten years, the trend was an average reduction
of 2.7 per cent per year. Light vehicle occupants account for approximately 47 per cent of the
total fatalities involving heavy trucks. Heavy truck occupants account for about 29 per cent.
The latest hospitalisation data (2018) shows that approximately 510 heavy truck occupants are
hospitalised from road crashes each year. High threat to life injuries comprises around 34 per
cent of the total.”
There are three issues that are considered in this submission related to truck safety:
driving hours and driver fatigue, truck rollover and truck Autonomous Emergency Braking
(AEB). The recommendations I am proposing would assist with reducing heavy vehicle
crashes and this societal (and economic) burden on Australia.
Permitted hours of service for long distance truck drivers are too high. Professor
(Emeritus) Ann Williamson 14 from TARS UNSW, who is Australia’s leading human factors
expert on truck safety and with whom I have worked on major road safety related projects,
states in an Editorial Opinion article in the Sydney Morning Herald in January 2018: 15
“ So we now know the number of heavy truck crashes increased by 86 per cent in NSW over
the past year; the largest increase since we started counting fatal crashes involving heavy
trucks in 2009. This increase would be no surprise to anyone who pays attention to how our
freight is moved around Australia….
…
Our long haul truck drivers are allowed to do longer hours of work (including driving) than any
other work group in Australia, and far longer than truck drivers in virtually any other country in
the world. Currently, long haul truck drivers are allowed to drive for 72 hours in a week. They
can do 84 hours in a week if they have done some "fatigue training". Drivers are required to
have a break of only seven continuous hours in any 24: certainly not a long enough break for a
driver to have meals, shower and obtain sufficient sleep. And this break can be in the middle
of the day, when it is harder to sleep. The regulations also only require drivers to take a long
break of 24 hours once in every seven days, and again, this could be a break from 3am to
3am so drivers do not get a good night of sleep. A driver can do this pattern of work and rest
for months or years, never actually obtaining sufficient rest or sleep.
So the objective of the long distance road transport industry: freight forwarder, transport
operator and driver, is to keep freight moving. Attention to the state of the truck and of the
driver is secondary. No-one gets paid unless the wheels are moving so anything that keeps
trucks off the road, including maintenance, or that keeps drivers away from the wheel,
including fatigue, will be overlooked. Add to this the most demanding hours of work for drivers
in the world and we have insufficient checks and balances to ensure our long distance road
transport system is safe. This is a formula for death on our roads.
The introduction of the National Heavy Vehicle Regulator about five years ago has done little
to improve safety in the heavy trucking sector. They simply administer inadequate law. It is up
to road authorities and government to ensure that the context in which the road transport
system operates and especially the regulations that govern it are consistent with safe practice.
This is clearly not the case in this industry. It is time for an independent review of the long
13
BITRE, Road Trauma Involving Heavy Vehicles—Annual Summaries.
https://www.bitre.gov.au/publications/ongoing/road-trauma-involving-heavy-vehicles
14
http://www.tars.unsw.edu.au/staffdirectory/professor_ann_williamson.html
15
Ann Williamson, (2018). Truck drivers on the road too long to stay safe, Opinion, The Sydney Morning Herald,
https://www.smh.com.au/opinion/truck-drivers-on-the-road-too-long-to-stay-safe-20180102-h0c9q6.html
Submission to Joint Select Committee on Road Safety: Inquiry Into Road SafetyGrzebieta: Page 17 of 25
distance road transport industry in order to establish a better path towards a safer industry that
will ensure that all truck drivers get home to see their families.”
Given that Australia continues to aspire to the same standards of road safety best practise
European Countries (See page 3, BITRE International Road Safety Comparisons16) such
as Sweden, UK and the Netherlands, one would think that the Australian Government
would adopt best practise set out in their regulations for truck safety. The European
Commission Regulation (EC) No 561/2006 17 specifies maximum daily driving hours and
minimum rest breaks which all European member States must comply with. Table 1 below
shows the Australian equivalent
Table 1: Truck driver working hours comparison between Europe and Australia 18
Time ECE Australia*
9 hours work time 12 hours work time
24 hours (can extend to 10 hours for (15.5 hours/ 15 hours AFM)
two days in the week)
(14 hours BFM for up to 6 days
straight)
7 days 56 hours 72 hours
(Not specified AFM)
(84 hours work permitted in
any seven day period over a
two week period BFM)
14 days 90 hours 144 hours
(154 hours AFM)
(140 hours BFM)
*AFM – Advanced Fatigue Management; BFM – Basic Fatigue Management
The Basic Fatigue Management has been heavily criticised by Prof Williamson: 19
“ Williamson says the community is shocked when told how long truck drivers are allowed to
work for and that she is worried they are being pushed too hard at the expense of their health
and quality of life. …
…
"I can’t see any reason why truck drivers can’t be working similar hours to what you or I
work…Certainly eight to 10 hours of work is probably adequate."
…
Williamson is particularly critical of BFM for allowing 14-hour workdays for up to six days
straight and a total of 144 hours of work in 14 days.
16
https://www.bitre.gov.au/publications/ongoing/international_road_safety_comparisons
17
https://ec.europa.eu/transport/modes/road/social_provisions/driving_time_en
18
NHVR, Standard Hours, https://www.nhvr.gov.au/safety-accreditation-compliance/fatigue-management/work-and-
rest-requirements/standard-hours
19
Gardener, B. (2016). Limit Truck Drivers To 10 Hours Of Work A Day: Fatigue Expert,
https://www.ownerdriver.com.au/industry-news/1512/limit-truck-drivers-to-10-hours-of-work-a-day-fatigue-expert
Submission to Joint Select Committee on Road Safety: Inquiry Into Road SafetyGrzebieta: Page 18 of 25
Under this system, a truckie can drive six hours before needing to take a 15 minute break, and
work a maximum of 84 hours in one week.
"It’s very scary to me how many companies and drivers are now doing BFM since 2008. Since
it has been allowed, it has really taken the industry by storm. Many, many companies are
doing it and it is a serious problem," Williamson says.
"Driving for six hours without a break is just ridiculous. Who does it? And why is it that mere
mortals like us are told to take a break every two hours and these guys aren’t? It just doesn’t
add up. When you start talking about this, it is indefensible that we still do it." ”
And yet here we are wondering why truck drivers are using amphetamines or various
fatigue monitoring gadgets (eye tracking, etc.) to help them stay awake and cope with the
fatigue. 20
It is sad that we demand from truck drivers that which we would not subject ourselves to in
terms of long work and driving hours. The underpinning issue is financial of course and
remuneration for drivers. Reduction in transport costs is being traded for lives and serious
lifetime debilitating injuries and is nothing short of reckless. This is a clear violation of the
ethical and moral principles set out by Tingvall and Haworth (1999)5:
“ It can never be ethically acceptable that people are killed or seriously injured when moving
with the road transport system”
If the Australian governments (all parties state and federal) claim on their webpages that they
building a Safe System with Vision Zero aspirations, then this must change.
Recommendation 3: That the Australian Federal Government adopt the same driving time and
rest periods as set out in the European Union Regulation (EC) No
561/2006.
Heavy vehicle rollover results in approximately one articulated heavy vehicle per week
rolling over somewhere in Australia. Some are petroleum tankers21 which have also resulted
in devastating explosions and fire hazards in some cases. 22,23 Gaffney et al. (2020) from
ARRB have highlighted the serious problem such crashes are posing in Victoria. 24,25 Major
studies worldwide have shown that majority of crashes result from inappropriate speed
when the vehicle is changing direction on corners and curves. If the vehicle’s speed
exceeds the critical rollover threshold of the truck for a particular speed, e.g. going too fast
around a small radius curve such as a roundabout, the vehicle will roll over.
20
See ‘A reliance on stimulants’ in this opinion piece by Dr. Walker from UNSW, High Fatalities From Truck Crashes
Demand Greater Safety Standards (2020) https://newsroom.unsw.edu.au/news/social-affairs/high-fatalities-truck-
crashes-demand-greater-safety-standards
21
ABC News, Calder Freeway crash: One dead after petrol tanker rolls, fuel spilt https://www.abc.net.au/news/2016-
05-24/petrol-tanker-rolls-on-melbourne-freeway-trapping-car/7439994
22
ABC News, Toxic spill clean-up continues after fatal tanker crash at Mona Vale in Sydney's north
https://www.abc.net.au/news/2013-10-01/two-dead-in-fuel-tanker-crash-in-sydney27s-north/4991974
23
ABC News, Man jumps from exploding petrol tanker, https://www.abc.net.au/news/2012-12-24/man-jumps-from-
exploding-petrol-tanker/4442876
24
Gaffney, T., Germanchev, A. and Naznin, F. (2020) ARRB puts the spotlight on truck rollovers
https://www.arrb.com.au/latest-research/arrb-puts-the-spotlight-on-truck-rollovers
25
Gaffney, T., Germanchev, A. and Naznin, F. (2020) Truck Rollover
https://f.hubspotusercontent20.net/hubfs/3003125/DoT%20Flyers/Heavy%20truck%20article%20to%20promote%2
0DoT%20Rollover%20workshop%20FA.pdf
Submission to Joint Select Committee on Road Safety: Inquiry Into Road SafetyGrzebieta: Page 19 of 25
The causes of rollover are succinctly explained in a VicRoads Information Bulletin 26,27 as
follows:
“ Speed
The effect of speed on cornering stability, braking distance and impact forces are all made
worse by increased speed. Cornering forces don’t just double when the vehicle speed
doubles, they increase by four times.
Centre of gravity
Everything is affected by gravity and therefore has a centre of gravity: the point around which
the object is balanced in all directions. Trailers with a high centre of gravity can rollover on an
incline of as little as fifteen degrees, while the prime mover which, has a lower centre of
gravity, will only rollover if the incline is more than sixty degrees.
The higher the centre of gravity, the more unstable the truck; the lower the centre of gravity,
the more stable the truck.
A vehicle also requires the load to be centred. If the weight of the load is not centred across its
width, stability will be reduced when cornering. If a load is not properly distributed along the
length of the trailer, that is, if there is more weight on some wheels than others, then each
wheel will not brake with the same force. This can cause wheel lockup.
Braking
The faster a vehicle travels, the longer it takes to stop. For example, if a truck’s speed is
doubled, it will take four times longer to stop.
Centrifugal force (overturning or side force)
Centrifugal force is the force that makes objects slide across the seat when a vehicle corners
at high speed. It happens when a moving object, such as a vehicle, changes direction.
Changing direction causes a force pushing the vehicle away from the centre of the turn which
can lead to a rollover. The tighter the turn, the greater the force will be to push the truck over.
The same applies for the speed of travel to negotiate the turn.
Together, both speed and tightness of the turn will increase the risk of rollover. If a truck
travels around a corner at 30km/h certain forces will apply. If the truck travels the same corner
at 60km/h these forces increase by four times.
Centrifugal force also applies in a straight line. At highway speed, a small correction applied to
the steering, or a rapid change in direction, such as a swerve, can easily cause a rollover
crash.
Every time speed is doubled, the rollover force increases by four times, and every small
change in direction can double the rollover force again. This means that at 100km/h in a
straight line, a small correction can increase the rollover force by four times, compared to the
same manoeuvre at 50km/h.
Static roll threshold
The static roll threshold (SRT) of a vehicle is a guide to the risk of a vehicle rolling over. A
vehicle with a low SRT value is more likely to roll over than one with a higher SRT value. The
SRT values are calculated from the position of the centre of gravity.
This is a static test and dynamic forces still will affect the vehicle as it travels. There are a
number of dynamic systems such as electronic stability control and rollover prevention system
that will reduce the risk of a rollover crash. ”
26
National Road Safety Partnership Program (NRSPP), Heavy Vehicle Rollover Prevention Program – Understanding
Causes Of Rollover Crashes, https://www.nrspp.org.au/resources/heavy-vehicle-rollover-prevention-program-
understanding-causes-of-rollover-crashes/
27
VicRoads, Understanding Rollover Crashes (2010). https://cdn-s3-nrspp-2020.s3.ap-southeast-
1.amazonaws.com/wp-content/uploads/sites/4/2017/03/16083839/RolloverA4flyeraccessible.pdf
Submission to Joint Select Committee on Road Safety: Inquiry Into Road SafetyGrzebieta: Page 20 of 25
Yet all it takes to eliminate these crashes is the introduction of an Australian Design Rule
that require retro-fitting Electronic Braking System (EBS) with Roll Stability Control (RSC)
to existing trailers and continue to require any new trailers purchased to have this
technology fitted. EBS is simply a system where an actuator on the trailer detects a signal
from the prime mover and applies the brakes accordingly. This reduces brake application
time considerably over conventional air-line operated systems. EBS that have RSC have
the ability to detect when lateral acceleration is approaching the limit of stability for the
trailer and apply the brakes independent of the towing vehicle, to slow the unit below the
rollover threshold speed. How the system works is explained in a NSW Government
information brochure. 28 The driver can feel the rig pulling up. At first this is unnerving for
novices, but they soon get used to the system and know what speed to take a corner so
that the system does not activate.
Logging truck rollovers in Victoria were occurring on a regular basis before 2013, resulting
in casualties and costing millions of dollars for a major logging company that I and my
colleagues were asked to privately audit for road safety gains. We noted from the data
collected that the introduction of electronic braking systems (EBS) with stability control
(RSC) in 2017 has virtually eliminated truck and trailer rollovers for that company in
Victoria 29.
The NSW Environment Protection Authority (EPA) took action in 2014 30, to impose
mandatory stability control on all Dangerous Goods (DG) tanker trailers operating in that
state. In this case, the mandate is applicable to a tanker trailer with a GVM greater than
4.5 tonne and the tank forms an integral part of the trailer. All new tanker trailers from 1
July 2014 need to be fitted with RSC, no matter where they are registered, if travelling
within NSW. All tanker trailers from 1 January 2019 operating in NSW will need to be fitted
with RSC, no matter where they registered, if travelling within NSW.
Recommendation 4: That the Australian Federal Government introduce and Australian Design
Rule (ADR) mandating that all heavy vehicle trailers be required to be
fitted with electronic braking systems (EBS) with stability control (RSC).
Autonomous Emergency Braking System for both heavy and light vehicles has still to
be mandated in Australia. Mandatory fitment of AEB to commercial heavy vehicles
according to UN Regulation No. 131 has been implemented across the European market
since November 2013, followed by mandates in Japan and Korea. The Regulatory Impact
Statement ‘Reducing Heavy Vehicle Rear Impact Crashes: Autonomous Emergency
Braking’ 31 has recommended that AEB implementation timeframe for heavy vehicles is 1
November 2020 for new vehicle models (trucks presumably) and 1 November 2022 for all
new vehicles (presumably includes all light and heavy vehicle).
28
NSW Government, Safety features and technologies for heavy vehicles,
https://roadsafety.transport.nsw.gov.au/downloads/safety-technologies-heavy-vehicles-2020.pdf
29
See also Australian Trucking Association, Section 9, VicForests and mandating trailer stability control,
https://www.truck.net.au/system/files/industry-resources/TAPs%20-
%20RSC%20and%20ESC%20for%20Trucks%20and%20Trailers%20Final%20May%202016.pdf
30
https://www.epa.nsw.gov.au/your-environment/dangerous-goods/determinations
31
Australian Government, Department of Infrastructure, Transport, Cities and Regional Development, Regulation
Impact Statement, Reducing Heavy Vehicle Rear Impact Crashes: Autonomous Emergency Braking
https://www.infrastructure.gov.au/vehicles/design/files/Consultation_Regulation_Impact_Statement.pdf
Submission to Joint Select Committee on Road Safety: Inquiry Into Road SafetyGrzebieta: Page 21 of 25
How this technology works can be viewed in a number of on-line videos on Youtube. 32
The Australian Government response to the Rural and Regional Affairs and Transport
References Committee Final and Interim Reports on: Aspects of road safety in Australia 33
to Recommendation 8 was:
“ The Australian Government supports this recommendation in principle. …
…
ABB for both light and heavy vehicles is a priority in the Action Plan for 2018-2020, and a
Regulation Impact Statement (RIS) for heavy vehicle AEB was released for consultation in
August 2019. The Department is preparing a RIS for AEB for light vehicles, in parallel with the
finalisation of an international standard through the United Nations World Forum for the
Harmonization of Vehicle Regulations. The Department expects to release the RIS in early 2020.”
The National Road Safety Strategy34 also states that
“ Achieve a majority of consumers purchasing vehicles fitted with AEB, through mandating AEB
in heavy and light vehicles as well as increasing voluntary uptake.”
as an outcome for 2020.
A media release from the Australian Government indicated that “Consultation kick-starts on
crash-reducing brake technology for light vehicles” 35 Yet when the government web site is
searched there is no information concerning the RIS for light vehicles.
Here we are, almost at the end of 2020 and still no tangible progress towards an ADR
being adopted. The International Road Assessment Program (iRAP) CEO Mr Rob
McInerny talks about vaccines for Roads drawing on the analogy to Australia’s response to
COVID-19 and imagining a response to road safety like to COVID-19. 36 AEB should be
considered as a vaccine 37 against road deaths and serious injury crashes. It is a ‘golden
bullet’ countermeasure. This is a race against time to help prevent allowing more years
drift by with the associated consequential deaths and serious injuries before an AEB ADR
is adopted.
Had the truck which collided with the four Police Officers on Melbourne’s Eastern
Freeway 38 had AEB fitted, those Police Officers would be alive today.
Had the truck that crashed into the rear of Blake Corney’s parents car on the Monaro
Highway in the ACT had AEB fitted, he would be alive today. 39
32
https://www.youtube.com/watch?v=W2oKhOglx0E, https://www.youtube.com/watch?v=S1EbyBo9dMY,
https://www.youtube.com/watch?v=RajRpZ0AlZc, https://www.youtube.com/watch?v=JPIg42pQ1f0
33
https://www.aph.gov.au/DocumentStore.ashx?id=433120a6-95b4-40bc-8f0e-0238a0d280c9
https://www.aph.gov.au/Parliamentary_Business/Committees/Senate/Rural_and_Regional_Affairs_and_Transport/
Road_safety/Interim%20Report/c02
34
https://www.roadsafety.gov.au/action-plan/2018-2020/priority_action_4
35
https://parlinfo.aph.gov.au/parlInfo/search/display/display.w3p;query=Id%3A%22media%2Fpressrel%2F7609585%22;src1=sm1
36
McInerny, R., Protecting Lives and Protecting Livelihoods: Imagine a response to road safety like COVID-19 https://us7.campaign-
archive.com/?e=&u=a4664bfed5e72009f29785051&id=92f72a6398#ROB
37
https://irap.org/2020/07/protecting-lives-and-livelihoods-imagine-a-response-to-road-safety-like-covid-19/
38
https://www.abc.net.au/news/2021-04-14/truck-driver-jailed-over-melbourne-eastern-freeway-crash/100066336
39
https://www.abc.net.au/news/2020-05-08/canberra-truck-driver-with-sleep-apnoea-sentenced-to-jail/12228490
Submission to Joint Select Committee on Road Safety: Inquiry Into Road SafetyGrzebieta: Page 22 of 25
Had the truck that crashed into six vehicles in Dubbo on the Newell Highway 40, killing two
people and injuring a number of other vehicle occupants, had AEB fitted, the two young
people who died, Hannah Ferguson and Reagen Skinner, would be alive today. I assisted
the Police in reconstructing this tragic crash.
Recommendation 5: That the Australian Federal Government remove the current bureaucratic
obstructions and prioritise as a matter of urgency, the introduction of the
Australian Design Rule (ADR) mandating that all heavy and light vehicles
be fitted with Automated Electronic Braking (AEB).
Vehicle Rollover Crashworthiness
Fatalities and injuries to seat belted occupants resulting from rollover crashes is of
considerable concern to road safety advocates around the world. An analysis of 2000–
2007 single vehicle rollover fatalities in three Australian states was carried out by the
UNSW team about a decade ago using data from the Australian National Coroners
Information System. 41 Rollovers accounted for 35% of all occupant fatalities in a single
vehicle transport injury event. Of those crashes 16% occur in urban environments whereas
84% are rural crashes. Moreover, vehicle roll-overs are among the most common cause of
spinal cord paralysis injury in Australia. 42 Yet there still is no government mandated
Australian Design Rule regarding roof crush strength that protects occupants in such
crashes. One could manufacture the roof from straw and it would pass the ADRs.
Government and consumer groups have focussed their attention on prevention of rollover
via assessment and ranking of a vehicle’s stability characteristics and electronic stability
control. However, it is time that focus change to mandating a roof crush standard.
40
https://www.abc.net.au/news/2018-01-17/dubbo-car-crash-victim-identified/9336482
41
Fréchède B., McIntosh A., Grzebieta R.H., Bambach M., Characteristics of single vehicle rollover fatalities in three
Australian states (2000–2007), Accident Analysis & Prevention, Vol. 43, Iss. 3, pp 804-812, 2011.
42
Cripps RA 2008. Spinal cord injury, Australia, 2006–07. Injury research and statistics series number 48. Cat. no.
INJCAT 119. Adelaide: AIHW. https://www.aihw.gov.au/getmedia/142163f4-e569-4eed-8ce6-9c3d45a875c3/scia06-
07.pdf.aspx?inline=true
Submission to Joint Select Committee on Road Safety: Inquiry Into Road SafetyGrzebieta: Page 23 of 25
The following has been extracted from an article my colleagues Ms Tia Gaffney and
Associate Professor George Rechnitzer and I wrote. 43
The occupant compartment or survival space during a rollover crash is vital. A robust
structural performance ensures that seatbelts and airbag systems can function as
designed. Further, reducing roof intrusion also allows side glazing (glass) and side air
curtains to remain intact, which prevents the opportunity for ejection.
After over a decade of debate and with unrelenting drive from the independent experts, the
USA enacted an upgraded version of Federal Motor Vehicle Safety Standard (FMVSS Number
216) – Roof crush resistance released in 2009 (with full applicability starting in 2012).
The upgraded standard nearly doubled the pass/fail criteria for structural roof strength-to-
weight ratio (SWR). Almost concurrently, in 2009 the IIHS implemented a roof strength
test, with stringent requirements for achieving a ‘GOOD’ rating. In parallel, the US Federal
Government introduced the FMVSS 226 Ejection Mitigation design rule in 2013 to reduce
the partial and complete ejection of vehicle occupants through side windows in crashes,
particularly rollover crashes. 44
With these increased USA roof strength and ejection mitigation requirements,
manufacturers also produced improved curtain airbag technology, seatbelts with
pretensioning devices, side window glazing integrity, effective roof and pillar head impact
padding and advanced electronic stability control. Maintenance of the space surrounding
the occupant enables the suite of passive technologies to function synergistically.
Volvo proved to be a leader in the rollover safety space, initiating stringent internal
requirements for roof strength and occupant protection with the introduction of its Volvo
XC90 SUV in the early 2000s. The introduction of the XC90 demonstrated what was
possible – a vehicle could be engineered to be safe in a rollover crash with a strong roof
and good occupant protection features. (You can watch Volvo’s rollover in the video
https://www.youtube.com/watch?v=F_Ti_7yC9fA) The proof is in the pudding. Volvo’s
XC90 has never been involved in a fatal or serious injury crash since it was introduced in
2003, according to Thatcham Research, the body who executes Euro NCAP testing. 45
There was at some point a proposal by ANCAP to introduce roof crush testing (Roof crush
testing to measure the roof strength in rollover crashes will commence as part of ANCAP testing from 2014.) 46,47
Disappointingly that has now been shelved. The belief by ANCAP was that focus on
rollover prevention via the introduction of Electronic Stability Control (ESC) ADR would be
sufficient. And yet we continue see spinal injuries and deaths from rollover crashes despite
the introduction of ESC. When a person in a wheel chair gives a talk about driving safely at
school and other seminars, their spinal injury is often the result of a rollover crash.
Recommendation 6: That the Australian Federal Government introduce an Australian Design
Rule (ADR) mandating that all light comply with the US FMVSS 216 roof
crush standard and the US FMVSS 226 Ejection Mitigation standard.
43
Gaffney T., Grzebieta R. and Rechnitzer, G. Vehicle Safety Improvement Lessons For Australia, ARRB
https://f.hubspotusercontent20.net/hubfs/3003125/Tiger%20Woods%20Rollover%20FINAL%20FINAL.pdf
44
https://www.nhtsa.gov/fmvss/ejection-mitigation
45
https://www.thatcham.org/what-we-do/testing/
46
ANCAP, Continuous development in crash testing, https://www.ancap.com.au/media-and-gallery/releases/continuous-
development-in-crash-testing-3627d6
47
https://www.engineersaustralia.org.au/sites/default/files/resource-files/2017-01/ancap-paine-25jul2013.pdf
Submission to Joint Select Committee on Road Safety: Inquiry Into Road SafetyGrzebieta: Page 24 of 25
Event Data Recorder (EDR)
The following has again been extracted from an article my colleagues Ms Tia Gaffney and
Associate Professor George Rechnitzer and I wrote.43
Criminal prosecutions and Coronial investigations rely on collision expert findings. Collision
investigation includes analysis of Event Data Recorders (EDR). EDR’s have the capability
of recording pre-crash data including speed, braking and acceleration. Currently, no
Australian legislation exists mandating that vehicles be fitted with an EDR or that stored
data be accessible by Police. 48 Such legislation would enhance collision causation
analysis, increasing road safety and reducing road trauma.
Hardiman states:48 “The FCAI support harmonisation of the ADR’s to the United Nations (UN) and the subject
of EDR regulation has been raised but given low priority due to development of autonomous vehicle technology.”
Presently, if Police want to analyse data from the EDR, they must seek permission from
the manufacturer of the vehicle if it has an EDR fitted. However, often access is refused,
which is unacceptable for analysing culpable driving cases.
The National Highway Traffic Safety Administration (NHTSA), enacted in 2011, 49 that all
vehicles sold in the USA that have EDR fitted and are capable of recording data, must
have such data available for download to assist collision investigation. The European
Union (EU) is set to introduce similar rules in the EU from 2021. 50
Recommendation 7: That the Australian Federal Government introduce an Australian Design
Rule (ADR) mandating that all light and heavy vehicles be harmonised
and comply with 49 Part 563 of the USA Code of Federal Regulations
requiring mandatory fitment of EDRs and access by Police.
48
Hardiman M., Hardiman J.. Flight C., Proposed Amendments to the Australian Design Rules Pertaining to Mandation
of Event Data Recorders in Australian Sold Vehicles, Proc. 2019 Australasian Road Safety Conference, Sept 2019,
Adelaide, Australia, https://acrs.org.au/files/papers/arsc/2019/JACRS-D-19-00232-Hardiman.pdf
49
49 Part 563 of the USA Code of Federal Regulations https://www.govinfo.gov/content/pkg/CFR-2011-title49-
vol6/pdf/CFR-2011-title49-vol6-part563.pdf
50
https://www.europarl.europa.eu/RegData/etudes/STUD/2014/529071/IPOL_STU%282014%29529071_EN.pdf
Submission to Joint Select Committee on Road Safety: Inquiry Into Road SafetyYou can also read