Insights - Analysis & Policy Observatory ...
←
→
Page content transcription
If your browser does not render page correctly, please read the page content below

ABARES

Department of Agriculture,
Water and the Environment
        ABARES               Insights      ISSUE 2, 2021

   SNAPSHOT OF

   Australian Agriculture 2021
   This Insights report describes the current
   state of Australian agriculture, with the aim of
   providing key information and statistics in one
   place. It covers eight key aspects of Australian
   agriculture: its role in the broader economy,
   trends in production, industry structure and
   productivity, risk management, agricultural
   employment, government support, trade and
   impacts of the COVID-19 pandemic.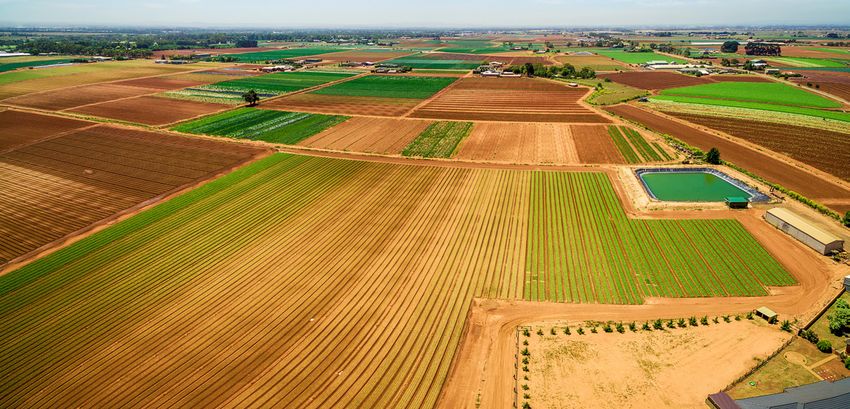
Agriculture's place in FIGURE 1 Selected contributions of agriculture
Australia Land use
Australian agriculture accounts for: Water extractions
55% of Australian land use (427 million hectares, Exports
excluding timber production in December 2020) and
25% of water extractions (3,113 gigalitres used by Rural employment
agriculture in 2018–19);
National employment
11% of goods and services exports in 2019–20;
Gross domestic product
1.9% of value added (GDP) and 2.6% of employment
in 2019–20 (Figure 1). % 10 20 30 40 50 60
Sources: ABS Water Account (cat. 4610); Catchment scale land use of Australia – update
The mix of Australian agricultural activity is December 2020, ABARES; ABS Balance of Payments (cat. 5302); ABS Labour Survey
determined by climate, water availability, soil type and (cat. 6291); ABS National Accounts (cat. 5206)
proximity to markets. Livestock grazing is widespread,
occurring in most areas of Australia, while cropping
and horticulture are generally concentrated in areas
relatively close to the coast (Figure 2).
FIGURE 2 Agricultural production zones
Area of agricultural uses
Grazing native 291.74
vegetation
Grazing modified 39.81
pastures
Cropping including
crop/pasture 21.78
rotation
0 250 500km
Horticulture 0.44
0 50 100 150 200 250 300
million hectares
Agricultural land
Grazing native vegetation Cropping including crop/pasture rotation Other uses
Grazing modified pastures Horticulture * Wheat–sheep
* Exaggerated to improve visibility.
Sources: Wheat-sheep zone – Agricultural and Grazing industries Survey, 2016, ABARES; Catchment scale land use of Australia - update December 2020, ABARES; ABS Agricultural
Commodities, Australia–2018–19 (cat 7121)
2 Snapshot of Australian Agriculture 2021
ABARES insights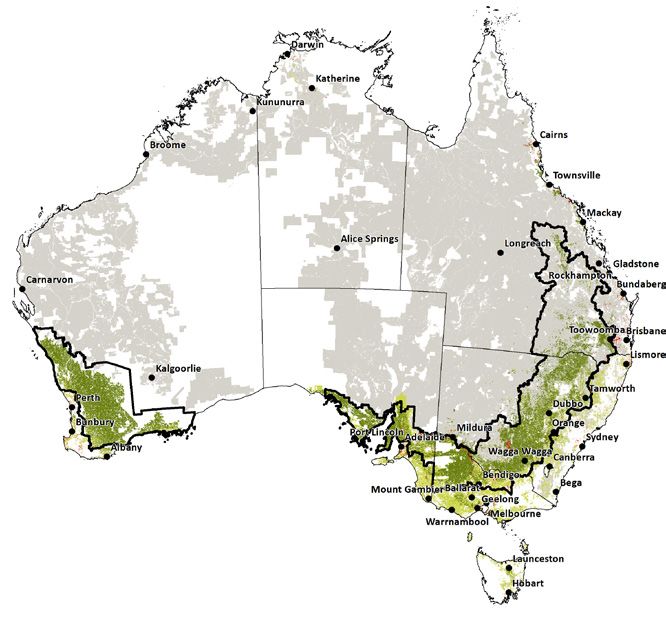
Agricultural production FIGURE 3 Agriculture, fisheries and forestry
value of production, by commodity, 2019–20s
is growing
8%
Australia has a diverse agricultural, fisheries and 23%
forestry sector, producing a range of crop and livestock
products (Figure 3). The gross value of agricultural,
fisheries and forestry production has increased
by 7% in the past 20 years in real terms (adjusted
for consumer price inflation), from approximately
$62 billion in 2000–01 to $67 billion in 2019–20 2019–20s
(Figure 4).
Drivers of output growth over the past 20 years
vary by sector:
In cropping, long-term falls in real prices have been 51% 18%
offset by volume growth, as producers have improved
productivity by adopting new technologies and
Wheat 8% Cattle & calves 20%
management practices. Coarse grains 4% Sheep & lambs 8%
Pulses 2% Milk 7%
In livestock, higher prices have been the main driver Canola 2% Wool 5%
of growth (Figure 5), reflecting growing demand Sugar cane 2% Poultry 4%
for protein in emerging countries and also some Wine grapes 1% Pigs 2%
temporary factors, such as drought in the United Cotton 0% Other livestock products 2%
Other grains & oilseeds 0% Other livestock 3%
States and disease outbreaks such as African Swine
Other crops 3%
Fever in meat importing countries. Fruit & nuts 8% Fisheries 4%
Vegetables 7% Forestry 4%
Other horticulture 4%
s ABARES estimate for 2019–20.
Note: Values are measured at the farm gate (i.e. prior to processing).
Sources: ABS International Trade in Goods and Services (cat. 5368); ABS Value of
Agricultural Commodities Produced, Australia (cat 7503)
FIGURE 4 Agricultural, fisheries and forestry production, 2000–2001 to 2019–20s
80 20 years to 2019–20
70 Production Exports
Meat & live animals
60 36% 14% Livestock products
50
Grains & oilseeds
40 28% 17% All other crops
30 Fruit & vegetables
20
24% 64% All other horticulture
10 Forests products
11% 25% Fisheries
2020–21
$b
2001 2003 2005 2007 2009 2011 2013 2015 2017 2019
–02 –04 –06 –08 –10 –12 –14 –16 –18 –20s
s ABARES estimate for 2019–20.
Note: Values are measured at the farm gate (i.e. prior to processing). Percentage changes compare levels in 2000–01 and 2019–20.
Sources: ABS International Trade in Goods and Services (cat. 5368); ABS Value of Agricultural Commodities Produced, Australia (cat. 7503)
FIGURE 5 Volume driving increased cropping value and price driving increased livestock value,
2000–01 to 2019–20s
40
Volume
30 Price
Value
20
10
%
–10
–20
Crops (including horticulture) Livestock & livestock products Total
s ABARES estimate for 2019–20.
Note: Estimates relate to the agricultural sector only (they do not include fisheries and forestry). Crops include horticulture. Values represent the growth in each variable over the past
20 years (not the proportion of growth that can be attributed to each factor). Values are smoothed using a 5-year moving average. Prices and values are in real terms (adjusted to remove
the effects of inflation).
Source: ABARESThe farm population is Economic performance
diverse and constantly is driven by the most
changing productive farms
In 2018–19, there were 89,400 agricultural businesses Australian farmers have historically achieved strong
with an Estimated Value of Agricultural Operations productivity growth, increasing the volume of output
(EVAO) of $40,000 or greater in Australia (ABS 2020a). produced from a given set of inputs. Agricultural
There were an estimated 57,300 broadacre and dairy productivity growth has been stronger over the long
farm businesses in 2018–19. Of these, 36% were term than what has been seen in most other sectors of
classified as beef industry farms, 19% sheep industry the Australian economy. It has also been comparable to
farms, 14% wheat and other crops industry farms, farmers in other high income countries. This growth
14% mixed livestock-crops industry farms, 10% dairy has been driven by improvements in technology and
industry farms, and 8% sheep-beef industry farms. structural change.
For broadacre farms, the biggest changes to the farm
Industry-level trends in performance are driven by
population since 1978–79 have been a decline in the
the largest and most productive farms. For example,
total number of farms, a decline in the share of mixed
indicative analysis suggests that if all broadacre
livestock-crops farm businesses and an increase in the
farms had the same output per hectare as the highest
share of beef industry farm businesses (Figure 6).
performing 20% of farms, the total value of broadacre
agricultural output would be around 24% above
FIGURE 6 Number and share of broadacre current levels, and farm cash income would be around
and dairy farm businesses, by industry, 1978–79 46% above current levels1. Smaller farms are less
to 2018–19 profitable on average than their larger counterparts
140 Number of farms but they compare favourably with the average
Australian household, with comparable income, lower
120
debt and greater net wealth.
100
A range of factors has supported the growth of large
80
farms (those with receipts above $1 million per year
60 in real terms) from around 3% to 14% of the farm
40 population over the past 4 decades. Their share of total
20
output value has increased markedly, from 25% to
around 59% (Figure 7).
’000
1978
–79
1982
–83
1986
–87
1990
–91
1994
–95
1998 2002 2006 2010
–99 –03 –07 –11
2014
–15
2018
–19
The structure of Australian farms reflects market
conditions, which tend to see the best managers
40 Share of farms operating the largest farms. As the number of farms
35 has decreased, farm sizes have increased in terms of
30
both total receipts and land area. Increased farm size
has also supported improved productivity through
25
several channels: access to better technology; better
20
and more flexible labour management (which supports
15 higher labour productivity); better knowledge
10 management; diffusion of better farm management
5 practices; and access to positive economies of
% scale. All these changes have been enabled by the
1978–79 1988–89 1998–99 2008–09 2018–19
deregulation of most agricultural markets and
Beef Sheep-beef Dairy Sheep
economy-wide microeconomic reforms.
Wheat & other crops Mixed livestock-crops
Source: ABARES
1 Estimates of output by farm size were constructed separately for livestock and
cropping farms in individual ABARES regions and aggregated to the national level
using ABARES survey weights. Comparing farms within particular regions and
industries helps to control for differences in land quality and climate conditions
which cause significant variations in farm performance across Australia.
Because of these differences the estimates presented here should be viewed as
illustrative only, since the increases in production and profitability that are feasible
from an agronomic perspective will be different.
4 Snapshot of Australian Agriculture 2021
ABARES insightsProductivity growth plays a crucial role in offsetting
FIGURE 7 High-revenue farms now account for
the impacts on farm profit from ongoing declines in
one fifth of the broadacre population but two
output prices relative to input prices – known as farm
thirds of land, income and output
terms of trade. Prices for Australian producers are set
Shares of broadacre farm population on international markets, meaning Australian farmers
100 must produce an internationally competitive product
Farms with receipts
greater than $1 million to be profitable. Maintaining productivity growth and
80 Farms with receipts continued innovation is therefore required if Australia
between $200K and is to remain internationally competitive.
$1 million
60
Farms with receipts In recent years, agricultural productivity growth has
less than $200K slowed for several reasons. These include deteriorating
40
seasonal conditions and less intense research and
development efforts. While there is evidence that crop
20
producers are adapting to changing climate conditions,
%
and in so doing have partly restored productivity
1978–79 2019–20p growth, this has not been enough. Further adaptation
efforts will be required to restore productivity growth
Shares of total area operated
100 to past levels.
Farms with receipts
greater than $1 million
80 Farms with receipts
between $200K and
Employment on Australian
60
$1 million
Farms with receipts
farms is significant and
40
less than $200K
varies throughout the year
20 Labour is a key input to Australian agriculture. On-farm
employment, including work by farm owners, has
% fallen by 25% over the past 3 decades (ABS 2020b).
1978–79 2019–20p Australian farms employed 326,000 workers
Shares of farm cash income on average during 2018–19, including full-time,
100
Farms with receipts part-time, casual and contract employees (Figure 8).
greater than $1 million Broadacre farms are the largest employers in
80 Farms with receipts Australian agriculture, followed by fruit, grape and
between $200K and
$1 million nut farms, vegetable farms and dairy farms (Martin,
60
Farms with receipts Randall & Jackson 2020).
less than $200K
40
FIGURE 8 Peak workforce, nature of agricultural
20 employment, 2018–19
100
%
1978–79 2019–20p
80
Shares of total output
100 60
Farms with receipts
greater than $1 million
80 Farms with receipts 40
between $200K and
$1 million
60 20
Farms with receipts
less than $200K %
40 Broadacre farms Dairy farms Fruit, grape Vegetable farms
& nut farms
20 Full-time Part-time Casual Contract
Source: ABARES 2020
%
1978–79 2019–20p
p ABARES estimate for 2019–20.
Note: Farm size categories are defined in real terms (adjusted for inflation).
Income is measured as farm cash income (total cash receipts minus total cash costs).
Source: ABARES
Snapshot of Australian Agriculture 2021
ABARES insights 5Variation in total employment on farms is the result
FIGURE 10 Agricultural, fisheries and forestry
of changes in the use of casual and contract labour
exports by destination
throughout the year. In 2019 the total number of casual
and contract workers employed on farms peaked in 60
February and was at its lowest in June, reflecting the
50
timing of relatively labour-intensive operations, such as
planting and harvest. Horticultural farms tend to use 40
relatively large amounts of casual and contract labour
30
at key times of the year, while broadacre and dairy
farms tend to use this kind of labour more consistently 20
through the year.
10
Around 70% of 2020–21
$b
1998 2001 2004 2007 2010 2013 2016 2019
agricultural output
–99 –02 –05 –08 –11 –14 –17 –20s
40% 62%
is exported Exports to other markets Exports to top 8 markets in Asia
All others Singapore Korea, Rep. of
Australia exports around 70% of the total value New Zealand Hong Kong Indonesia
United States Vietnam Japan
of agricultural, fisheries and forestry production. India China
Export orientation of each industry can vary
s ABARES estimate for 2019–20.
by commodity type. Wheat and beef, which are Note: Export values are measured at the border and so include processing of some
large sectors, are more export-focused than dairy, commodities beyond the farm gate (for example, wine from grapes and cheese from
milk). For this reason production and export values are not directly comparable.
horticulture and pork (Figure 9). Sources: ABARES; ABS International Trade in Goods and Services, Australia (cat. 5368)
In real terms the value of agricultural exports has
fluctuated between $40 billion and $60 billion since
2000–01 (Figure 10). Meat and live animals has been
the fastest-growing export segment, growing 86% over
the period, followed by horticulture up 64% and forest
products up 16%.
FIGURE 9 Australian agriculture is export orientated
Sugar Beef & veal Mutton & lamb
86% 75% 73%
Canola Wheat Rice
72% 71% 52%
70%
of agricultural production is exported
Dairy products
40%
Fruit & nuts
31%
Pig & poultry
5%
Note: Share of agricultural production exported by sector, 3 year average, 2015–16 to 2017–18.
Source: ABARES, following method outlined in Cameron (2017)
6 Snapshot of Australian Agriculture 2021
ABARES insightsGlobal agricultural demand is growing very
strongly, reflecting rising per capita incomes as well Australian farmers
as population growth, but export competition is
also increasing. Asia is the fastest growing export
receive low levels of
region for the Australian agriculture, fisheries and government support
forestry sectors.
Exports to Australia’s eight largest markets in Asia Government support of Australia's agricultural sector
increased by 62% to $33 billion over the 20 years is very low compared to the 37 member countries
to 2019–20 and accounted for 62% of the total of the Organisation for Economic Co-operation and
value of agricultural, fisheries and forestry exports Development (OECD) and other major emerging
in 2019–20. agricultural producers (Greenville 2020). The average
level of support (as a share of gross farm receipts)
China is Australia’s largest export market for for all countries was 11.7% between 2017 and 2019,
agricultural, fisheries and forestry products, at compared to Australia at just 2.3% (Figure 11).
$16 billion in 2019–20. Exports to China are about
5 times larger than they were in 2000–2001. Australia's national competition policy and
pro‑competitive reforms have resulted in lower
Asian demand is projected to double between 2007 agricultural support over time. These reforms have
and 2050, providing opportunities for exporters been consistent with Australia's obligations to the
of high-value, high-quality agricultural and World Trade Organization. Government support for
food products. agriculture is primarily via investments in sector
capacity, such as research and development. Tools
Australian farmers such as farm management deposits and income tax
smoothing help farms manage risks that can arise from
manage significant risk Australia's variable climate.
and variability Keeping subsidies low is important for both
Australian producers and international markets.
Australian agricultural producers manage significant
Australia’s reform experience shows that deregulating
variability, including a highly variable climate and
the agriculture sector and removing distorting
volatile commodity prices. These factors generate
forms of support spurs overall sector growth,
substantial variation in farm output, greater than that
increasing participation in global markets and the
experienced by farmers in most other countries and
contribution that agriculture makes to the rural and
greater than that experienced by business owners in
national economy.
other sectors of the Australian economy (Keogh 2012).
Australian farmers have a number of effective
strategies for managing risk, including maintaining
relatively high levels of equity, liquid assets and
borrowing capacity, using inputs conservatively,
diversifying across enterprises and locations and
earning off-farm income. Well-managed farms are
better prepared for droughts and other risks, such
as global price shocks, and not all farmers in regions
affected by drought experience economic or financial
hardship. For example, over the past 20 years an
average of 50% of broadacre farms generated more
than $50,000 (in real terms) in farm cash income in
a given year. But this proportion varied substantially
with seasonal conditions and prices. In the 2006–07
drought year, just 33% of farms generated more than
$50,000 income, whereas 52% of farms managed to do
so in the 2019–20 drought year.
Snapshot of Australian Agriculture 2021
ABARES insights 7FIGURE 11 Producer support estimates (PSE) as share of gross farm receipts, 2017–2019
70
Emerging economy average
60
OECD average
50
All country average
40
30
20
10
%
–10
–20
–30
Argentina India Ukraine Australia Kazakhstan Costa Rica Mexico United China Turkey Indonesia Japan Switzerland Norway
States
Vietnam New Brazil Chile South Canada Russian Colombia Israel European Philippines Korea, Iceland
Zealand Africa federation Union Rep. of
Note: The all-country average includes all OECD countries, non-OECD EU Member States, and the 13 Emerging Economies. The OECD average does not include the non-OECD EU Member
States. Latvia and Lithuania are included only from 2004. The 13 Emerging Economies include Argentina, Brazil, China, Colombia, Costa Rica, India, Indonesia, Kazakhstan, the Philippines,
Russian Federation, South Africa, Ukraine and Vietnam.
Source: OECD 2020
Trade agreements provide options for exporters
Australia has implemented (Figure 12). An agreement can reduce the
a comprehensive trade concentration risks associated with supplying a single
market by reducing tariffs and making products more
strategy competitive. However, some commodity exports
remain more concentrated towards a single market.
Over the past 15 years, Australia's trade agreements This may be driven by prices or the composition of the
have provided access to new and growing markets, global supply chain.
and have supported the competitiveness of our
products abroad (Duver & Qin 2020). There are only
a few of Australia’s major trading partners where
a preferential trade agreement is not yet in place.
These include the European Union, the United Kingdom
and India. Negotiations with these trading partners
are underway. The pursuit of FTAs with new partners
will remain of key importance to Australia's future
trade agenda, as will the ongoing review and upgrade
of existing FTAs to ensure they continue to support
our competitiveness.
FIGURE 12 Indicators of Australia’s export market concentration for key commodities, 2019–20
120
Size of circle shows relative
100 Wine trade share in China
Number of markets
Lamb
80 Beef and veal Dairy
Vegetables
60 Fruit Mutton
Wheat Nuts
40 Barley
Sugar Wool
Skins
Oats
20 Canola
Live sheep Live cattle
Cotton
0
0 0.2 0.4 0.6 0.8 1.0 1.2
Increasing concentration
Source: ABARES
8 Snapshot of Australian Agriculture 2021
ABARES insightsAgriculture was resilient One of the lasting challenges of COVID-19-related travel
restrictions has been the reduced availability of farm
despite COVID‑19 workers from overseas and higher airfreight costs for
exporters of high-value commodities. Horticulture,
uncertainty some intensive production, and meat processing
industries have been most affected by the reduced
COVID‑19 was a major event for Australia’s agricultural, number of overseas workers. The result been increased
forestry and fisheries sector in 2019–20, but the sector costs of production for these industries and potentially
demonstrated an ability to adapt and transition to new lower horticultural production, as producers find
opportunities (Greenville, McGilvray & Black 2020). it difficult to harvest. Exports of high-value and
Because food is an essential good, demand does not fall highly perishable products, such as live seafood and
significantly in times of crisis, although the types of fresh produce, have also faced cost increases given
goods being demanded through the pandemic shifted the reduced supply of cargo space on flights to key
away from high-value products consumed typically export markets.
in the hospitality sector (e.g. wine and seafood) to
foods consumed at home. Disruptions to domestic
and international food supply chains early in 2020
were largely resolved, allowing agricultural trade to
remain resilient through the pandemic. International
food processors continued to operate and demand
Australian products as inputs; and the resurgence of
international textile and wood products manufacturing
strengthened export demand for these products
throughout 2020–21.
Snapshot of Australian Agriculture 2021
ABARES insights 9References and further Hajkowicz, S & Eady, S 2015, Rural Industry Futures:
Megatrends impacting Australian agriculture over
reading the coming twenty years, Rural Industries Research
and Development Corporation, Canberra, accessed
25 January 2021.
ABARES 2020, Labour use in Australian agriculture,
Australian Bureau of Agricultural and Resource Hochman, Z, Gobbett, D, Holzworth, D, McClelland, T,
Economics and Sciences, Canberra, accessed 2 van Rees, H, Marinoni, O, Garcia, n & Horan, H 2012,
February 2021. Quantifying yield gaps in rainfed cropping systems:
A case study of wheat in Australia, Field Crops Research,
ABS 2020a, Agricultural Commodities, Australia,
vol. 136, pp. 85–96, accessed 25 January 2021.
cat. no. 7121.0, Australian Bureau of Statistics,
Canberra, accessed 09 February 2021. Hughes, N, Lawson, K & Valle, H 2017, Farm
performance and climate: Climate-adjusted
ABS 2020b, Labour Force, Australia, Detailed,
productivity for broadacre cropping farms, Australian
Quarterly, cat. no. 6291.0.55.003, Australian Bureau of
Bureau of Agricultural and Resources Economics and
Statistics, Canberra, accessed 09 February 2021.
Sciences, Canberra, accessed 25 January 2021.
Cameron, A 2017, ‘Share of agricultural production
Keogh, M 2012, Including risk in enterprise decisions
exported’, in Agricultural commodities: December
in Australia’s riskiest businesses, paper presented at
quarter 2017, Australian Bureau of Agricultural and
56th Australian Agricultural and Resource Economics
Resource Economics and Sciences, Canberra, accessed
conference, Fremantle, 7–10 February, accessed
25 January 2021.
January 2021.
Chancellor, W & Zhao, S 2020, Agricultural households:
Kingwell, R, Elliot, P, White, P & Carter, C 2016. Ukraine:
an exploratory analysis revisiting financial position
An emerging challenge for Australian wheat exports,
and well-being in Australia, Economic papers,
Australian Export Grains Innovation Centre, Perth,
DOI: https://doi.org/10.1111/1759-3441.12293
accessed 25 January 2021.
[epub ahead of print], accessed 25 January 2021.
Martin, P, Randall, L & Jackson, T 2020, Labour use
Duver, A & Qin, S 2020, Stocktake of Free trade,
in Australian agriculture, Australian Bureau of
competitiveness and a global world: How trade
Agricultural and Resources Economics and Sciences,
agreements are shaping agriculture, Australian Bureau
Canberra, DOI: https://doi.org/10.25814/gjyp-7g19,
of Agricultural and Resource Economics and Sciences,
accessed 25 January 2021.
Canberra.
Sheng, Y, Jackson, T & Gooday, P 2015, Resource
OECD 2020, Agricultural Policy Monitoring and
reallocation and its contribution to productivity
Evaluation 2020, Organisation for Economic
growth in Australian broadacre agriculture. Australian
Cooperation and Development, OECD Publishing, Paris.
Journal of Agricultural Economics, vol. 61, no. 1, pp.
Fuglie, K 2019, International Agricultural 56–75, DOI: https://doi.org/10.1111/1467-8489.12137,
Productivity. USDA, Economic Research Service, accessed 25 January 2021.
Washington, DC, accessed 25 January 2021.
Sheng, Y, Mullen, JD & Zhao, S 2011, A turning
Greenville J, Analysis of government support for point in agricultural productivity: consideration
Australian agricultural producers, Australian Bureau of the causes, Australian Bureau of Agricultural
of Agricultural and Resources Economics and Sciences, and Resource Economics and Sciences, Canberra,
Canberra. accessed 25 January 2021.
Greenville, J, McGilvray, H & Black, S 2020,
Australian agricultural trade and the COVID-19
pandemic, Australian Bureau of Agricultural and
Resources Economics and Sciences, Canberra,
accessed 25 January 2021.
10 Snapshot of Australian Agriculture 2021
ABARES insightsOwnership of intellectual property rights
Unless otherwise noted, copyright (and any other intellectual property
This work draws on a wide range of material rights, if any) in this publication is owned by the Commonwealth of
produced by ABARES and its staff. Australia (referred to as the Commonwealth).
Creative Commons licence
This edition was prepared by Aruni Weragoda,
All material in this publication is licensed under a Creative Commons
Economist from the Farm Data and Analysis Attribution 4.0 Australia Licence, save for content supplied by third
program and Andrew Duver, Economist from parties, logos and the Commonwealth Coat of Arms.
the Trade and Global Change program.
Creative Commons Attribution 4.0 Australia Licence is a standard form
licence agreement that allows you to copy, distribute, transmit and adapt
this publication provided you attribute the work. A summary of the
The Australian Bureau of Agricultural and Resource licence terms is available from creativecommons.org/licenses/by/4.0.
Economics and Sciences is the research arm of the The full licence terms are available from creativecommons.org/licenses/
Australian Government Department of Agriculture, by/4.0/legalcode.
Water and the Environment. Citation and cataloguing data
Our mission is to provide professionally independent This publication (and any material sourced from it) should be
and world-class multi-disciplinary research, analysis and attributed as ABARES 2021, Snapshot of Australian Agriculture 2021,
Australian Bureau of Agricultural and Resource Economics and
advice to inform decision-makers in this department, other Sciences, Canberra. CC BY 4.0. https://doi.org/10.25814/rxjx-3g23
government agencies and the private sector on significant
issues affecting Australia’s agriculture, fisheries and ISSN 2209-9123
forestry industries. Internet
ABARES performs applied economic and scientific research, Snapshot of Australian Agriculture 2021 is available at
awe.gov.au/abares.
through developing innovative modelling techniques,
undertaking comprehensive surveys and developing Contact
internationally recognised data management processes. Australian Bureau of Agricultural and Resource Economics and Sciences
(ABARES)
Postal address GPO Box 858 Canberra ACT 2601
Switchboard 1800 900 090
Email info.abares@agriculture.gov.au
Web awe.gov.au/abares
Inquiries about the licence and any use of this document should be sent to
copyright@agriculture.gov.au.
Disclaimer
The Australian Government acting through the Department of
Agriculture, Water and the Environment, represented by the Australian
Bureau of Agricultural and Resource Economics and Sciences, has
exercised due care and skill in preparing and compiling the information
and data in this publication. Notwithstanding, the Department of
Agriculture, Water and the Environment, ABARES, its employees and
advisers disclaim all liability, including liability for negligence, for any
loss, damage, injury, expense or cost incurred by any person as a result
of accessing, using or relying on any of the information or data in this
publication to the maximum extent permitted by law.
Professional independence
The views and analysis presented in ABARES publications, including
this one, reflect ABARES professionally independent findings, based
on scientific and economic concepts, principles, information and data.
These views, analysis and findings may not reflect or be consistent
with the views or positions of the Australian Government, or of
organisations or groups who have commissioned ABARES reports or
analysis. More information on professional independence is provided
on the ABARES website at agriculture.gov.au/abares/about/research-
and-analysis#professional-independence.
AABA008.0220
Snapshot of Australian Agriculture 2021
ABARES insights 11You can also read