Investigation of the Interaction Mechanism between Salbutamol and Human Serum Albumin by Multispectroscopic and Molecular Docking
←
→
Page content transcription
If your browser does not render page correctly, please read the page content below
Hindawi
BioMed Research International
Volume 2020, Article ID 1693602, 8 pages
https://doi.org/10.1155/2020/1693602

Research Article
Investigation of the Interaction Mechanism between Salbutamol
and Human Serum Albumin by Multispectroscopic and
Molecular Docking

 Ting Zhao,1 Zihui Liu,2 Jingmei Niu,3 Baoxing Lv,1 Yuliang Xiao ,3 and Yuqin Li 3

 1
 Department of Clinical Pharmacy, Weifang People’s Hospital, Weifang 261041, China
 2
 School of Chemical Science and Engineering, Tongji University, Shanghai 200092, China
 3
 School of Pharmaceutical Sciences, Shandong First Medical University and Shandong Academy of Medical Science,
 Taian 271016, China

 Correspondence should be addressed to Yuliang Xiao; xiaoyl@sdfmu.edu.cn and Yuqin Li; liyuqin@tsmc.edu.cn

 Received 30 August 2019; Revised 17 December 2019; Accepted 30 December 2019; Published 10 February 2020

 Academic Editor: K. H. Mok

 Copyright © 2020 Ting Zhao et al. This is an open access article distributed under the Creative Commons Attribution License,
 which permits unrestricted use, distribution, and reproduction in any medium, provided the original work is properly cited.
 Salbutamol (SBAL), a kind of short-acting beta 2-adrenergic agonist, has been mainly used to treat bronchial asthma and other
 allergic airway diseases clinically. In this study, the interaction mechanism between salbutamol and human serum albumin was
 researched by the multispectral method and molecular docking. The fluorescence intensity of HSA could be regularly enhanced
 with the increase of SBAL concentration. Both the results of the multispectral method and molecular docking showed that SBAL
 could bind HSA with van der Waals force and hydrogen bonds. The binding mechanism was further analysed by UV-Vis and
 synchronous fluorescence spectra. The contents of the secondary structure of free HSA and SBAL-HSA complex were evaluated
 using CD spectra.

1. Introduction animals in many countries [10, 11]. And since it is an illegal
 drug, athletes are not allowed to take it [12, 13].
Salbutamol (SBAL, Figure 1), a short-acting β2-adrenergic Human serum albumin (HSA) accounts for about 60%
receptor agonist, has been basically used to treat bronchial of the total plasma protein and is a common model protein
asthma and other allergic airway diseases clinically [1, 2]. used to study drug-protein interactions. HSA shows a high
Moreover, SBAL also has been used to treat acute hyper- affinity to different materials including drugs, poisons,
kalemia, cystic fibrosis, and spinal muscular atrophy and nutrients, metal ions, and their metabolites [14–16]. Based
relax the uterine smooth muscle to delay premature labor on materials’ affinity to HSA, their absorption, distribution,
[3]. SBAL has been confirmed to burn fat and improve metabolism, and toxicity could be changed in vivo and then
muscle weight in rats, so it was abused as a growth promoter affect their pharmacokinetics, pharmacodynamics, and
and lipid-lowering agent reducing fat deposition in cattle, toxicity. In general, the weak binding drug with HSA could
sheep, pigs, and poultry [4, 5]. And it was also used as an result in a short eliminate time or undesirable distribution,
illegal drug to improve athletes’ muscles to achieve good whereas the strong one could raise the drug concentrations
results [6, 7]. The most common side effects of SBAL are fine in human plasma. HSA could also maintain the blood pH
tremor, anxiety, headache, muscle cramps, dry mouth, and and colloid osmotic blood pressure [17]. To guarantee the
palpitation, and high doses might cause hypokalaemia [8]. safety and efficacy of drug, the binding rate of drug-protein
Meat products containing residual salbutamol could cause must be first developed in designing a new drug.
great harm to the human body [9]. So, SBAL has been In this paper, the interaction mechanism between SBAL
forbidden as a lipid-lowering agent in meat-producing and HSA was researched at three different temperatures
2 BioMed Research International

 1000 The synchronous fluorescence spectra of HSA con-
 OH
 taining different concentrations of SBAL were measured
 NH when the difference between the emission and excitation
 800 OH wavelengths was installed at 15 and 60 nm, respectively. The
 Fluorescence intensity

 j HSA concentration in all the sample solutions was 1.5 μM.
 OH
 600

 2.2.2. Measurement of Absorption Spectra. The UV ab-
 400
 sorption spectra of HSA free and in the presence of SBAL
 a were measured in the range of 200–400 nm using a UV-
 200 2450PC (Shimadzu, Japan) by 1.0 cm quartz cells. All the
 k work solutions contained 1.5 μM HSA and were incubated
 0
 for 5 min at 288 K.
 300 350 400 450 500
 Wavelength (nm)
 2.2.3. Measurement of CD Spectra. The CD spectra of HSA
Figure 1: The chemical structure of SBAL and the SBAL-HSA free and in the presence of SBAL were measured on a JASCO
fluorescence emission spectra. CHSA � 1.5 μΜ, whereas CSBAL was 0,
 J-810 (Japan) using a 0.1 cm quartz cell at 288 K. The buffer
3.33, 6.67, 10.0, 13.3, 16.7, 20, 23.3, 26.7, and 30.0 μΜ from curves a
to j, respectively. For the curve k, CHSA � 0 μΜ and
 solution as the blank was used to correct the CD spectra. The
CSBAL � 10.0 μΜ. Tris buffer, pH � 7.4, T � 288 K, and λex � 295 nm. difference CD spectra of HSA and SBAL-HSA were obtained
 automatically by subtracting the blank after finishing scan.
 To obtain the average CD spectra, each sample was tested
using fluorescence, synchronous fluorescence, ultraviolet- three times. The secondary structure content of HSA was
visible (UV-Vis), and circular dichroism (CD) spectrometry estimated using SELCON3 program.
under the simulated physiological conditions; meanwhile,
molecular docking was used to investigate the binding sites.
 2.2.4. Molecular Docking. SBAL docking with HSA was
2. Materials and Methods performed by MOE2009 (Chemical Computing Group Inc.,
 Montreal, Canada). The structure of SBAL was retrieved
2.1. Materials. Human serum albumin (HSA, content was from DrugBank (http://www.drugbank.ca). Its 3D structures
96–99%), obtained from Sigma Chemical Company in were made with SYBYL-X (Tripos Inc., St. Louis, USA). The
China, was directly used in the experiment with no further optimal geometry conformation of SBAL was done by the
purification and the Mw was specified as 66,500 Da. HSA distance-dependent dielectric function in the standard
stock solution (15 μM) was made in the 0.05mM Tris-HCl Tripos force field [18, 19] with the energy gradient of
buffer solution (pH 7.4 ± 0.1) and placed in the dark at 0.001 kcal mol− 1. Gasteiger–Hückel charges were applied to
0∼4°C. SBAL was presented by Jinwei Pharmaceutical the ligand atoms. The crystal structure of HSA combined
(Shandong) Co., Ltd. and the 1.0 mM stock solution was with warfarin was selected from the Brookhaven Protein
made in absolute methanol. 50 mM (pH 7.4 ± 0.1) Tris-HCl Data Bank and used for docking. First, the hydrogen atom
buffer solution containing 0.10 M NaCl was used to maintain was added to the HSA structure. Then, the complex of HSA-
the pH and ionic strength of all solutions. The remaining SBAL was manipulated to content the requisition of
reagents were of analytical grade. Wahaha pure water was docking. The lowest energy and S value of the conformation
used for all experiments. were specified as the final evaluation standard.

2.2. Methods and Apparatus 3. Results and Discussion
2.2.1. Measurement of Fluorescence Spectra. First, 0.5 mL 3.1. Effect of SBAL on the Intrinsic Fluorescence of HSA.
HSA stock solution was placed in a 5.0 mL volumetric flask, Tryptophan (Trp) residue, phenylalanine (Phe) residue, and
and then SBAL stock solution was sequentially added in it tyrosine (Tyr) residue are the fluorescence groups in HSA.
and diluted to 5.0 mL with the Tris-HCl buffer. Finally, a But the quantum yield of Phe residue is very low, and the
series of SBAL concentration work solutions containing fluorescence intensity of Tyr residue is almost completely
HSA 1.5 μM were incubated for 5 min at 288 K, respectively. quenched when it is ionized or close to an amino group, a
The fluorescence spectra were recorded at 300∼500 nm by carboxyl group, or a Trp. So, the intrinsic fluorescence of
setting the Trp214 excitation wavelength to 295 nm by an HSA mainly comes from only one Trp214 [20]. The Trp214 is
F-4500 fluorescence spectrometer (Hitachi, Japan) and by located in subdomain IIA of Sudlow’s binding site I and gave
fixing the excitation and emission slits to 5 nm. According to the strongest emission at about 340 nm in the fluorescence
the above method, the effect of temperature on the inter- spectrum of HSA when the excitation wavelength is 295 nm.
action of SBAL-HSA complex was estimated at 288, 300, and The fluorescence intensity of Trp-214 is aeschynomenous to
310 K when the excitation/emission wavelength was set at the surroundings and it would be easily affected even if the
295/344 nm. microenvironment of HSA was changed a little, such as
BioMed Research International 3

ligand interaction, the conformational change, and dena- 0.04 0.04
turation of HSA.
 Figure 1 shows the fluorescence spectra of HSA free and
in the presence of SBAL by setting an excitation at 295 nm.
 0.03 0.03
In Figure 1, the curves a and k show the fluorescence
spectrum of free HSA and free SBAL and the curves b–j show

 1/(F – F0)
fluorescence spectra of SBAL-HSA, respectively. It was
found that free SBAL had no distinct fluorescence, and the 0.02 0.02
continuous increase in the concentration of SBAL resulted in
a regular increase in the fluorescence intensity of HSA at
344 nm, while the maximum emission wavelength shifted
 0.01 0.01
from 344 to 336 nm. The results signified that the binding
site of SBAL was near the Trp214 in HSA and the Trp214
microenvironment was altered to more hydrophobic [21]. 0.05 0.10 0.15 0.20 0.25 0.30
The effect of SBAL on the fluorescence intensity of HSA is 1/[Q] (106 L mol–1)
similar to the interaction between syringin and HSA [20]. 288 K
 300 K
3.2. Measurement of Binding Constants. To further illumi- 310 K
nate the interaction mechanism of SBAL-HSA, the Bhat- Figure 2: Plot of 1/(Fx − F0) against 1/[Q] at three different
tacharya equation (equation (1)) [19, 22] was used to process temperatures. λex � 295 nm, λem � 344 nm, Tris buffer, and pH � 7.4.
the fluorescence intensity value (λex\λem, 295\344 nm) at
three temperatures 288, 300, and 310 K: constants and thermodynamic parameters of chemical re-
 1 1 ΔF actions could be described by the following equations [23]:
 � + max . (1)
 ΔF ΔFmax K[Q]
 ΔH0 ΔS0
 ln K � − + , (2)
 In equation (1), ΔF � Fx − F0 and ΔFmax � F∞ − F0. F0, Fx, RT R
and F∞ express the fluorescence intensities of free HSA and
at some intermediate and saturation molar concentration of ΔG0 � ΔH0 − TΔS0 . (3)
SBAL, respectively. K represents the binding constant and
[Q] represents the SBAL molar concentration. Figure 2 In (2), R represents the gas constant. Based on the
records the Bhattacharya curves of the SBAL-HSA at 288, binding constant K from Table 1, thermodynamic param-
300, and 310 K, respectively. In Figure 2, all the plots for the eters were calculated using equations (2) and (3). The ΔH°,
HSA-SBAL had two regression curves, which signified that ΔG°, and ΔS° at three different temperatures are also listed in
SBAL bonded to HSA in two types of binding sites with the Table 1 and they were all negative. ΔG° < 0 demonstrated that
SBAL critical concentration of 0.1 μM. The binding constant SBAL bonded spontaneously with HSA. Both negative
of the first type was named K1 when the SBAL concentration values of ΔH° and ΔS° represented a typical van der Waals
was less than 0.1 μM, and K2 was the binding constant of the force and hydrogen bonds were involved in the formation of
second type when the SBAL concentration was greater than SBAL-HSA complex.
0.1 μM. From Table 1, K1 was about 10 times K2, and the
results suggested that the first binding site had higher affinity
and selectivity than the second with the lower bond energy. 3.4. Estimation of Energy Transfer between SBAL and HSA.
Meanwhile, the value of K1 and K2 decreased with the in- Nonradiation energy transfer (NRET) results could offer a
crease in temperature that implied that a stable complex lot of information on ligand-protein. The rate of energy
might be formed between SBAL and HSA, and it might be transfer is related to the overlap extent between the protein’s
decomposed partially with the temperature increase. fluorescence spectrum and the ligand’s absorbance spec-
 trum, the relative orientations of protein and ligand diploes,
 and the distance (r) between protein and ligand. Figure 3
3.3. Measurement of Thermodynamic Parameters and the presents the fluorescence emission spectrum of HSA
Binding Forces. There are four types of noncovalent bond overlapped with the absorption spectrum of SBAL. NRET
interactions between ligand and protein, including elec- follows the following equations:
trostatic interactions, hydrogen bonds, hydrophobic inter-
actions, and van der Waals forces. Thermodynamic
parameters include free energy (ΔG°), standard enthalpy R60
 E� , (4)
(ΔH°), and standard entropy (ΔS°), which ΔG° can be used as R60
 + r6
the criterion of spontaneous reaction under constant tem- F
perature and pressure. The signs and magnitudes of ΔG°, E�1− , (5)
 F0
ΔH°, and ΔS° are crucial in any reaction and can be used to
estimate the types of interaction forces in the formation of R60 � 8.8 × 10− 25
 K2 N− 4 ϕJ, (6)
SBAL-HSA complex [23]. The relationship between binding
4 BioMed Research International
Table 1: Binding constants and thermodynamic parameters of SBAL-HSA system at different temperatures.
T (K) K (L mol− 1) ΔG° (kJ·mol− 1 K− 1) ΔS° (J·mol− 1) ΔH° (kJ·mol− 1)
288 1.6121 ± 0.71 − 23.52 ± 0.85
300 K1 × 104 1.0886 ± 0.58 − 22.40 ± 0.92 − 93.53 ± 0.82 − 50.46 ± 0.76
310 0.3472 ± 0.81 − 21.47 ± 0.73
288 2.0094 ± 0.44 − 18.18 ± 0.25
300 K2 × 103 1.2214 ± 0.50 − 17.80 ± 0.32 − 31.41 ± 0.37 − 27.23 ± 0.29
310 0.9001 ± 0.78 − 17.49 ± 0.54
700 0.008 the fluorescence change and the shift of fluorescence
emission wavelength, which is due to the polarity alteration
600 of the chromophore microenvironment. The synchronous
0.006
Fluorescence intensity
500 fluorescence spectrum was obtained by simultaneously
scanning the excitation and emission monochromators
Absorbance
400 while setting a constant wavelength difference between them
0.004
300
to get information in the microenvironment for Tyr
(Δλ �15) or Trp (Δλ � 60) [26].
200 The synchronous fluorescence spectra of the SBAL-HSA
0.002
b system are shown in Figure 4. It was found in Figure 4(a) that
100
a the fluorescence intensity of HSA increased with the increase in
0 0.000 SBAL concentration and the fluorescence emission wavelength
300 350 400 450 500 did not shift obviously, illustrating that the microenvironment
Wavelength (nm) of Tyr residues maintained unchanged. On the contrary, the
Figure 3: The overlap of (a) the absorption spectra of SBAL and (b) fluorescence intensity of HSA not only increased with the
the fluorescence emission spectrum of HSA. CHSA � 1.5 μΜ and increase in SBAL concentration and the fluorescence emission
CSBAL � 1.5 μΜ (288 K pH � 7.4, λex � 295 nm). peak was blue-shifted from 282 to 276 nm obviously, indicating
an alternated microenvironment around Trp214 in Figure 4(b).
It was implied that the conformation of HSA was changed with
where E represents the energy transfer efficiency and R0 SBAL binding and resulted in such a manner that the polarity
represents the critical transfer distance of the 50% transfer around Trp-214 was decreased markedly. Therefore, the results
efficiency [17]. F0 and F represent the fluorescence intensity illustrated that the binding site of SBAL with HSA was near the
of free HSA or SBAL-HSA, respectively. About HSA, Trp214. The microenvironment polarity was lowered, and the
K2 � 2/3, ϕ � 0.118, and N � 1.336 [17]. J represents the hydrophobicity was heightened around the Trp214 residues
overlap integral value in Figure 3. J could be estimated using due to the hydrophobic part of SBAL approached enough to
the following equation: the phenyl of Trp214.
F(λ)ε(λ)λ4 Δλ
J� . (7)
{F(λ)Δλ} 3.5.2. Effect of SBAL on the HSA UV-Vis Spectra. The HSA
UV-Vis absorption spectra with and without SBAL are
In equation (7), F(λ) expresses the HSA fluorescence
plotted in Figure 5. From Figure 5, two absorption peaks of
intensity at some λem, ε(λ) expresses the SBAL molar ab-
free HSA at 209 and 278 nm were observed, which presented
sorption coefficient (cm− 1 mol− 1) at the same λem [24].
the conformations of HSA backbone and aromatic amino
Herein, J and E were equal to 9.68 × 10− 15 cm3 M− 1 and 0.10,
acids, respectively. With SBAL binding, the peak at 209 nm
respectively. So, R0 and r were equal to 2.50 and 1.96 nm,
was blue-shifted about 1 nm along with an increase in ab-
respectively. r < 7 nm and 0.5R0 < r < 1.5 R0 obeyed the
sorbance intensity, which indicated the microenvironment
criteria [25]. The results complied that the energy transfer
of Trp214 became more hydrophobic. Meanwhile, the peak
existed between SBAL and HSA. Therefore, it is indicated
at 278 nm was red-shifted about 7 nm along with an ab-
that SBAL as a sensitizer could offer a suggestion to its
sorbance intensity increase because SBAL had a stronger
location near Trp214 in HSA.
absorbance peak at 276 nm. The new peak occurred at
328 nm might due to the complex of SBAL-HSA.
3.5. Effect of SBAL on the HSA Conformation.
Synchronous fluorescence, UV-Vis, and CD spectroscopic
3.5.3. Effect of SBAL on the HSA CD Spectra. CD is a
methods were used for further illustration of the interaction
common method to monitor the secondary structure alter-
mechanism of SBAL with HSA and the content change of
nation of HSA by a ligand binding. The CD graphs of HSA
HSA secondary structure after binding interaction.
either in the existence or nonexistence of SBAL are plotted in
Figure 6, and the secondary structure contents of HSA were
3.5.1. Effect of SBAL on the HSA Synchronous Fluorescence estimated using SELCON3 program which is summarized in
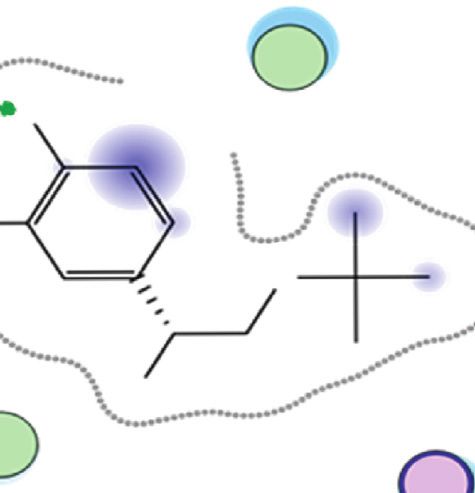
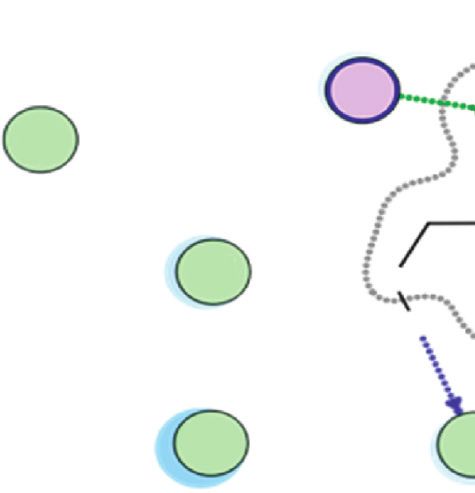
Spectra. Synchronous fluorescence spectrum could show Table 2. In Figure 6, the free HSA CD spectra show two (209BioMed Research International 5 3750 2500 3000 j 2000 Fluorescence intensity j Fluorescence intensity 2250 1500 1500 1000 a a 750 500 0 0 260 280 300 320 340 260 280 300 320 340 Wavelength (nm) Wavelength (nm) (a) (b) Figure 4: The SBAL-HSA synchronous spectra (a) Δλ � 15 nm and (b) Δλ � 60 nm of the patulin-HSA system. CHSA � 1.5 μΜ, and other conditions were the same as in Figure 1. 2.4 5 2.0 0 dmol–1) j 1.6 –5 Absorbance cm2 1.2 (104 deg –10 0.8 a –15 MRE 0.4 –20 0.0 200 250 300 350 400 200 210 220 230 240 250 Wavelength (nm) Wavelength (nm) Figure 5: UV absorption spectra of the SBAL-HSA system. CHSA : CBSNL = 1 :0 CHSA � 1.5 μΜ, and other conditions were the same as in Figure 1. CHSA : CBSNL = 1 :1 CHSA : CBSNL = 1 :2 and 219 nm) conspicuous negative bands, which responded to Figure 6: The SBAL-HSA CD spectra. CHSA � 1.5 μΜ, pH � 7.4, the HSA α-helical structure [27]. The band209 and band219 T � 288 K. intensities of HSA increased with the molar concentration ratio of HSA and SBAL increasing from 1 : 0 to 1 :1, while the α-helix Table 2: Effect of the different SBAL concentrations on the sec- content of HSA decreased from 56.0% to 48.5% along with ondary structure content of HSA. β-sheet content improved from 3.8% to 10.3% and the β-turn CHSA : α-Helix β-Strand β-Turns Unordered (20.4 to 20.5%) and the random coil (19.8 to 20.7%) content CBSAL (%) (%) (%) (%) little changed. But the intensity of the HSA band at 209 and 1:0 56.0 3.8 20.4 19.8 219 nm decreased with the molar concentration ratio of HSA 1 :1 48.5 10.3 20.5 20.7 and SBAL further increasing from 1 :1 to 1 : 2, while the α-helix 1:2 52.6 11.3 19.2 16.9 contents of HSA increased from 48.5% to 52.6% along with the random coil content of the HSA decreased from 20.7% to 16.9% and the β-sheet (10.3 to 11.3%) and the β-turn (20.5 to in HSA crystal structure and each one is composed of 6A and 19.2%) content little changed. Therefore, the CD results further 4B substructure domains, which form a barrel-shaped hy- confirmed that SBAL bonded to HSA with two binding sites drophobic cavitary [28]. The binding site of ligand to HSA is and were in line with the binding constant consequence. mainly located in the hydrophobic gap of IIA (site I) and IIIA (site II). Trp214 in HSA situates in subdomain IIA. In order to probe the SBAL binding site, HSA-warfarin 3.6. Molecular Docking. There are three similar structure complex was selected as a model [29] and HSA-SBAL domains (I–III): I (1–195 residue) and II (196–383 residues) docking study has been done. The most reasonable
6 BioMed Research International

 Leu
 Arg 238
 222 HO
 Phe
 223
 Ser
 287

 Leu H
 219 O N
 H

 HO
 Ala Ile
 291 290 Arg
 257

 Leu
 260
 Ile
 264

 Polar Backbone acceptor Proximity contour
 Acidic Solvent residue Backbone donor
 Basic Metal complex Ligand exposure
 Sidechain acceptor Solvent contact Metal contact
 Sidechain donor Greasy Receptor exposure

 (a) (b)

Figure 7: The SBAL-HSA molecule docking (a) and a projection of Figure 7(a) (b). The amino acid residues in HSA are shown by lines, and
SBAL structure is shown by a ball-and-stick formula. Hydrogen bonds in SBAL-HSA are shown by dotted line.

Table 3: The residues were involved in the binding of SBAL within fluorescence, UV-Vis, and CD spectroscopic methods were
the active site of HSA. used to study the secondary structures and interactions
 The involved residues between SBAL and HSA. On the above findings, the binding
 ΔG° models were built by molecular docking, thus providing the
Complex Hydrogen
 (kcal mol− 1) van der Waals force involved residue information about the complex formation.
 bond
 SBAL was found to be located at Sudlow site I near Trp214.
 Leu219, Phe223,
 Arg222, The results suggested van der Waals force and hydrogen
SBAL-HSA − 11.81 Leu238, Leu260,
 le290 bonds played an important role in the binding of SBAL-
 Ile264, Ile290, Ala291
 HSA.

combining way of SBAL-HSA is presented in Figure 7, where Abbreviations
only residues in the 6 Ǻ range around SBAL are shown, and
the residues involved in the binding of SBAL within the SBAL: Salbutamol
active site of HSA are listed in Table 3. From Figures 7(a) and HSA: Human serum albumin
7(b) and Table 3, SBAL was inserted into the barrel-shaped CD: Circular dichroism
structure of subdomain IIA (residues 222–291). Leu219, λex: Excitation wavelength
Phe223, Leu238, Leu264, and Ile264 residues formed a λem: Emission wavelength
hydrophobic cavity and the nonpolar inside wall of the Trp: Tryptophan
cavity bonds to alkalescent SBAL with van der Waals force. Tyr: Tyrosine
Alkaline Arg222 residues bond to phenol hydroxyl of SBAL Phe: Phenylalanine.
by hydrogen bond, and Ile290 as an acceptor formed a
hydrogen bond with the sidechain hydroxyl of SBAL. The Data Availability
results of molecular docking showed that SBAL could bind
HSA with van der Waals force and hydrogen bonds, which The data used to support the findings of this study are in-
was corresponded to “3.3” and the reference results in [30]. cluded within the article.
The calculated binding ΔG° was − 11.81 kJ mol− 1 K− 1, which
is close to the experimental value (− 18.18 kJ mol− 1 K− 1, Conflicts of Interest
288 K) to a certain degree. The authors declare that they have no conflicts of interest.

4. Conclusion Authors’ Contributions
In the study, the interaction mechanism between SBAL and Ting Zhao carried out fluorescence spectra and data analysis.
HSA was researched under a simulated physiological con- Zihui Liu performed molecular modeling and helped to
dition using a combination of experimental methods and process the reference. Jingmei Niu performed UV-Vis
molecular docking. The binding mechanism of SBLA-HSA spectra and helped to draft the paper. Baoxing Lv finished
was determined using fluorescence spectroscopy, with CD spectra and data analysis. Yuliang Xiao participated in
measuring changes of the Trp214 fluorescence. Synchronous the design of the study and interpreted the results. Yuqin Li
BioMed Research International 7

conceived and designed the study, carried out data analysis, [13] J. Elers, L. Pedersen, J. Henninge, P. Hemmersbach,
interpreted the entire results, and drafted the paper. All K. Dalhoff, and V. Backer, “Urine concentrations of repetitive
authors read and approved the final paper. doses of inhaled salbutamol,” International Journal of Sports
 Medicine, vol. 32, no. 8, pp. 574–579, 2011.
 [14] R. A. Darban, B. Shareghi, A. Asoodeh, and J. Chamani,
Acknowledgments “Multi-spectroscopic and molecular modeling studies of in-
 teraction between two different angiotensin I converting
This work was supported by the Natural Science Foundation enzyme inhibitory peptides from gluten hydrolysate and
of China (no. 81671395), the Science and Technology De- human serum albumin,” Journal of Biomolecular Structure
velopment Plan of Tai’an (no. 2016NS1072), and the Aca- and Dynamics, vol. 35, no. 16, pp. 3648–3662, 2017.
demic Promotion Programme of Shandong First Medical [15] M. Poór, M. Bálint, C. Hetényi et al., “Investigation of non-
University (nos. 2019LJ003 and 2019QL011). covalent interactions of aflatoxins (B1, B2, G1, G2, and M1)
 with serum albumin,” Toxins, vol. 9, no. 11, p. 339, 2017.
 [16] Y. Li, B. Jia, H. Wang et al., “The interaction of 2-mercap-
References tobenzimidazole with human serum albumin as determined
 by spectroscopy, atomic force microscopy and molecular
 [1] L. Moresco, M. Bruschettini, A. Cohen, A. Gaiero, and
 modeling,” Colloids and Surfaces B: Biointerfaces, vol. 104,
 M. G. Calevo, “Salbutamol for transient tachypnea of the
 newborn,” Cochrane Database of Systematic Reviews, vol. 5, pp. 311–317, 2013.
 pp. 1–32, 2016. [17] T. Wang, B. Xiang, Y. Wang et al., “Spectroscopic investi-
 [2] M. Patel and N. C. Thomson, “(R)-salbutamol in the treat- gation on the binding of bioactive pyridazinone derivative to
 ment of asthma and chronic obstructive airways disease,” human serum albumin and molecular modeling,” Colloids
 Expert Opinion on Pharmacotherapy, vol. 12, no. 7, and Surfaces B: Biointerfaces, vol. 65, no. 1, pp. 113–119, 2008.
 pp. 1133–1141, 2011. [18] M. Clark, R. D. Cramer, and N. Van Opdenbosch, “Validation
 [3] S. Fogli, F. Stefanelli, A. Martelli et al., “Protective effect of of the general purpose tripos 5.2 force field field,” Journal of
 high-dose montelukast on salbutamol-induced homologous Computational Chemistry, vol. 10, no. 8, pp. 982–1012, 1989.
 desensitisation in airway smooth muscle,” Pulmonary Phar- [19] J. Bhattacharya, M. Bhattacharya, A. S. Chakraborty,
 macology & Therapeutics, vol. 26, no. 6, pp. 693–699, 2013. U. Chowdhury, and R. K. Podder, “Interaction of chlor-
 [4] W. J. Carter and M. E. Lynch, “Comparison of the effects of promazine with myoglobin and hemoglobin. A comparative
 salbutamol and clenbuterol on skeletal muscle mass and study,” Biochemical Pharmacology, vol. 47, no. 11, pp. 2049–
 carcass composition in senescent rats,” Metabolism, vol. 43, 2052, 1994.
 no. 9, pp. 1119–1125, 1994. [20] W. Gao, N. Li, Y. Chen et al., “Study of interaction between
 [5] J. N. Marchant-Forde, D. C. Lay, R. M. Marchant-Forde, syringin and human serum albumin by multi-spectroscopic
 K. A. McMunn, and B. T. Richert, “The effects of R-salbutamol method and atomic force microscopy,” Journal of Molecular
 on growth, carcass measures, and health of finishing pigs,” Structure, vol. 983, no. 1–3, pp. 133–140, 2010.
 Journal of Animal Science, vol. 90, no. 11, pp. 4081–4089, 2012. [21] M. T. Rehman, H. Shamsi, and A. U. Khan, “Insight into the
 [6] N. Oksbjerg, J. A. Fernandez, H. Jørgensen, O. H. Olsen, binding mechanism of imipenem to human serum albumin by
 T. Rolph, and N. Agergaard, “Effects of salbutamol on protein spectroscopic and computational approaches,” Molecular
 and fat deposition in pigs fed two levels of protein,” Journal of Pharmaceutics, vol. 11, no. 6, pp. 1785–1797, 2014.
 Animal Physiology and Animal Nutrition, vol. 75, no. 1–5, [22] D. Roy, V. Kumar, J. James et al., “Evidence that chemical
 pp. 1–12, 1996. chaperone 4-phenylbutyric acid binds to human serum al-
 [7] M. Hostrup, A. Kalsen, M. Auchenberg, J. Bangsbo, and bumin at fatty acid binding sites,” PLoS One, vol. 10, no. 7,
 V. Backer, “Effects of acute and 2-week administration of oral Article ID e0133012, 2015.
 salbutamol on exercise performance and muscle strength in [23] B. Hemmateenejad, M. Shamsipur, F. Samari, and
 athletes,” Scandinavian Journal of Medicine & Science in H. R. Rajabi, “Study of the interaction between human serum
 Sports, vol. 26, no. 1, pp. 8–16, 2016. albumin and Mn-doped ZnS quantum dots,” Journal of the
 [8] K. J. Broadley, “β-adrenoceptor responses of the airways: for Iranian Chemical Society, vol. 12, no. 10, pp. 1729–1738, 2015.
 better or worse?” European Journal of Pharmacology, vol. 533, [24] D. Li, J. Zhu, J. Jin, and X. Yao, “Studies on the binding of
 no. 1–3, pp. 15–27, 2006. nevadensin to human serum albumin by molecular spec-
 [9] A. Montes Nino, R. Granja, K. Reche et al., “Laboratory troscopy and modeling,” Journal of Molecular Structure,
 validation of an LC-MS/MS method for the detection of vol. 846, no. 1–3, pp. 34–41, 2007.
 ractopamine, clenbuterol and salbutamol in bovine and swine [25] M. Baig, S. Rahman, G. Rabbani, M. Imran, K. Ahmad, and
 muscle at sub-μg·kg− 1 regulatory limits,” Food Additives & I. Choi, “Multi-spectroscopic characterization of human serum
 contaminants. Part A, Chemistry, Analysis, Control, Exposure albumin binding with cyclobenzaprine hydrochloride: insights
 & Risk Assessment, vol. 34, no. 5, pp. 785–792, 2017. from biophysical and in silico approaches,” International
[10] Ministry of Agriculture, “Prohibited list of drugs used in Journal of Molecular Sciences, vol. 20, no. 3, p. 662, 2019.
 animal feed and drinking water,” 2011, http://www.moa.gov. [26] S. Shahraki, F. Shiri, M. H. Majd, and S. Dahmardeh, “Anti-
 cn/zwllm/tzgg/gg/201104/t201104-22_1976307.htm. cancer study and whey protein complexation of new lan-
[11] The European Communities (1997) Council Directive 70/534/ thanum (III) complex with the aim of achieving bioactive
 EEC, Official Journal of European Communities, L270, pp. anticancer metal-based drugs,” Journal of Biomolecular
 3–10, 1977. Structure and Dynamics, vol. 37, no. 8, pp. 2072–2085, 2019.
[12] K. Eibye, J. Elers, L. Pedersen et al., “Formoterol concen- [27] J. N. Miller, “Recent advances in molecular luminescence
 trations in blood and urine,” Medicine & Science in Sports & analysis,” Proceedings of the Analytical Division of the
 Exercise, vol. 45, no. 1, pp. 16–22, 2013. Chemical Society, vol. 16, no. 3, pp. 203–208, 1979.
8 BioMed Research International

[28] Y. Li, G. You, Z. Yang et al., “Investigation of the interaction
 between patulin and human serum albumin by a spectro-
 scopic method, atomic force microscopy, and molecular
 modeling,” BioMed Research International, vol. 2014, Article
 ID 734850, 9 pages, 2014.
[29] D. C. Carter and J. X. Ho, “Structure of serum albumin,”
 Lipoproteins, Apolipoproteins, and Lipases, vol. 45, pp. 153–
 203, 1994.
[30] H. Liu, W. Bao, H. Ding, J. Jang, and G. Zou, “Binding modes
 of flavones to human serum albumin: insights from experi-
 mental and computational studies,” The Journal of Physical
 Chemistry B, vol. 114, no. 40, pp. 12938–12947, 2010.
You can also read