Combined Chi-Square with k-Means for Document Clustering
←
→
Page content transcription
If your browser does not render page correctly, please read the page content below

IOP Conference Series: Materials Science and Engineering

PAPER • OPEN ACCESS

Combined Chi-Square with k-Means for Document Clustering
To cite this article: Ammar Ismael Kadhim and Abood Kirebut Jassim 2021 IOP Conf. Ser.: Mater. Sci. Eng. 1076 012044

View the article online for updates and enhancements.

                              This content was downloaded from IP address 46.4.80.155 on 26/09/2021 at 05:08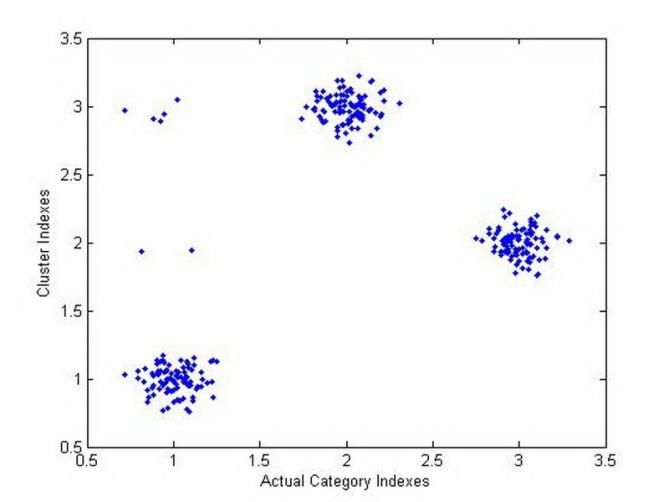
2nd International Scientific Conference of Engineering Sciences (ISCES 2020)                                             IOP Publishing
IOP Conf. Series: Materials Science and Engineering              1076 (2021) 012044           doi:10.1088/1757-899X/1076/1/012044

Combined Chi-Square with k-Means for Document Clustering

                     Ammar Ismael Kadhim1,2 and Abood Kirebut Jassim2
                     1
                       Department of computer science, College of medicine, University of Baghdad,
                     Baghdad, Iraq
                     2
                       Department of computer science, College of science for women, University of
                     Baghdad, Baghdad, Iraq
                     2
                         E-mail: ammarusm70@gmail.com

                     Abstract. Currently, the dynamic website has increased with more than thousands of documents
                     associated to a category topic available. Most of the website documents are unstructured and not
                     in an arranged method and thereby the user suffer to obtain the related documents. A more
                     helpful and efficiency technique by combining document clustering with ranking, where
                     document clustering can collection the similar documents in one category and document ranking
                     can be carried out to each cluster for selecting the best documents in the initial categorization.
                     Besides the specific clustering technique, the different types of term weighting functions
                     implemented to select the features that it represents website document is a chief part in clustering
                     mission. Moreover, document clustering indicates to unsupervised categorization of text
                     documents into clusters in such a method that the text documents in a specific cluster are similar.
                     Therefore, this study proposed a new technique combined chi-square with k-means for clustering
                     the website documents. Furthermore, this study implements information gain and chi-square
                     combined with k-means for document clustering. It helps the user to obtain the whole related
                     documents in one cluster. For experimental objective, it has selected the BBC sport and BBC
                     news datasets to show the superiority of the proposed technique. The experimental findings show
                     that the chi-square with combined with k-means clustering improves the performance of
                     document clustering.

                      Keywords. Document clustering, chi-square, unstructured document, k-means, information
                      gain.

     1. Introduction
     Nowadays, with the growth development in technology, it allows to accumulate huge quantities of
     data of variant types. Text mining displayed as an area concerned with the extraction of valued
     information from raw data. Text mining methods have been implemented to resolve a huge range
     of real-world challenges [1]. Clustering can be defined as an unsupervised text mining technique
     where the tags of data topics are unidentified [2]. Document clustering is commonly defined as the
     process of grouping unstructured document into one or more cluster depend on the relationship
     among the contents [3]. Moreover, the task of the clustering technique to recognize the
     categorization of data topics under investigation. Furthermore, one of the best original techniques is
     grouping documents into different clusters according to the similarity among them [4]. For the text
     mining, this mission is called as clustering and is considered as the most significant and valuable
     fundamental for investigating large amounts of data [5]. It also defined as the result heterogeneous

              Content from this work may be used under the terms of the Creative Commons Attribution 3.0 licence. Any further distribution
              of this work must maintain attribution to the author(s) and the title of the work, journal citation and DOI.
Published under licence by IOP Publishing Ltd                          1
2nd International Scientific Conference of Engineering Sciences (ISCES 2020)                        IOP Publishing
IOP Conf. Series: Materials Science and Engineering      1076 (2021) 012044    doi:10.1088/1757-899X/1076/1/012044

     collections of data utilizing some difference condition [6]. Document clustering has played a vital
     role in several areas such as information retrieval [7]. The problem can be expressed by given a
     group of documents that it is required to split them into several clusters like documents in the same
     set are more related to each other than to documents in other sets. Currently, the feature selection
     techniques concept of process is computed and rank for each feature term utilizing statistical
     knowledge depends on sorting the feature terms, then it select particular feature that rank is
     maximum to final performance document feature [8]. Some well-known techniques are expected
     cross entropy (ECE), document frequency (DF), information gain (IG) and chi-square statistic.
     These techniques is extremely suitable to reduce the feature distance without the loss of
     categorization performance.
     In the context of implementation, the document clustering can be classified into three chief stages:
     • Document preprocessing stage: where the tokenization, stop words and non-meaningful words
          are eliminated.
     • Features selection stage: Two different techniques have been applied to find the related features
          are selected from the original text document. These features input into training step.
     • Document clustering stage: K-means technique has applied to cluster the text into one or more
          categories and to divide text documents into different categories.
     A main difficulty of document clustering is the scope of the original text. To solve this problem,
     feature selection techniques are used to eliminate terminated and unrelated features and choose the
     best distinct features.
 In this study, it presents an enhanced technique of document frequency feature selection technique to
decrease the high-dimension of features as well as to produce a better clustering performance using k-
means technique. Then, it compares with information gain technique with k-means technique on BBC
sport and BBC news datasets.
The rest of the paper is prepared as surveys: the second section presents a review of related work in
document clustering. Then, document preprocessing are introduced in the third section. In section four,
information gain for feature selection are introduced. The document frequency using chi-square
technique for feature selection technique is described in section five. In section six the k-means
clustering technique is utilized to cluster the text documents. While, seven sections experimental results
are introduced. Finally, it will obtain particular conclusions.

2. Related Work
Clustering techniques in related works have been classified according to variant criteria like the kind of
input data, similarity measure functions, the environment of produced cluster and clustering scheme [9].
Firstly, input data in the clustering techniques are classified into three collections of numerical, classical,
and merged clustering [10]. Secondly, similarity functions different similarity measures can be used for
each of the input data kinds like k-means clustering technique utilizes the Euclidean similarity distance
also recognized as the L2 norm for computing the similarity scores among different data clusters [11].
Thirdly, created clusters the clustering techniques can be classified into two classes of Limited (Non-
overlapping) and overlapping techniques [12]. In limited clustering the text documents can only belong
to one of the determined separate clusters while in overlapping clustering technique the text documents
can belong to one or more clusters [13]. The kind of created clusters must not be disordered with the
association function style, firm such as crisp and soft such as fuzzy clustering [14]. In firm clustering
techniques, one text document that is used the binary membership [0,1] whereas 1 is to belong and 0 is
not belong to a while in soft clustering techniques one text document should belong to a cluster with
some grade of membership between 0 and 1 [15].
In the same context, clustering techniques do not require to train set. These techniques do not assign any
predetermined tag to each and all cluster [16]. That is, document clustering are a group of topics and
discover to know the connection among the topics. Text clustering techniques can be broadly classified
into seven categories as follows [17]:
- Hierarchical techniques

                                                            2
2nd International Scientific Conference of Engineering Sciences (ISCES 2020) IOP Publishing
IOP Conf. Series: Materials Science and Engineering 1076 (2021) 012044 doi:10.1088/1757-899X/1076/1/012044
- Density-based techniques
- Grid-based techniques
- Partitioned techniques
- Model-based techniques
- Common pattern-based clustering
- Limitation-based clustering
For hierarchical techniques, the technique generates a nested group of clusters, which are arranged as a
specific tree like agglomerative techniques [18]. Agglomerative techniques is initially treated every
topic as a separate cluster as well as successively mix the two of clusters, which are nearby to another
for creating new clusters till whole of the clusters can mix into one partition [19]. For density-based
techniques set the features topics with random forms. Document clustering have achieved with respect
to a density (number of topics) [20]. Grid-based techniques use multi-density grid construction to group
the features topics. The pros of this technique is its speed in handling time [21]. For partitioned
techniques, it generates a group of feature non-overlapping clusters like every feature topic may collect
in one subgroup. Thereby, selecting a score for the desired amount of clusters to be created like K-means
clustering and different of K-means techniques [22]. Model-based techniques utilize a set for every
cluster and accomplish the suitable of the feature to the specified set. As well as they are also used to
automatically accomplish the amount of clusters [23]. Common pattern-based utilizes sets are selected
from subgroups of dimensions in order to cluster the feature topics [24]. Finally, constraint-based
techniques realize clustering based on user-given. Users’ constraints on clustering like users’
requirements or properties of the clustering findings. They are difficult in a completely unsupervised
learning. This attributed to the absence of a well-defined method to guess the class of clustering findings
[25].
This study chi-square with k-means is used to enhance the performance for clustering documents by
relying on specific terms to cluster document into one or more class. The hybrid technique is decreased
the irrelevant features via using different pre-processing techniques and reduced the computations
complexity via combined the chi-square with k-means.
3. Systematic scheme methodology:
The systematic scheme can be divided into four chief phrases like document preparing, feature
selection, document clustering and performance evaluation as displayed in Figure 1.
Document Preparing Feature Selection
Performance Evaluation Document Clustering
Figure 1. The phrases of systematic approach.
3.1. Document preparing:
Document preparing involves of document input, term tokenization, stop words and non-meaningful
words are removed. Then after the split and filter document, the high-dimension of the term feature
vector can be meaningfully decreased, and then the processing task required in the detection phase can
be reduced significantly.
32nd International Scientific Conference of Engineering Sciences (ISCES 2020) IOP Publishing
IOP Conf. Series: Materials Science and Engineering 1076 (2021) 012044 doi:10.1088/1757-899X/1076/1/012044
Five methods for document preparing:
1. Term Tokenization
2. Removing common terms: stop words
3. Term Normalization
4. Stemming and Bright Stemming
5. Text Document Representation
Term tokenization: It can be defined as the task of cutting it up into segments that is named tokenization.
Moreover, it may be to remove the particular symbols like punctuation [26]. As well as a token can be
defined as a case of a series of symbols in certain text document that are collected together as a benefit
semantic unit for handling. This type of the whole tokens involving the similar symbol series. A term is
a kind that is contained in the information retrieve approach.
Removing common terms: Stop terms are public terms that should occur to be of slight value in the
selection documents corresponding a user require are omitted from the vocabulary completely [27]. The
common strategy for defining a stop term list is to index the terms by group frequency and then to
income the best frequent words, frequently manual clarified for their semantic satisfied related to the
field of the documents being sorted like stop word database, the memberships of that are then rejected
via indexing process.
Term Normalization: As term parameters have of variable size and measures, thereby it is a principle
that was measured the term parameters in order to be comparable [28]. Term measuring can be achieved
by normalizing the term parameters that is naturally achieved on the self-governing parameters. Term
normalization measures every term parameter into a domain of 0 and 1 as displayed in equation (1) as
follows:
xij − x j
Biggest
=
Normalization
xij (1)
− xj
Biggest Sammllest
x j
Where indicates to the normalized value, denotes to the value of importance, denotes to the smallest
value and indicates the biggest value. Then being measured, the smallest value should be 0 and the
maximum value should be 1, while whole other values should become in among the intervals [0, 1].
Stemming and Bright Stemming: It can be defined as the task of eliminating prefixes and suffixes from
terms and it was also used decreasing transformed terms to their stem [29]. Thereby, the stem
requirement is not be determined to the creative morphological origin of the term and it is typically
returned to map terms to the same stem. This task is utilized to decrease the amount of terms in the
vector space model and enhance the performance evaluation of the clustering technique when the variant
formulas of terms are stemmed into a particular term. “play”, “plays”, “played”, and “playing” is an
example that obeyed to the stem. The group of terms is conflated into a single term by the elimination
of the variant suffixes -s, -ed, and -ing to obtain the unique term. This paper used the standard Porter
Stemming method for finding the root terms in the text document.
The chief objective for utilizing bright stemming is that several terms different do not have similar
semantics. Nevertheless; these terms different are created from the same root [30]. Thereby, stem
extraction methods impact on the meanings of terms. Moreover, bright stemming by assessment goals
to improve the document clustering performance whereas retaining back the terms senses. It eliminates
particular distinct prefixes and suffixes from the term rather than extracting the unique stem.
Text Document Representation: it represents of a set of text documents to vectors in a public vector
space is displayed as the vector space model (VSM) as well as it is a vital task of information retrieval
techniques reaching from counting text documents on an enquiry and clustering [31]. An essential stage
is the sight of enquiries as vectors in the similar vector space and as the document group [32]. In SVM,
the contents of a text document are indicated by a multi-dimensional space vector. The correct categories
of the specified vector are identified by comparing the spaces among vectors. The process of the VSM
can be classified into three steps: firstly, document indexing is sort the document whereas the best related
terms are extracted. Secondly, identifying the weights related to sort terms to enhance the retrieval
42nd International Scientific Conference of Engineering Sciences (ISCES 2020) IOP Publishing
IOP Conf. Series: Materials Science and Engineering 1076 (2021) 012044 doi:10.1088/1757-899X/1076/1/012044
related to the researcher. Finally, classifying the text document with a particular scale of relationship.
The best public VSM adopts that the substances are vectors in the high-dimensional term space. A public
method is the bag-of-words (BOW) of documents. The similarity score function is typically depend on
the space among the vectors in particular metric that is used in VSM. Each text document can represent
as vector space, V(d)=((t1,w1),(t2,w2),…,(tn,wn)). ti can be defined as the term i in text document d, wi
can be defined as the weight of ti in text document d. The score of wi can become 0 or 1 as shown in
equation (2) as follows:
1 ti d i
wij = (2)
0 otherwise
In this situation, clustering technique cannot be completed efficiently and competently. Document
indexing consists selecting an appropriate group of terms depend on the whole corpus of text documents,
and assigning weights to these terms for each specified text document, thereby transmuting each text
document into a vector of term weights. This weight is generally connected to the frequency of
occurrence of the feature in the document and the amount of documents that utilize that feature.
3.2. Feature selection using information gain:
Information Gain (IG) can be defined as the task that used to scale the number of information gained for
class by identifying whether the absence or presence of a feature document [33]. It frequently sorts the
IG amount of each distinctive in training model to choose particular important terms that it required.
Moreover, Information gain refers to decrease the entropy that specified a particular term as shown in
Equation (3) that was given by [34] as follows:
as follows:
n n\ − n\ − −
IG(t ) = p(ci ) log p(ci ) + p(t ) p(ci | t ) log p(ci | t ) + p(t ) p(ci | t ) log p(ci | t ) (3)
i =1 i =1 i =1
where refers to the ith class, refers to the likelihood of the ith class, and are the likelihood that the term
t occurs or not in the text documents, refers to the conditional likelihood of the i th class specified that
−
term t occurred and p(ci | t ) refers to the conditional likelihood of the ith class specified that term t not
occurred.
3.3. Feature selection using chi-square:
The Chi-square technique formula is associated to information hypothetical feature selection purposes
which attempt to show the perception that the most terms tm for the class ci can be defined as the ones
distribution most differently in the groups of positive and negative model of class ci as shown in
Equation 4 was given by [35] as follows:
N ( AD − CB) 2
Chi − square(t m , ci ) = (4)
( A + C )( B + D)( A + B)(C + D)
where N can be defined as the amount of text documents in the dataset, A can be defined as the amount
of text documents in category ci that involve the term tm, B can be defined as the amount of text
documents that involve the term in other categories, C can be defined as the amount of text documents
in category ci that do not involve the term tm and D is the number of text documents that do not involve
the term tm in other categories.
Each feature is given a rank in each category as defined in Equation (4). After then, entirely these ranks
are combined with a particular final rank of max (Chi-square (tm, ci)).
Thereby, the final rank is utilized to index all features from the highest rank to the lowest rank and the
highest rank is selected with the thresholding value m (where m=0.7) from the total number of features.
Documents clustering:
52nd International Scientific Conference of Engineering Sciences (ISCES 2020) IOP Publishing
IOP Conf. Series: Materials Science and Engineering 1076 (2021) 012044 doi:10.1088/1757-899X/1076/1/012044
Document clustering can be defined as the task of automatically clustering the topics in a particular
collection with respect to the similarities of their characteristic features [3]. For example, given a group
D of n documents that it wants to split them into a predefined number of k subgroups D1, D2, …, Dk,
like the documents specified to each subgroup are more similar to each other than the documents
specified to different subgroups. Moreover, document clustering is considered as a vital task of text
mining that is used to several applications in knowledge management and in information retrieval. Two
big problems was faced in document clustering: the high-dimensional of the number of features and the
huge of a document collection. Furthermore, the features inside each cluster are expected to display big
similarities between the group and specific cluster as well as the features across variant clusters are
predicted to show big differences between the group and specific cluster. The task can be defined as
unsupervised as due to do not have any information about the classes in the collection is predefined.
Unsupervised document clustering is an actual influential procedure for identification the unseen
construction. This paper was focused on the attention on a particular technique of cluster investigation
named designated K-means clustering.
3.4 Document clustering using k-means:
K-means clustering can be defined as a collection of n topics is partitioned into k clusters that are
modified recursively if they essence into an arranged split. The k-means repetition is realized in two
stages: assignment and modifying.
For assignment stage, each feature in the collection is specified to the neighboring cluster by using a
space metric. Thereby, the space between a specific cluster and a specified feature is computed in a
vector space document via calculating the space between the specified feature documentation and the
cluster centroid. The cluster centroid (μ) of the text documents in a specific cluster F as given in
Equation 5 was presented by [36] as follows:
1 →
(F ) =
F
x
xF
(5)
While, for modifying stage, the whole cluster centroids that are modified via compelling into attention
the new split generated through the preceding stage. Furthermore, cluster centroid vectors have
presented by the average vector of the whole features going to the corresponding clusters that used in
K-means clustering. K-means starts from a predetermined group of centroids and realizes consecutive
repetitions of the assignment and modifying stages till do not have any adjustments to the split that are
observed consecutive repetitions.
The process of the document clustering as shown in the following:
Phase 1: Prepare the factors used for K-means.
Phase 2: Describe the amount of clusters.
Phase 3: Describe the primary group of cluster centroids and achieve the testing model for the K-means.
Phase 4: To detect matching among cluster and category tags:
- Calculate cosine similarity spaces between cluster and class centroids.
- Choice the greatest values cluster-to-class assignment.
Phase 5: Investigate the whole likely assignments.
Phase 6: Calculate the total spaces for the whole status.
Phase 7: Obtain the greatest assignment
Phase 8: Return to Phase 3, stop till do not any novel assignment.
4. Experimental results:
4.1. Dataset:
Two different datasets are used in this study:
The first dataset is a BBC English that was gathered from the BBC news website matching to news
articles in five fields from 2004-2005. While the second dataset is the BBC sports that gathered from
the BBC sports website matching to sports articles in five fields from 2004-2005. Table 1 shows the
details information of two datasets (BBC news and BBC sports).
62nd International Scientific Conference of Engineering Sciences (ISCES 2020) IOP Publishing
IOP Conf. Series: Materials Science and Engineering 1076 (2021) 012044 doi:10.1088/1757-899X/1076/1/012044
Table 1. The details information for two datasets.
No. Dataset No. of documents No. of single terms No. of classes
1. BBC news 2225 9636 5
2. BBC sports 737 4163 5
4.2. Performance Evaluation:
Two different datasets (BBC news and BBC sports) were achieved under the combined (information
gain with k-means clustering and chi-square with k-means clustering for the comparison). Thereby, it
utilized the same platform dataset but with different sizes of text documents. For BBC sports dataset,
737 text documents contains of five nature classes. 4.163 single features per class is used for training
sets and 300 features per class that are used for testing sets. While for BBC news dataset, 2.225 text
documents contains of five nature classes. 9.636 single features per category is used for training sets and
600 features per class is used for testing sets. These features were used to perform the greatest
comparison of the impact on feature selection that are used two techniques (information gain and chi-
square) with combined k-means clustering for grouping three clusters with do not any information about
each cluster. For the results comparison, it was used via general metrics like accuracy (Acc.), precision
(P.), recall (R.) and F1-measure as shown was given by [37] as shown in the following:
Accuracy (Acci.): Is represented as the ratio between the numbers of text documents that the text
documents are correctly classed with the total numbers of text documents categorized for each category
as given in equation (6) in the following:
(TP ) i + (TN ) i
Acci . = (6)
(TP ) i + (TN ) i + ( FP) i + ( FN ) i
where (TP)i is represented as the true positive, (TN)i is represented as the true negative, (FP)i is
represented as the false positive and (FN)i is represented as the false negative.
Precision (Pi.): is represented as the ratio of the right text document that correctly categorized among the
whole associated text documents for each category as given in equation (7) in the following:
(TP ) i
Pi . = (7)
(TP ) i + ( FP) i
Recall (Ri.): is represented as the ratio of the right text document that correctly categorized among the
whole assigned text document for each category as given in equation (8) in the following:
(TP ) i
Ri . = (8)
(TP ) i + ( FN ) i
F1=measure: this measure is represented as the harmonic indicates to the precision and recall as given
in in equation (9) in the following:
2 Pi Ri
F1 − measure = (9)
( Pi + Ri )
The different numbers in feature selection stage was used to simplify the analysis of the performance
for the two features selection techniques combined with k-means clustering. The results showed that the
performance metrics was reduced when the numbers of single features is 300 with respect to BBC sport
and it increased with the numbers of single features is 600 for BBC news dataset. These increased were
occurred by the selected features is increased with increase the numbers of features. Table 2 shows the
comparison between IG and chi-square combined with k-means clustering based on BBC sports dataset.
72nd International Scientific Conference of Engineering Sciences (ISCES 2020) IOP Publishing
IOP Conf. Series: Materials Science and Engineering 1076 (2021) 012044 doi:10.1088/1757-899X/1076/1/012044
Table 2. Performance metrics for combining IG and chi-square with k-means
clustering based on BBC sports dataset.
IG with K-means clustering Chi-square with K-means clustering
Class
Acc. P. R. F1 Acc. P. R. F1
Cricket 0.74 0.80 0.83 0.81 0.76 0.83 0.85 0.84
Football 0.74 0.80 0.82 0.81 0.73 0.81 0.82 0.81
Athletics 0.71 0.77 0.80 0.79 0.71 0.78 0.79 0.79
Tennis 0.64 0.71 0.71 0.71 0.69 0.78 0.77 0.77
Rugby 0.63 0.69 0.70 0.70 0.73 0.82 0.79 0.80
Figure 2 displays the graph of comparison between IG and chi-square combined with k-means clustering
according to the average of performance metrics based on BBC sports dataset.
IG with K-means clustering chi-square with K-means clustering
0.80 0.80 0.80
0.77
0.76 0.76
0.72
0.69
Acc. P. R. F1
IG with K-means clustering 0.69 0.76 0.77 0.76
chi-square with K-means clustering 0.72 0.80 0.80 0.80
Figure 2. The graph of the average of performance metrics based on BBC sports dataset.
As shown in Figure 2, it was showed that the average of performance metrics by using chi-square
combined with k-means clustering is slightly better than other technique based on BBC sports.
Furthermore, chi-square combined with k-means clustering gets better findings when the number of
features is 300 for all performance metrics. Additionally, the best value of F1-measure was 0.80%, while
for the other technique, the best value of F1-measure was 0.76 based on BBC news dataset. Table 3
illustrates the comparison between IG and chi-square combined with k-means clustering based on BBC
news dataset.
82nd International Scientific Conference of Engineering Sciences (ISCES 2020) IOP Publishing
IOP Conf. Series: Materials Science and Engineering 1076 (2021) 012044 doi:10.1088/1757-899X/1076/1/012044
Table 3. Performance metrics for combining IG and chi-square with k-means clustering
based on BBC news dataset.
IG with K-means clustering Chi-square with K-means clustering
Class
Acc. P. R. F1 Acc. P. R. F1
Entertainment 0.77 0.85 0.84 0.85 0.79 0.85 0.88 0.87
Business 0.75 0.82 0.84 0.83 0.77 0.87 0.84 0.85
Technology 0.71 0.80 0.79 0.80 0.78 0.86 0.86 0.86
Sport 0.74 0.81 0.81 0.81 0.76 0.82 0.85 0.84
Politics 0.64 0.73 0.81 0.77 0.74 0.81 0.83 0.82
Figure 3 illustrates the graph of comparison between IG and chi-square combined with k-means
clustering according to the average of performance metrics based on BBC news dataset.
IG with K-means clustering chi-square with K-means clustering
0.85 0.85
0.84
0.82
0.81
0.80
0.77
0.72
Acc. P. R. F1
IG with K-means clustering 0.72 0.80 0.82 0.81
chi-square with K-means clustering 0.77 0.84 0.85 0.85
Figure 3. The graph of the average of performance metrics based on BBC news dataset.
Chi-square combined with k-means clustering finds better findings when the number of features is 600
for all performance metrics. Moreover, the best value of F1-measure was 0.85%, while for the other
technique, the best value of F1-measure was 0.81 based on BBC news dataset. For BBC news dataset,
the average of all performance metrics outperformed the other dataset. This attributed to increase the
number of features, where the result values were increased with increased the number of features.
The overall of results comparison, it can be clearly observed that the chi-square combined with k-means
clustering is slightly better than the other technique. This attributed to the chi-square combined with k-
means clustering is quite stable for the dataset and the style process modeling via selecting the specific
features for both BBC sports and BBC news datasets. Figures 4 shows the three clusters grouping by
combining chi-square with k-means clustering based on BBC sports dataset.
92nd International Scientific Conference of Engineering Sciences (ISCES 2020) IOP Publishing
IOP Conf. Series: Materials Science and Engineering 1076 (2021) 012044 doi:10.1088/1757-899X/1076/1/012044
Figure 4. The three clusters grouping by combining chi-square with k-means
clustering based on BBC sports datasets.
Figure 5 displays the three clusters grouping by combining chi-square with k-means clustering based on
BBC news dataset.
Figure 5. The three clusters grouping by combining chi-square with k-means
clustering based on BBC news datasets.
As shown in Figures 4 and 5, it was showed that the chi-square combined with k-means clustering for
three clusters based on BBC sports and BBC news datasets respectively. According to the Figure 4, the
three clusters have taken the diagonal shape with a little of noise. While in Figure 5, the three clusters
have taken a regular shape with a little bit of noise based on BBC news dataset. The figures showed
that the clusters behave in a similar manner but in different shapes directions.
For the complexity of each technique, the procedure of IG includes identifying whether the absence or
presence of a feature in a text document. Where it must be frequently sorted the IG amount of each
individual in training model to select specific significant terms that it necessary. Furthermore, IG states
102nd International Scientific Conference of Engineering Sciences (ISCES 2020) IOP Publishing
IOP Conf. Series: Materials Science and Engineering 1076 (2021) 012044 doi:10.1088/1757-899X/1076/1/012044
to reduce the entropy that stated a specific term. For the complexity of each technique, the procedure of
IG includes identifying whether the absence or presence of a feature in a text document. Where it must
be frequently sorted the IG amount of each individual in training model to select specific significant
terms that it necessary. Furthermore, IG states to reduce the entropy that stated a specific term. While
the procedure of chi-square technique formula is related to information hypothetical feature selection
that tried to show the perception of the most terms tm for the class ci the ones distribution as two groups
(positive and negative).
The IG takes O(NQI) time, N is the number of training text documents, Q is the number of testing text
documents, and I is the number of classes for features selection. Thereby, the time complexity is become
O(NQI)+O(P(c)*P(t), where p(c) can be defined the likelihood of the ith class, p(t) can be defined as the
likelihood of term t that occur in specific class is computed. While the chi-square gives O(N2C) time to
train, where N can be defined as the number of training text documents and C can be defined as the
number of classes. Thereafter, calculating and obtaining the most features of the class comprises
computing the occurrence as two group. Therefore, the whole time is identified by O(NC)+O(N2c) =
O(N2c) for each class. The chi-square gives O(N2CIN) time for N training text documents and I
repetition. Thus, chi-square technique is perfectly much less computationally expensive than IG for
feature selection that reflects to reduce the complexity time of chi-square.
5. Conclusion:
This study has done experimental results of performance of combined information gain with k-means
and chi-square with k-means for document clustering. The experimental arrangement included selecting
term weighting Boolean technique and using variant document preprocessing steps (tokenization,
removing common terms, term normalization, stemming and bright stemming and text document
representation schemes). Moreover, the findings of an enhanced feature selection technique (IG and chi-
square) combined with k-means clustering based on different dataset (BBC sports and BBC news) for
document clustering and compares between both of them. For experimental results showed that the
combined chi-square with k-means clustering gets best document clustering findings with another
technique (information gain with k-means) based on different datasets (BBC sport and BBC news). This
is attributed to the chi-square combined with k-means clustering is quite stable for the dataset and the
style process modeling via selecting the specific features for both BBC sports and BBC news datasets.
Boolean weighting generates relatively the best results for document clustering. The findings with chi-
square is slightly better than information gain for feature selection. Consequently, the increased in
number of feature is impact on the performance metrics. The chi-square combined with k-means
clustering obtains the best viewed for document clustering according to the performance metrics.
References
[1] S. A. Salloum, M. Al-Emran, A. A. Monem, and K. Shaalan, "Using text mining techniques for
extracting information from research articles," in Intelligent natural language processing:
Trends and Applications, ed: Springer, 2018, pp. 373-397.
[2] S. Inzalkar and J. Sharma, "A survey on text mining-techniques and application," International
Journal of Research In Science & Engineering, vol. 24, pp. 1-14, 2015.
[3] M. Allahyari, S. Pouriyeh, M. Assefi, S. Safaei, E. D. Trippe, J. B. Gutierrez, et al., "A brief
survey of text mining: Classification, clustering and extraction techniques," arXiv preprint
arXiv:1707.02919, 2017.
[4] T. Basu and C. Murthy, "A similarity assessment technique for effective grouping of
documents," Information Sciences, vol. 311, pp. 149-162, 2015.
[5] J. Burch, T. Moore, R. Torbert, and B. Giles, "Magnetospheric multiscale overview and science
objectives," Space Science Reviews, vol. 199, pp. 5-21, 2016.
[6] M. Bafadhel, S. McKenna, S. Terry, V. Mistry, C. Reid, P. Haldar, et al., "Acute exacerbations
of chronic obstructive pulmonary disease: identification of biologic clusters and their
112nd International Scientific Conference of Engineering Sciences (ISCES 2020) IOP Publishing
IOP Conf. Series: Materials Science and Engineering 1076 (2021) 012044 doi:10.1088/1757-899X/1076/1/012044
biomarkers," American journal of respiratory and critical care medicine, vol. 184, pp. 662-671,
2011.
[7] P. Prabhu, "’Document Clustering for Information Retrieval–A General Perspective’,"
Available at SSRN 2190318, 2011.
[8] I. Tsamardinos, G. Borboudakis, P. Katsogridakis, P. Pratikakis, and V. Christophides, "A
greedy feature selection algorithm for Big Data of high dimensionality," Machine learning, vol.
108, pp. 149-202, 2019.
[9] M. Shtern and V. Tzerpos, "Clustering methodologies for software engineering," Advances in
Software Engineering, vol. 2012, 2012.
[10] S. S. Ramakrishna and T. Anuradha, "AN EFFECTIVE FRAMEWORK FOR DATA
CLUSTERING USING IMPROVED K-MEANS APPROACH," International Journal of
Advanced Research in Computer Science, vol. 9, 2018.
[11] A. Singh, A. Yadav, and A. Rana, "K-means with Three different Distance Metrics,"
International Journal of Computer Applications, vol. 67, 2013.
[12] T. S. Madhulatha, "An overview on clustering methods," arXiv preprint arXiv:1205.1117, 2012.
[13] V. Tunali, T. Bilgin, and A. Camurcu, "An Improved Clustering Algorithm for Text Mining:
Multi-Cluster Spherical K-Means," International Arab Journal of Information Technology
(IAJIT), vol. 13, 2016.
[14] M. Ji, F. Xie, and Y. Ping, "A dynamic fuzzy cluster algorithm for time series," in Abstract and
Applied Analysis, 2013.
[15] D. J. Bora, D. Gupta, and A. Kumar, "A comparative study between fuzzy clustering algorithm
and hard clustering algorithm," arXiv preprint arXiv:1404.6059, 2014.
[16] A. Kassambara, Practical guide to cluster analysis in R: Unsupervised machine learning vol.
1: STHDA, 2017.
[17] U. Kokate, A. Deshpande, P. Mahalle, and P. Patil, "Data stream clustering techniques,
applications, and models: comparative analysis and discussion," Big Data and Cognitive
Computing, vol. 2, p. 32, 2018.
[18] W. Cui, S. Liu, Z. Wu, and H. Wei, "How hierarchical topics evolve in large text corpora," IEEE
transactions on visualization and computer graphics, vol. 20, pp. 2281-2290, 2014.
[19] A. Bouguettaya, Q. Yu, X. Liu, X. Zhou, and A. Song, "Efficient agglomerative hierarchical
clustering," Expert Systems with Applications, vol. 42, pp. 2785-2797, 2015.
[20] R. J. Campello, D. Moulavi, and J. Sander, "Density-based clustering based on hierarchical
density estimates," in Pacific-Asia conference on knowledge discovery and data mining, 2013,
pp. 160-172.
[21] V. Bhatnagar, S. Kaur, and S. Chakravarthy, "Clustering data streams using grid-based
synopsis," Knowledge and information systems, vol. 41, pp. 127-152, 2014.
[22] B. Shanmugapriya, "Clustering Algorithms for High Dimensional Data–A Review,"
International Journal of Computer Science and Information Security (IJCSIS), vol. 15, 2017.
[23] C. Bouveyron and C. Brunet-Saumard, "Model-based clustering of high-dimensional data: A
review," Computational Statistics & Data Analysis, vol. 71, pp. 52-78, 2014.
[24] D. Guijo-Rubio, A. M. Durán-Rosal, P. A. Gutiérrez, A. Troncoso, and C. Hervás-Martínez,
"Time-Series Clustering Based on the Characterization of Segment Typologies," IEEE
Transactions on Cybernetics, 2020.
[25] T. Van Craenendonck and H. Blockeel, "Constraint-based clustering selection," Machine
Learning, vol. 106, pp. 1497-1521, 2017.
[26] S. Vijayarani and R. Janani, "Text mining: open source tokenization tools-an analysis,"
Advanced Computational Intelligence: An International Journal (ACII), vol. 3, pp. 37-47, 2016.
[27] W. Zhang, T. Yoshida, X. Tang, and Q. Wang, "Text clustering using frequent itemsets,"
Knowledge-Based Systems, vol. 23, pp. 379-388, 2010.
[28] H. I. Koo and D. H. Kim, "Scene text detection via connected component clustering and nontext
filtering," IEEE transactions on image processing, vol. 22, pp. 2296-2305, 2013.
122nd International Scientific Conference of Engineering Sciences (ISCES 2020) IOP Publishing
IOP Conf. Series: Materials Science and Engineering 1076 (2021) 012044 doi:10.1088/1757-899X/1076/1/012044
[29] N. Sandhya, Y. S. Lalitha, V. Sowmya, K. Anuradha, and A. Govardhan, "Analysis of stemming
algorithm for text clustering," International Journal of Computer Science Issues (IJCSI), vol. 8,
p. 352, 2011.
[30] S. Vijayarani, M. J. Ilamathi, and M. Nithya, "Preprocessing techniques for text mining-an
overview," International Journal of Computer Science & Communication Networks, vol. 5, pp.
7-16, 2015.
[31] P. D. Turney and P. Pantel, "From frequency to meaning: Vector space models of semantics,"
Journal of artificial intelligence research, vol. 37, pp. 141-188, 2010.
[32] W. B. A. Karaa, A. S. Ashour, D. B. Sassi, P. Roy, N. Kausar, and N. Dey, "Medline text mining:
an enhancement genetic algorithm based approach for document clustering," in Applications of
Intelligent Optimization in Biology and Medicine, ed: Springer, 2016, pp. 267-287.
[33] J. Gonzalez-Lopez, S. Ventura, and A. Cano, "Distributed multi-label feature selection using
individual mutual information measures," Knowledge-Based Systems, vol. 188, p. 105052,
2020.
[34] G. Kou, P. Yang, Y. Peng, F. Xiao, Y. Chen, and F. E. Alsaadi, "Evaluation of feature selection
methods for text classification with small datasets using multiple criteria decision-making
methods," Applied Soft Computing, vol. 86, p. 105836, 2020.
[35] S. Bahassine, A. Madani, M. Al-Sarem, and M. Kissi, "Feature selection using an improved
Chi-square for Arabic text classification," Journal of King Saud University-Computer and
Information Sciences, vol. 32, pp. 225-231, 2020.
[36] I.-D. Borlea, R.-E. Precup, F. Dragan, and A.-B. Borlea, "Centroid update approach to K-means
clustering," Advances in Electrical and Computer Engineering, vol. 17, pp. 3-11, 2017.
[37] A. I. Kadhim, "Term Weighting for Feature Extraction on Twitter: A Comparison Between
BM25 and TF-IDF," in 2019 International Conference on Advanced Science and Engineering
(ICOASE), 2019, pp. 124-128.
13You can also read