A quantitative approach for conservation of endangered and endemic plants from Kosovo, SE Europe - Sciendo
←
→
Page content transcription
If your browser does not render page correctly, please read the page content below
FOLIA OECOLOGICA – vol. 47, no. 1 (2020), doi: 10.2478/foecol-2020-0007

 A quantitative approach for conservation of endangered and endemic
 plants from Kosovo, SE Europe

 Naim Berisha1, Elez Krasniqi1*, Fadil Millaku1,2

 1
 Faculty of Natural Sciences and Mathematics, University of Prishtina, Str. “George Bush”, 31, 10 000,
 Prishtina, Republic of Kosovo
 2
 Faculty of Agribusiness, University “Haxhi Zeka”, Str. “UÇK”, 30 000, Peja, Republic of Kosovo

 Abstract
 Berisha, N., Krasniqi, E., Millaku, F., 2020. A quantitative approach for conservation of endangered and
 endemic plants from Kosovo, SE Europe. Folia Oecologica, 47 (1): 52–63.

 Basic patterns of most priority biodiversity areas of Kosovo that shall be considered for conservation studies
 are offered here. On this work, all plant taxa that are included in the Kosovarian Red list are analysed and their
 analogy is interpreted to conservation priority hotspots. Kosovo represents an important centre for Balkan
 biodiversity; therefore a quantitative evaluation of the importance of different priority areas for conserving
 plant diversity of Kosovo is very much needed. This study provides a detailed quantitative approach concern-
 ing the identification of priority areas for biodiversity conservation, using threatened and endangered plant
 taxa in well-known grid squares system. Used grid squares (20 × 20 km) were classified into four different
 groups in terms of their conservation importance. Valuation factors taken into account are IUCN based risk
 category, endemism as well as ecological and distributional attributes. The results indicated that there are
 four grid squares – D4 (0.4300), G7 (0.3910), G8 (0.2750) and E4 (0.2860), that have remarkable conserva-
 tion importance. These grid squares are all located along mostly high-elevation areas of two National Parks
 in Kosovo. These national scale data should prove to be very appropriate and easy to follow evidence for
 environmental decision-making bodies as well as be used for further research.

 Keywords
 IUCN, Kosovo, plant conservation, threatened plants

Introduction derstandable quantitative and qualitative estimates of ex-
 tinction risk in the wild for endangered and endemic taxa
The determination of high priority biodiversity areas and (Gärdenfors, 2001; Possingham et al., 2002; Türe and
the development of effective conservation measures with Böcük, 2010; Florentine et al., 2013). Anyhow, in order
a view to saving as many plant taxa as possible are funda- to acquire effective conservation assessment, exact quanti-
mentally key steps in conservation strategies (Warman and tative criteria for evaluating the relative degree of exposed
Sinclair 2000; Linder, 2001; Millaku et al., 2017). In threat by taxa are required (Stoms, 2000). Proper planning
this context, the national-based Red lists (based on IUCN - in the framework of protected areas by using multi-criteria
International Union for Conservation of Nature - rules and evaluations that result in creation of accurate biodiversity
guidelines) remain the most popular tools for their proper maps and other valuable outputs are of crucial impor-
identification (Vermeulen and Koziell, 2002; Martin, tance therein (Freitag, et al., 1998; Whittaker et al.,
2009). Red lists primary aim is to offer clear and easy un- 2005).

*Corresponding author:
e-mail: elez.krasniqi@uni-pr.edu
© 2020 Authors. This is an open access article under the CC BY-NC-ND license (http://creativecommons.org/licenses/by-nc-nd/4.0/)

52
Kosovo represents an important biodiversity centre Data collection
of Europe with high level of plant diversity and ende-
mism. The entire flora contains 3,000 vascular plant taxa Evaluating diversity of endemic and threatened species
(Stevanović, 1999; 2007; Millaku, 2013), with 9.9% and their distributional patterns always relies directly on
of them being threatened (Millaku, 2013; Table 1) and the available databases and particular country informa-
over 19% endemic (Rexhepi, 1982; Krasniqi, 1998; tion. In Kosovo, ten volumes “Flora of SR Serbia” is
Stevanović, et al. 2003; Tomović et al., 2014). Their a main source of plant diversity up to now (Josifović,
most common threats are unsustainable land management 1970–1976, 1977; Sarić and Diklić, 1986). These records
practices, fire, grazing as well as cultivation malpractices. were completed by herbarium collections (Herbarium of
Kosovo’s plant diversity is relatively well documented on the Faculty of Mathematics and Natural Sciences of the
Grid-System started by Stevanović et al. (2007) and addi- University of Prishtina) and sources concerning plant spe-
tionally by Millaku (2013). Nonetheless, it requires more cies distribution in Kosovo (Hayek, 1924–1933; Turrill,
detailed quantitative evaluation in order to specify sites of 1929; Tutin et al., 1964–1980; Rexhepi, 1986, 1997,
conservation priorities. Thus, the aims of the present study 2007; Stevanović et al., 2003, 2007; Rexhepi et al., 2005,
are: (i) to specify the distribution patterns of threatened 2009; Amidžić et al., 2013; Tomović et al., 2003, 2014;
endemic plants based on grid-square system and IUCN- Millaku et al., 2008, 2017) and the Red Book of Vascular
based risk category assigned by the Red Book of Vascu- Plants of the Republic of Kosovo (Millaku 2013).
lar Plants of Kosovo (Millaku 2013), (ii) to determine In our study, we analyzed articles published up to
conservation importance of grid squares using quantita- 2018 and updated information accordingly concerning the
tive approach with the numbers of threatened and endemic threatened plant taxa and the endemics, their risk status
plant taxa and (iii) to provide information on their phyto- and distribution areas by taking into consideration all the
geographical origin and taxonomical affiliation at the lev- available literature sources we could acquire about new
el of families and genera. This national-based, extensive records and published checklists for Kosovo (Rexhepi,
biodiversity pattern of threatened and endemic vascular 1982, 1986; Hundozi, 1983; Pajazitaj, 1985; Krasniqi
plants can then become a spotlight for further comprehen- et al., 1990; Amidžić and Krivošej, 1998; Ranđelović et
sive studies and detailed conservation planning. al., 1998; Millaku et al., 2008, 2017, 2018; Ukaj et al.,
 2012; Amidžić et al., 2013; Anonymous, 2014; Berisha
 et al., 2014; Krasniqi et al., 2015a, 2015b).
 Table 1. Distribution of plant taxa according to their risk
Table 1. Distribution of plant taxa according to their risk
 categoryininKosovo
 Kosovo(for
 (formore
 moredetails
 detailssee
 seeMillaku,
 MILLAKU2013)
 , 2013) Analysis
category

 Risk category No. of species % The Grid System description of the distribution of native
 EX (extinct) 1 0.03 vascular plants has proven to be very convenient for floris-
 tic and systematic studies alike. Up to now, a large number
 EW (extinct in the wild) 1 0.03
 of studies are being based on this system, therefore, we
 CR (critically have chosen the same system for our study due to ease of
 61 2.03
 endangered) data manipulation.
 EN (endangered) 86 2.86 Using the traditional list method we initially deter-
 VU (vulnerable) 19 0.63 mined the number of threatened and endemic plants in
 NT (near threatened) 34 1.13 each grid square (20 × 20 km). Each grid square had an
 assigned number of plant taxa it bears. Later, using the
 LC (least concern) 35 1.16
 “Ordered Weighted Averaging” (OWA) method, we de-
 termined the conservation importance (CI) of each grid.
 Using this method, we have considered the number of
 grids in which each taxon is distributed, the threatened
Materials and methods and endemic plant number in each grid square and the
 significance of each risk category – all this followed by
Study area assigning appropriate numerical values to each variable
 according to their importance (Vermeulen and Koziell,
Kosovo is located between 41°–43° north latitude and 2002).
20°–21° east longitude in the central part of the Balkan The risk category values were established as follows:
Peninsula (Fig. 1), South-Eastern Europe. It is situated
 EX (extinct) 8
inside of a mountainous ring with a total of 10,908 km2
land area, surrounded by Sharri Mts in the southern part, EW (extinct in the wild) 7
Kopaonik Mts in the north and Bjeshkët e Nemuna in the CR (critically endangered) 6
south-west. Kosovo belongs to the temperate zone with EN (endangered) 5
a typical continental climate being prevalent in the coun-
 VU (vulnerable) 4
try. The annual average temperature varies between 9.3 ºC
and 9.5 ºC and annual rainfall values range from 700 mm NT (near threatened) 3
and 900 mm (Çavolli, 1997). LC (least concern) 2.

 53
A logical grouping of assessed taxa was applied while defining the ‘Threatened Value’, in a sense when a ce higher threat level and confined distribution argues a higher TV within a grid square(s) than another comparable taxa w levels, with wider distribution and with lower threat levels. Our calculation followed formula: 8 ti TVD = ∑∙ ∑ (9 − i) ∙ (29 − ng) ∙ nD i,ng i−1 ng=1 The values have the following meaning: TV – Threat value; D – represents any grid square; nD i,ng – represents the threatened plant taxa number in related grid, risk category and grid number; i – represents the risk category importance factor; ng – represents the “number of grid squares” in which threatened and taxa naturally occur. The ‘Total Threat Value’ of all grid squares is Fig. 1. Location of Kosovo in South-Eastern Europe. = ∑ Fig. 1. Location of Kosovo in South-Eastern Europe. and finally, the Conservation Importance (hereafter CI) for a grid square is: The following variables were applied for each grid square to estimate the Threatened Value (TV): = • the number of threatened and endemic plant taxa (n) • the level of risk categoryFor foreacheachgrid square, and threatened the CI en-values were estimated For each and used grid square, the for the assessments CI values in conservation were estimated and priority terms demic plant taxa (i) from 0 to 1 and are applied to the wholeused for the assessments grid squares. Higher CI values in conservation priority indicate higher terms. importance. After conservation • the number of grid squares (ng) in which threatened Values range from 0 to 1 and are applied to the whole grid CI values for each grid square, they were arranged into four main groups as follows: and endemic plant taxa are naturally distributed. squares. Higher CI values indicate higher conservation A logical grouping of“Very assessed hightaxaconservation was applied importance” – if CI valuesAfter while importance. of a calculating grid square >the theCIaverage valuesCI ̅each for(CI ) + αgrid defining the ‘Threatened Value’, “High in a sense when a certain square, ̅sense they were arranged into four main groups as fol- rouping of assessed taxa was applied while defining conservation Value’,–inif aCI importance” the ‘Threatened + α >when Cl value of the taxa a certain grid square with taxa with higher threat level and confined distribution ar- lows: and confined distribution gueswas aargues higher aTVhigher within TV within a“Average a grid grid square(s) square(s) conservation than another importance” than another com- ̅“Very comparable –•if CI taxaconservation < Clhigh value with of a lower threat grid square ̅ – α – if CI values of < CI importance” uping of assessed taxa applied while defining the ‘Threatened Value’, in a sense when a certain taxa with distribution and withparable taxa with lower threat levels. lower threat levels, with wider distribu- a grid square > the average CI (C1) + α d confined distribution tionargues and with a higher lowerTV threatwithin levels.a grid square(s) than another comparable • “Hightaxa with lowerimportance” conservation threat – if C1+ α > Cl value tion followed formula: Our calculation followed formula: of the grid square tribution and with lower threat levels. 8 ti • “Average conservation importance” – if C1< Cl value on followed formula: TVD = ∑∙ ∑ (9 − i) ∙ (29 − ng) ∙ nD i,ng of a grid square < – α 8 ti i−1 ng=1 • “Low conservation importance” – if Cl value of a grid TVThe –TVThreat value; i) ∙ (29 − ng) ∙ nD e following meaning: TV Dvalues = ∑∙have – Threat value;the ∑ (9 − D –following representsmeaning: any grid i,ng square; square < C1 – α. TV––represents D Threat i−1value; any grid square; ng=1 he threatened plant taxa – number in related grid, risk category and grid number; ollowing meaning: D TV represents any grid square; D – Threat value; D – represents any grid square; ––represents ni,ngfactor; sk category importance represents the the the threatened ng – represents threatened ofplant plant taxa “number number grid taxainnumber squares” re- in which in Results relatedand threatened grid, risk plant endemic category and grid threatened plant taxa number lated grid, in related risk grid,and category riskgridcategory number;and grid number; r. k category importance number; i – factor; represents ng –the risk category represents the “number importance factor; of grid squares” in which Threatened threatened plant taxa of plant and endemic seven risk categories were re- Threat Value’ of all ng grid–squares representsis the “number of grid squares” in which corded in 33 out of 41 total grid squares in Kosovo. The i – represents the risk category importance factor; highest threat values were found for the grid squares C5, threatened and endemic plant taxa naturally occur. Thesquares ng reat Value’ of all grid –‘Total Threat Value’ represents is “number the = of all∑grid squares of gridis squares” in which D4, E4, threatened G6, G7, G8 and and H6.endemic Threatened and endemic plant taxa plant taxa of CR and EN categories mostly dominated in D4, nservation Importance naturally (hereafteroccur. CI) for = ∑ a grid square is: E4, G7 and G8 grid squares (Table 2), but 60 taxa were represented exclusively in one square. The highest num- ber of endangered and endemic plant species was found and finally, the ervation Importance (hereafter CI) for a grid Conservation square = Importance is: (hereafter CI) for a grid square is: in grid squares D4, E4, G7, G8, and H6, although many id square, the CI values were estimated and=used for the assessments in conservation priority terms. Values range applied to the whole 54grid squares. Higher CI values indicate higher conservation importance. After calculating the square, the CI values were estimated and used for the assessments in conservation priority terms. Values range grid square, they were arranged into four main groups as follows: pplied to the whole grid squares. Higher CI values indicate higher conservation importance. After calculating the ervation importance” – if CI values of a grid square > the average CI (CI ̅) + α id square, they were arranged into four main groups as follows:
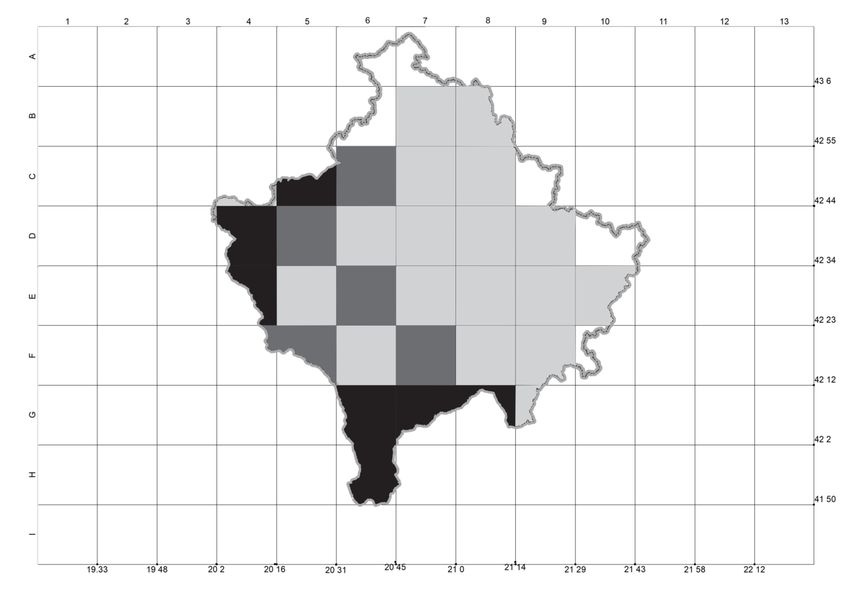
grid squares (C5, C6, D4, D9, E4, E6, E7, F5, F6, F7, F9, of ~300.000) as endemics and should have experienced
G6, G7, G8, G9 and H6) contain at least one plant species a major loss of >65% of its primary vegetation (Myers et
evaluated in CR category (Table 3). al., 2000).
 Most of the recorded taxa originated from South-East- The families and genera with the highest threatened en-
ern Europe (80), followed by Balkan (21) and Mediterra- demics are Asteraceae, Caryophyllaceae, Brassicaceae and
nean-Mountain (18), but only a relatively few were associ- Achillea, Viola, Potentilla, respectively (Fig. 3 and Fig. 4).
ated with phytogeographic regions of Eurimediterranean The highest conservation importance (CI) was determined
(9) and Orophyte of SE-Europe (8). There is also 19 steno- for grid squares situated in the southern and western part
endemic species recorded in flora of Kosovo (Table 4). of the country, e.g. D4 (0.4300), G7 (0.3910), G8 (0.2750),
 The grid squares classification on the map of Kosovo is E4 (0.2860), B7 (0.0699), H6 (0.2040), G6 (0.2040) and
based on their conservation importance, as shown in Figure C5 (0.1940). On the contrary, the grid squares (A6, A7,
5. The grid squares, according to their individual gained CI A8, B6, C9, D10, D11 and F10) with the lowest (zero)
values (Fig. 2) were split into four respective groups: very CI values following our methodology occur primarily in
high, high, medium and low CI group. Grid squares that northern and eastern regions (Fig. 2, 5).
reached CI values of >0.19 were classified into the very In this context, the ratio of endemic species in Koso-
high CI group [D4 (0.4300), G7 (0.3910), G8 (0.2750), vo towards the total global diversity is insignificant and
E4 (0.2860), H6 (0.2040), G6 (0.2040) and C5 (0.1940)].
 does not meet the criteria of a global hotspot. However,
Grid squares that reached CI values of >0.03 were clas-
 the number of endemics (and sub-endemics) in Kosovo
sified into the high CI group [F5 (0.1130), F7 (0.1430),
 towards its small territory and the approximate number of
E6 (0.1250), D5 (0.0740), F8 (0.0540), F9 (0.0540), C6
 plant taxa is relatively high (19% from ca 3,000 plant taxa
(0.0480), G9 (0.03110), D9 (0.0400), F6 (0.0350), D7
 in total). Kosovo differs from most countries in SE Europe
(0.0350), C4 (0.0340) and D8 (0.0310)]. Grid squares that
 and the Balkans with its rich plant diversity, with dominant
reached CI values of >0.001 were classified into the me-
 mountainous chorological groups and orophytic elements.
dium CI group [F4 (0.0260), E7 (0.0250), B8 (0.0150),
D6 (0.0150), C7 (0.0140), B7 (0.0130), C8 (0.0100), E9 It ranks high in terms of biodiversity richness among coun-
(0.0100), E10 (0.0100), E8 (0.0090), E5 (0.0060) and H7 tries of this part of Europe (Rexhepi, 1982; Stevanović,
(0.0050)]. And finally, all grid squares that reached zero CI 1996; Tomović et al., 2014; Gavrilović et al., 2017). This
values were classified into the low CI group [A6, A7, A8, could be explained by heterogenous geological substrates
B6, C9, D7, D8, E11 and F10]. (limestone, silicate and serpentine) accompanied by wide
 altitudinal range (297 m at the shores of the White Drin
 river up to 2,656 m at the peak of Gjeravica Mt.), which
Discussion in turn create distinct vegetation types with unique plant
 species assemblages. A combination of diverse climatic,
One of the most basic conservation duties relies on the edaphic and habitat conditions have facilitated the devel-
proper identification of high-biodiversity priority areas that opment and survival of many high-mountain plant taxa
are facing or are expected to face biodiversity loss (Trous- that were differentiated during the long and intriguing
dale and Gregory, 2004; Chang-Le et al., 2007). Each speciation processes (Stevanović and Stevanović, 1995).
of the world regions has its own biodiversity hotspots and Additionally, micro-allopatric speciation (Tzedakis et al.,
they indicate areas of higher priority for protection region- 2002) and the period of Ice Age (Rexhepi, 1982) were par-
ally or locally (Boufford and van Dijk, 1999; Araùjo, ticularly significant for isolation and the consequent neo-
2002). While “global hotspots” are those specific areas of speciation processes, during which new infraspecific taxa
the planet that contain >0.5% of world plant species (out were created.

 Table2.2.The
Table Thegrid
 gridsquares
 squares(ng)
 (ng)with
 withoccurrence
 occurrenceofofthreatened
 threatenedand
 andendemic
 endemicplant
 planttaxa
 taxaand
 andtheir
 theirThreat
 Threatvalue
 value(tv)
 (tv)

 NG TV NG TV NG TV NG TV
 A6 0 C8 10 E4 297 F6 40
 A7 0 C9 0 E5 6 F7 162
 A8 0 D4 472 E6 151 F8 59
 B6 0 D5 85 E7 25 F9 54
 B7 13 D6 15 E8 9 F10 0
 B8 15 D7 35 E9 10 G6 229
 C4 34 D8 31 E10 10 G7 443
 C5 210 D9 51 E11 0 G8 312
 C6 53 D10 0 F4 26 G9 52
 C7 14 D11 0 F5 165 H6 246
 H7 5

 55
Table 3. Distribution of threatened and endemic plant taxa of Kosovo according to their corresponding risk category, by each grid square. a) Total threatened plants in each grid
 square, the threatened
 Table 3.b)Distribution and endemic
 of threatened andplant
 endemic of Kosovo
 taxa plant distributed
 taxa of in only one
 Kosovo according to grid
 theirsquare
 corresponding risk category, by each grid square. a) Total threatened plants in each grid square,

56
 b) the threatened and endemic plant taxa of Kosovo distributed in only one grid square
 a) b)
 Grid Grid
 EX EW CR EN VU NT LC Total EX EW CR EN VU NT LC Total
 sq. sq.
 A6 0 0 0 0 0 0 0 0 A6 0 0 0 0 0 0 0 0
 A7 0 0 0 0 0 0 0 0 A7 0 0 0 0 0 0 0 0
 A8 0 0 0 0 0 0 0 0 A8 0 0 0 0 0 0 0 0
 B6 0 0 0 0 0 0 0 0 B6 0 0 0 0 0 0 0 0
 B7 0 0 0 2 0 1 0 3 B7 0 0 0 0 0 0 0 0
 B8 0 0 0 3 0 0 0 3 B8 0 0 0 0 0 0 0 0
 C4 0 0 0 0 5 0 7 12 C4 0 0 0 0 0 0 0 0
 C5 0 0 3 18 6 12 21 60 C5 0 0 2 0 0 0 0 2
 C6 0 0 1 9 3 2 10 25 C6 0 0 3 0 0 0 0 3
 C7 0 0 0 0 1 2 2 5 C7 0 0 0 0 0 0 0 0
 C8 0 0 0 1 0 1 1 3 C8 0 0 0 0 0 0 0 0
 C9 0 0 0 0 0 0 0 0 C9 0 0 0 0 0 0 0 0
 D4 0 0 8 22 16 42 62 150 D4 0 0 4 1 0 0 0 5
 D5 0 0 2 6 6 1 8 23 D5 0 0 0 0 0 0 0 0
 D6 0 0 0 3 0 0 0 3 D6 0 0 0 0 0 0 0 0
 D7 0 0 2 3 1 0 2 8 D7 0 0 0 0 0 0 0 0
 D8 0 0 0 0 4 3 3 10 D8 0 0 0 1 0 0 0 1
 D9 0 0 2 5 2 2 0 11 D9 0 0 2 0 1 0 0 3
 D10 0 0 0 0 0 0 0 0 D10 0 0 0 0 0 0 0 0
 D11 0 0 0 0 0 0 0 0 D11 0 0 0 0 0 0 0 0
 E4 0 0 2 18 20 23 23 86 E4 0 0 1 0 0 0 0 1
 E5 0 0 1 0 0 0 0 1 E5 0 0 0 0 0 0 0 0
 E6 0 0 5 10 8 7 9 39 E6 0 0 3 0 0 0 0 3
 E7 0 0 3 0 1 1 0 5 E7 0 0 1 0 0 0 0 1
Table 3. Distribution of threatened and endemic plant taxa of Kosovo according to their corresponding risk category, by each grid square. a) Total threatened plants in each grid
 square, b) the threatened and endemic plant taxa of Kosovo distributed in only one grid square
 Table 3. Continued.

 a) b)
 Grid Grid
 EX EW CR EN VU NT LC Total EX EW CR EN VU NT LC Total
 sq. sq.
 E8 0 0 0 1 1 0 0 2 E8 0 0 0 0 0 0 0 0
 A6 0 0 0 0 0 0 0 0 A6 0 0 0 0 0 0 0 0
 E9 0 0 1 0 1 0 0 2 E9 0 0 0 0 0 0 0 0
 A7 0 0 0 0 0 0 0 0 A7 0 0 0 0 0 0 0 0
 E10 0 0 0 2 0 0 0 2 E10 0 0 0 0 0 0 0 0
 A8 0 0 0 0 0 0 0 0 A8 0 0 0 0 0 0 0 0
 E11 0 0 0 0 0 0 0 0 E11 0 0 0 0 0 0 0 0
 B6 0 0 0 0 0 0 0 0 B6 0 0 0 0 0 0 0 0
 F4 0 0 0 1 1 3 4 9 F4 0 0 0 1 1 0 0 2
 B7 0 0 0 2 0 1 0 3 B7 0 0 0 0 0 0 0 0
 F5 0 0 10 17 2 2 3 34 F5 0 0 1 0 0 0 0 1
 B8 0 0 0 3 0 0 0 3 B8 0 0 0 0 0 0 0 0
 F6 0 0 1 1 3 3 4 12 F6 0 0 3 0 0 0 0 3
 C4 0 0 0 0 5 0 7 12 C4 0 0 0 0 0 0 0 0
 F7 0 0 4 10 12 8 8 44 F7 0 0 3 0 1 0 0 4
 C5 0 0 3 18 6 12 21 60 C5 0 0 2 0 0 0 0 2
 F8 0 0 1 4 6 3 0 14 F8 0 0 0 0 0 0 0 0
 C6 0 0 1 9 3 2 10 25 C6 0 0 3 0 0 0 0 3
 F9 0 0 0 2 0 1 1 4 F9 0 0 1 0 0 0 0 1
 C7 0 0 0 0 1 2 2 5 C7 0 0 0 0 0 0 0 0
 F10 0 0 0 0 0 0 0 60 F10 0 0 0 0 0 0 0 0
 C8 0 0 0 1 0 1 1 3 C8 0 0 0 0 0 0 0 0
 G6 1 1 2 21 3 14 20 60 G6 0 0 4 1 0 0 0 5
 C9 0 0 0 0 0 0 0 0 C9 0 0 0 0 0 0 0 0
 G7 0 0 10 35 9 30 41 125 G7 1 1 7 0 0 0 0 9
 D4 0 0 8 22 16 42 62 150 D4 0 0 4 1 0 0 0 5
 G8 0 0 7 19 7 19 45 97 G8 0 0 6 0 0 0 0 6
 D5 0 0 2 6 6 1 8 23 D5 0 0 0 0 0 0 0 0
 G9 0 0 4 3 1 1 3 12 G9 0 0 3 0 0 0 0 3
 D6 0 0 0 3 0 0 0 3 D6 0 0 0 0 0 0 0 0
 H6 0 0 8 19 11 11 13 62 H6 0 0 6 1 0 0 0 7
 D7 0 0 2 3 1 0 2 8 D7 0 0 0 0 0 0 0 0
 H7 0 0 0 0 0 1 1 2 H7 0 0 0 0 0 0 0 0
 D8 0 0 0 0 4 3 3 10 D8 0 0 0 1 0 0 0 1
 D9 0 0 2 5 2 2 0 11 D9 0 0 2 0 1 0 0 3
 D10 0 0 0 0 0 0 0 0 D10 0 0 0 0 0 0 0 0
 D11 0 0 0 0 0 0 0 0 D11 0 0 0 0 0 0 0 0
 E4 0 0 2 18 20 23 23 86 E4 0 0 1 0 0 0 0 1
 E5 0 0 1 0 0 0 0 1 E5 0 0 0 0 0 0 0 0
 E6 0 0 5 10 8 7 9 39 E6 0 0 3 0 0 0 0 3
 E7 0 0 3 0 1 1 0 5 E7 0 0 1 0 0 0 0 1

57
One of the most widely accepted evaluation criteria for corded on beech forests and woodlands of Northern, North-
threatened and endemic species are IUCN Red lists (Ver- Eastern and Eastern Kosovo.
meulen and Koziell, 2002; Martin, 2009) that are equally Remarkable floristic diversity with many endemic spe-
used to identify priority biodiversity areas for conservation cies and consequently very high CI values were observed in
(Samways and Grant, 2007). area (grid squares) of ‘Bjeshkët e Nemuna’ National Park,
 On our work, we present two different evaluation meth- including several important mountain ranges (e.g., Zhleb,
ods. The list method includes only the numbers of threatened Gjeravicë, Maja e Strellcit, Pleçe, Koprivnik and Liqenat).
and endemic plant taxa for each grid square. All these plant Almost equally very high CI values were recorded across the
taxa are seen as equal to each other concerning their gained ‘Sharri’ National Park in the south. This area covers various
values (Cavieres et al., 2002). The provided information here mountains, such as Vracë, Kobilicë, Luboten, Maja e Zezë,
is rather crude and mostly unsatisfactory including numbers Oshlak, Brod and Koritnik. The high conservation impor-
(Keith, 1998), though they can be useful for certain compar- tance was also ascribed to Pashtrik Mt. in the SW Kosovo
ative analysis. The second method (Ordered Weighted Aver- (grid square F5). There is ongoing initiative from the Minis-
aging) represents a useful methodology when comparing the try of Environment to establish this region as a Natural Park
conservation merit of plant taxa. This approach is not solely (Anonymus, 2018) because its high biodiversity value has
based on threatened endemic and endangered plant taxa been proven several times (Rexhepi, 1982; Millaku, 2013;
numbers for each grid square but also some quantitative val- Millaku et al., 2017; Mustafa et al., 2018).
ues, be it risk category level and distribution characteristics
of the given taxa. As a result of this approach, the obtained
conservation priorities for the grid squares are different from Table 4. Distribution of phytogeographic origins of threatened
two methods. This is especially noticeable in grid squares Table
 and 4. Distribution
 endemic of phytogeographic
 plant taxa in Kosovo origins of threate-
with higher CI values; even in grid squares of the same CI ned and endemic plant taxa in Kosovo
values they seem almost similar to each other. Consequently,
 No. of %
this method allows a rather more effective arrangement of Phytogeographic region
 species
grid squares based on their conservation priorities (Vermeu-
len and Koziell, 2002; Valente and Vettorazzi, 2008). SE-Europe 80 31%
 Several previous studies (e.g., Stebbins and Major, Balkan 31 12%
1965; Médail and Verlaque, 1997; Wege et al., 2014) Stenoendemic 21 8.0%
pointed out that the highest concentration of endemic taxa Mediterranean Mountain 19 7.5%
are found in floristically rich and diverse regions, with pres-
ence of extreme environmental gradients. Based on the same Orophyte South-European 18 7.0%
studies, there are indications that along with floristic rich- Balkan Anatolia 16 6.2%
ness, the isolation (e.g., mountains, rivers) and environmen- Stenomediterranean 9 3.5%
tal discontinuities are among the main factors that promote Eurimediterranean 9 3.5%
endemism. The highest CI values on our study have gained
 Orophyte South East
high mountainous regions that have climatic, geologic and 8 3.1%
 European
edaphic discontinuities. While lowest CI values were re-

 Fig. 2. Calculation of conservation importance (CI) against the number of endemic and threatened plant taxa in each grid
 square.

58
Fig. 3. Genera with the highest number of endemic and endangered plant taxa in Kosovo.
 Fig. 3. Genera with the highest number of endemic and endangered plant taxa in Kosovo.

 Gentianaceae
Campanulaceae
 Liliaceae
 Dipsacaceae
 Fabaceae
 Violaceae
 Plantaginaceae
 Boraginaceae
 Rosaceae
 Ranunculaceae
 Lamiaceae
 Brassicaceae
Caryophyllaceae
 Asteraceae

 Fig. 4. Families with the highest number of endemic and endangered plant taxa in Kosovo.

 Fig. 4. Families with the highest number of endemic and endangered plant taxa in Kosovo.
 One of the most widely accepted evaluation criteria methodology when comparing the conservation merit of
for threatened and endemic species are IUCN Red lists plant taxa. This approach is not solely based on threat-
(Vermeulen and Koziell, 2002; Martin, 2009) that are ened endemic and endangered plant taxa numbers for each
equally used to identify priority biodiversity areas for con- grid square but also some quantitative values, be it risk
servation (Samways and Grant, 2007). category level and distribution characteristics of the given
 On our work, we present two different evaluation taxa. As a result of this approach, the obtained conserva-
methods. The list method includes only the numbers of tion priorities for the grid squares are different from two
threatened and endemic plant taxa for each grid square. methods. This is especially noticeable in grid squares with
All these plant taxa are seen as equal to each other con- higher CI values; even in grid squares of the same CI val-
cerning their gained values (Cavieres et al., 2002). The ues they seem almost similar to each other. Consequently,
provided information here is rather crude and mostly un- this method allows a rather more effective arrangement of
satisfactory including numbers (Keith, 1998), though they grid squares based on their conservation priorities (Ver-
can be useful for certain comparative analysis. The second meulen and Koziell, 2002; Valente and Vettorazzi,
method (Ordered Weighted Averaging) represents a useful 2008).

 59
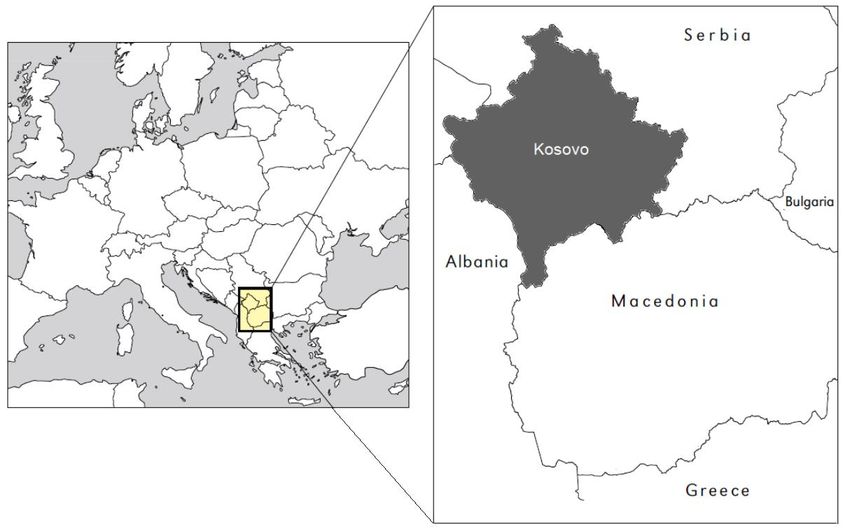
Fig. 5. Map of Kosovo on 20 × 20 km grid squares, indicated by their conservation importance (CI) colours. Black (very high
 CI), dark brown (high CI), grey (medium CI) and white (low CI).
Fig. 5. Map of Kosovo on 20 × 20 km grid squares, indicated by their conservation importance (CI) colours. Black (very high CI), dark brown

 white (low CI).
 Several previous studies (e.g., Stebbins and Major, (Rexhepi, 1982; Millaku, 2013; Millaku et al., 2017;
 1965; Médail and Verlaque, 1997; Wege et al., 2014) Mustafa et al., 2018).
 pointed out that the highest concentration of endemic taxa
 are found in floristically rich and diverse regions, with
 presence of extreme environmental gradients. Based on Conclusions
 the same studies, there are indications that along with flo-
 ristic richness, the isolation (e.g., mountains, rivers) and Environment protection of Kosovo, monitoring and con-
 environmental discontinuities are among the main fac- servation authorities’ objectives lie in carefully analyzing
 tors that promote endemism. The highest CI values on our and determining areas that provide the most important
 study have gained high mountainous regions that have cli- ecosystems and habitats for biodiversity conservation.
 matic, geologic and edaphic discontinuities. While lowest The exact depiction of maximum biodiversity in protected
 CI values were recorded on beech forests and woodlands areas has become recently a key issue of conservation bi-
 of Northern, North-Eastern and Eastern Kosovo. ology in order to avoid any further and potentially non-
 Remarkable floristic diversity with many endemic spe- repairable losses on biodiversity. Plant diversity research
 cies and consequently very high CI values were observed and distribution patterns at the national level are very im-
 in area (grid squares) of ‘Bjeshkët e Nemuna’ National portant steps to identify the priority areas for biodiversity
 Park, including several important mountain ranges (e.g., conservation. Our results can serve as a practical guide for
 Zhleb, Gjeravicë, Maja e Strellcit, Pleçe, Koprivnik and scientific experts and state officials alike that are involved
 Liqenat). Almost equally very high CI values were record- and concerned with conservation issues and related deci-
 ed across the ‘Sharri’ National Park in the south. This area sion making measures in Kosovo.
 covers various mountains, such as Vracë, Kobilicë, Lubo-
 ten, Maja e Zezë, Oshlak, Brod and Koritnik. The high
 conservation importance was also ascribed to Pashtrik Acknowledgements
 Mt. in the SW Kosovo (grid square F5). There is ongoing
 initiative from the Ministry of Environment to establish The authors would like to thank Dr. Ferim Gashi (Depart-
 this region as a Natural Park (Anonymus, 2018) because ment of Geography, University of Prishtina) for his helpful
 its high biodiversity value has been proven several times assistance with the maps. We would like to express our

 60
very great appreciation to Dr. Ferat Rexhepi (Department Hayek, A., 1924–1927. Prodromus florae peninsulae Balca-
of Biology, University of Prishtina) for his valuable and nicae. 1. Band, Pteridophyta, Gymnospermae, Dicotyle-
constructive suggestions during the planning and develop- doneae (Apetalae et Choripetalae). Dahlem bei Berlin:
ment of this research work. The authors would also like Verlag des Repertoriums. 1193 p.
to thank the reviewers for all of their careful, constructive Hayek, A., 1928–1931. Prodromus florae peninsulae Balca-
and insightful comments. nicae. 2. Band, Dicotyledoneae Sympetalae. Dahlem bei
 Berlin: Verlag des Repertoriums. 1152 p.
 Hayek, A., 1932–1933. Prodromus florae peninsulae Balca-
References nicae. 3. Band, Monocotyledoneae. Dahlem bei Berlin:
 Verlag des Repertoriums. 472 p.
 Hundozi, B., 1983. Flora of low meadows of Kosovo. Pro-
Amidžić, L., Krivošej, Z., 1998. High-mountain flora of
 ceedings of the Faculty of Natural Sciences. FNS – Uni-
 Nedzinat and Zuti Kamen (Prokletije Mts.). University
 versity of Prishtina, 9 (1): 235–251.
 Thought, 1 (1): 99–112.
Amidžić, L., Panjković, B., Perić, R., 2013. Chorological Josifović, M. (ed.), 1970–1976. Flora SR Srbije 1–8 [Flora
 analysis of the endemic flora in the Metohijan Prokletije of Serbia 1–8]. Beograd: Srpska akademija nauka i umet-
 Mountains. Archives of Biological Science, Belgrade, 65 nosti. 5417 p.
 (2): 645–650. Josifović, M. (ed.), 1977. Flora SR Srbije 9, dodatak [Flora
Anonymous, 2014. Red list of vascular flora of the Republic of Serbia – supplement]. Beograd: Srpska akademija nau-
 of Kosovo. Prishtina: MESP – KEPA, p. 1– 8. ka i umetnosti. 257 p.
Anonymous, 2018. Professional rationale for taking un- Keith, D.A., 1998. An evaluation and modification of
 der protection the Mt. Pashtrik and Vërmica lake in the World Conservation Union Red list criteria for classi-
 Natural Park / Transboundary Protected Area. Prishtina: fication of extinction risk in vascular plants. Conserva-
 MESP, p. 1–36. tion Biology, 12 (5): 1076–1090. doi: 10.1046/j.1523-
Araùjo, M.B., 2002. Biodiversity hotspots and zones of eco- 1739.1998.97202.x
 logical transition. Conservation Biology,16: 1662–1663. Krasniqi, E., Beqolli-Gashi, A., Rexhepi, F., 2015a. Vascu-
Berisha, N., Millaku, F., Krasniqi, E., Gashi, B., 2014. lar flora of Badovc with its surroundings. International
 Rare and endangered geophyte plant species in serpentine Journal of Ecosystems and Ecology Science, 5 (4): 575–
 of Kosovo. Ecologia Balkanica, 6 (2): 67–74. 580.
Boufford, D.E., Van Dijk, P.P., 1999. South-central China. Krasniqi, E., Millaku, F., Thaqi, L., Avdiu, A., Krasniqi,
 In Mittermeier, R.A., Myers, N., Mittermeier, C.G. H., 2015b. Vascular flora of the Carralluka meadows,
 (eds). Hotspots: Earth’s biologically richest and most Kosovo. International Journal of Ecosystems and Ecol-
 endangered terrestrial ecoregions. Mexico City: Cemex, ogy Science, 5 (4): 581–586.
 p. 339–350. Krasniqi, F., 1998. The features of Kosovo’s flora and veg-
Cavieres, L.A., Arroyo, M.T., Posadas, P., Marticorena, etation and the problem of their protection. Research,
 C., Matthei, O., Rodríguez, R., Squeo, F.A., Arancio, 6. Prishtina: Kosovos Academy of Sciences and Arts,
 G., 2002. Identification of priority areas for conservation p. 51–66.
 in an arid zone: application of parsimony analysis of en- Krasniqi, F., Hundozi, B., Pajazitaj, Q., 1990. A short con-
 demicity in the vascular flora of the Antofagasta region, tribution to the flora of Kosovo. Razprave – SAZU, Lju-
 northern Chile. Biodiversity and Conservation, 11 (7): bljana, 29 (6): 97–104.
 1301–1311. doi: 10.1023/a:1016001714358 Linder, H.P., 2001. Plant diversity and endemism in sub-Sa-
Çavolli, R., 1997. Gjeografia regjionale e Kosovës [Region- haran tropical Africa. Journal of Biogeography, 28: 168–
 al geography of Kosovo]. Prishtina: EMMK. 41 p. 182. https://doi.org/10.1046/j.1365-2699.2001.00527.x
Chang-Le, M., Moseley, R.K., Wen-Yun, C., Zhe-Kun, Z., Martin, J.L., 2009. Are the IUCN standard home-range
 2007. Plant diversity and priority conservation areas of thresholds for species a good indicator to prioritise con-
 north western Yunnan, China. Biodiversity and Conserva- servation urgency in small islands? A case study in the
 tion, 16: 757–774. doi: 10.1007/s10531-005-6199-6 Canary islands (Spain). Journal for Nature Conservation,
Florentine, S.K., Gardner, J., Graz, F.P., Moloney, S., 17 (2): 87–98.
 2013. Plant recruitment and survival as indicators of eco- Médail, F., Verlaque, R., 1997. Ecological characteris-
 logical restoration success in abandoned pasture land in tics and rarity of endemic plants from southeast France
 Nurcoung, Victoria, Australia. Ecological Processes, 2 and Corsica: implications for biodiversity conservation.
 (1): 34. doi:10.1186/2192-1709-2-34 Biological Conservation, 80 (3): 269–281. https://doi.
Freitag, S., Nicholls, A.O., Van Jaarseveld, A.S., 1998. org/10.1016/s0006-3207(96)00055-9
 Dealing with established reserve networks and incom- Millaku, F., Elezaj, I., Berisha, N., 2018. Sympatric area
 plete distribution data sets in conservation planning. and ecology of some Tulipa species in the West Balkan
 South African Journal of Science, 94: 79–86. Peninsula. Thaiszia Journal of Botany, 28 (1): 35–47.
Gärdenfors, U., 2001. Classifying threatened species at Millaku, F., Heiselmayer, P., Rexhepi, F., Krasniqi, E.,
 national versus global levels. Trends in Ecology & Evo- Eichberger, Ch, Haziri, A., 2008. Endemic, stenoen-
 lution, 16 (9): 511–516. https://doi.org/10.1016/s0169- demic and relic plants in serpentines of Kosovo. Sauteria,
 5347(01)02214-5 16: 149–161.
Gavrilović, B., Tomović, G., Niketić, M., Milenković, M., Millaku, F., Krasniqi, E., Berisha, N., Rexhepi, F., 2017.
 Simić, S., Radovanović, M., 2017. Geoecological char- Conservation assessment of the endemic plants from
 acteristics of plant endemism in the Balkan part of Serbia. Kosovo. Hacquetia, 16 (1): 35–47. doi:10.1515/hacq-
 Botanica Serbica, 41 (2): 177–197. 2016-0024

 61
Millaku, F., Rexhepi, F., Krasniqi, E., Pajazitaj, Q., Mala, Stevanović, V., Stevanović, B., 1995. Osnovni klimatski,
 Xh., Berisha, N., 2013. The Red book of vascular flora of geološki i pedološki činioci biodiverziteta kopnenih eko-
 the Republic of Kosovo. Prishtina: MESP. 436 p. sistema Jugoslavije [Basic climatic, geological and pedo-
Mustafa, B., Hajdari, A., Mustafa, V., Pulaj, B., 2018. logical factors of biodiversity of terrestrial ecosystems of
 Natural heritage in the Republic of Kosovo: looking for Yugoslavia]. In Stevanović, V., Vasić, V. (eds). Biodiver-
 potential UNESCO sites. Landscape Online, 63: 1–16. zitet Jugoslavije sa pregledom vrsta od međunarodnog
Myers, N., Mittermeier, R.A., Mittermeier, C.G., da znaćaja. Belgrade: Ecolibri, Biološki fakultet, p. 75–95.
 Fonseca, G.A.B., Kent, J., 2000. Biodiversity hotspots Stevanović, V., Tan, K., Iatrou, G., 2003. Distribution of the
 for conservation priorities. Nature, 403: 853–858. endemic Balkan flora on serpentine I. Obligate serpentine
 doi:10.1038/35002501 endemics. Plant Systematics and Evolution, 242 (1–4):
Pajazitaj, Q., 1985. Contribution to the knowledge on the 149–170. https://doi.org/10.1007/s00606-003-0044-8
 ruderal flora of Kosovo. Nature of Kosova, 1 (1): 69–74. Stevanović, V., Tan, K., Petrova, A., 2007. Mapping the en-
Possingham, H.P., Andelman, S.J., Burgman, M.A., demic flora of the Balkans a progress report. Bocconea,
 Medellín, R.A., Master, L.L., Keith, D.A., 2002. Lim- 21: 131–137.
 its to the use of threatened species lists. Trends in Ecology Stoms, D.M., 2000. GAP management status and regional in-
 & Evolution, 17 (11): 503–507. https://doi.org/10.1016/ dicators of threats to biodiversity. Landscape Ecology, 15:
 s0169-5347(02)02614-9 21–33. https://doi.org/10.1023/a:1008105026956
Ranđelović, V., Zlatković, B., Amidžić, L., 1998. Flora and Tomović, G., Niketić, M., Lakušić, D., Ranđelović, V.,
 vegetation of high-mountain peat bogs of Sharri Moun- Stevanović, V., 2014. Balkan endemic plants in Central
 tains. University Thought, 5 (1): 91–98. Serbia and Kosovo regions: distribution patterns, eco-
Rexhepi, F., 1982. Balkan endemics in the high-mountian logical characteristics, and centres of diversity. Botanical
 flora of Kosovo. Scientific Research Bulletin of FNS, 8: Journal of the Linnean Society, 176 (2): 173–202. https://
 211–219. doi.org/10.1111/boj.12197
Rexhepi, F., 1986. High mountain flora of Kosovo. Prishtina: Tomović, G., Ranđelović, V., Niketić, M., Vukojičić, S.,
 FNMS, University of Prishtina. 349 p. Zlatković, B., 2003. New distribution data of some pon-
Rexhepi, F., 1997. Mediterranean, Submediterranean and Il- tic and submediterranean plant species in Serbia. Archives
 lyric floristic elements in the flora of Kosovo. Bocconea, of Biological Science, Belgrade, 55 (1–2): 45–54.
 5 (2): 451–456. Trousdale, W., Gregory, R., 2004. Property evaluation
Rexhepi, F., 2007. Vegetation of Kosovo (I). Prishtina: FNMS, and biodiversity conservation decision support for mak-
 University of Prishtina. 345 p. ing hard choices. Ecological Economics, 48: 279–291.
Rexhepi, F., Millaku, F., Krasniqi, E., 2005. Endemic plant
 https://doi.org/ 10.1016/j.ecolecon.2003.09.011
 species and vegetation with endemic character in “Sharri”
 Türe, C., Böcük, H., 2010. Distribution patterns of threat-
 National Park, Kosovo. In XVII International Botanical
 ened endemic plants in Turkey: a quantitative approach
 Congress, 12–16 July 2005. Book of Proceedings. Vienna,
 for conservation. Journal for Nature Conservation, 18
 Austria, p. 611–620.
 (4): 296–303. https://doi.org/10.1016/j.jnc.2010.01.002
Rexhepi, F., Millaku, F., Krasniqi, E., 2009. Some species
 Turrill, W.B., 1929. The plant-life of the Balkan Peninsula.
 of Medierranean floristic element in the Albanian Alps of
 A phytogeographical study. Oxford: Clarendon Press.
 Kosovo. Bocconea, 23 (1): 5–11.
 xxiii, 490 p.
Samways, M. Grant, P., 2007. Honing red list assesment of
 Tutin, T.G., Burges, N.A., Valentine, D.H., Walters, S.M.,
 lesser-known taxa in biodiversity hotspots. Biodiversity
 Web, D.A. (eds), 1964–1980. Flora Europaea, 1–5. Cam-
 and Conservation, 16: 2575–2586.
 bridge: Cambridge University Press. 2246 p.
Sarić, M., Diklić, N. (eds), 1986. Flora SR Srbije 10. Do-
 Tzedakis, P.C., Lawson, I.T., Frogley, M.R., Hewitt, G.M.,
 datak (2) [Flora of Serbia 10 – supplement (2)]. Srpska
 Preece, R.C., 2002. Buffered tree population changes in
 akademija nauka i umetnosti, Beograd. 401 p.
Stebbins, G. L. Major, J., 1965. Endemism and speciation in a Quaternary refugium: evolutionary implications. Sci-
 the Californian flora. Ecological Monographs, 35: 1–35. ence, 297: 2044–2047.
Stevanović, V., 1996. Analysis of the Central European and Ukaj, Sh., Millaku, F., Krasniqi, E., Rexhepi, F., Shala, A.,
 Mediterranean orophytic element on the mountain of the 2012. Magnoliatae (Dicotyledones) without Asteraceae
 W. and Central Balkan Peninsula, with special reference on the Studenica Peak - Kosovo. International Journal of
 to endemics. Bocconea, 5: 77–97. Ecosystems and Ecology Science, 2 (3): 181–186.
Stevanović, V. (ed), 1999. The Red Data book of the flora Valente, R.D.O.A., Vettorazzi, C.A., 2008. Definition of
 of Serbia 1. Extinct and critically endangered taxa. Bel- priority areas for forest conservation through the ordered
 grade: Ministry of Environment of the Republic of Serbia, weighted averaging method. Forest Ecology and Man-
 Faculty of Biology, University of Belgrade, Institute for agement, 256 (6): 1408–1417. https://doi.org/10.1016/j.
 Protection of Nature of the Republic of Serbia. 566 p. foreco.2008.07.006
Stevanović, V., Jovanović, S., Lakušić, D., Niketić, M., Vermeulen, S., Koziell, I., 2002. Integrating global and lo-
 1999. Characteristics of the flora of Serbia and its phy- cal values: a review of biodiversity assessment. London,
 togeographical division. In Stevanović, V. (ed). The Red UK: International Institute for Environment and Develop-
 data book of the flora of Serbia 1. Extinct and critically ment. 104 p.
 endangered taxa. Belgrade: Ministry of Environment of Warman, L., Sinclair, A., 2000. A systematic method for
 the Republic of Serbia, Faculty of Biology, University of identifying priority conservation areas using wildlife
 Belgrade, Institute for Protection of Nature of the Repub- habitat relationships and observed locations of rare spe-
 lic of Serbia, p. 393–399. cies. In Hollstedt, C., Sutherland, K., Innes, T. (eds).

62
From science to management and back: a science forum known flora. Biodiversity and Conservation, 24 (1): 17–
 for southern interior ecosystems of British Columbia. Ka- 32. https://doi.org/ 10.1007/s10531-014-0785-4
 mloops, BC: Southern Interior Forest Extension and Re- Whittaker, R.J., Araújo, M.B., Jepson, P., Ladle, R.J., Wat-
 search Partnership, p. 141–144. son, J.E., Willis, K.J., 2005. Conservation biogeography:
 assessment and prospect. Diversity and Distributions, 11
Wege, J.A., Thiele, K.R., Shepherd, K.A., Butcher, R.,
 (1): 3–23. doi:10.1111/j.1366-9516.2005.00143.x
 Macfarlane, T.D., Coates, D.J., 2014. Strategic tax-
 onomy in a biodiverse landscape: a novel approach to Received December 6, 2019
 maximizing conservation outcomes for rare and poorly Accepted March 29, 2020

 63
You can also read