Integrated Resource Plan Public Advisory Meeting #3 - August 16, 2016 - DSM appendix slides - real $ noted Added slides 50 - AES Indiana
←
→
Page content transcription
If your browser does not render page correctly, please read the page content below
•   DSM appendix slides - real $ noted
     •   Added slides 50 - 56

 Integrated Resource Plan
Public Advisory Meeting #3
            August 16, 2016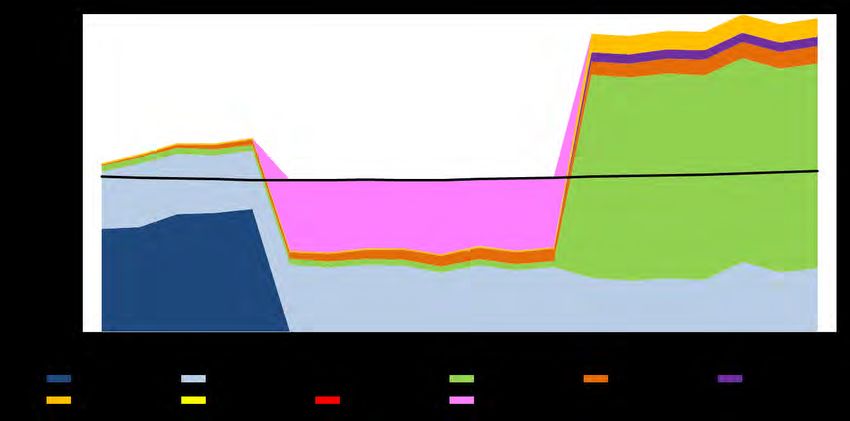
Welcome & Safety Message
    Bill Henley, VP of Regulatory and Government Affairs

2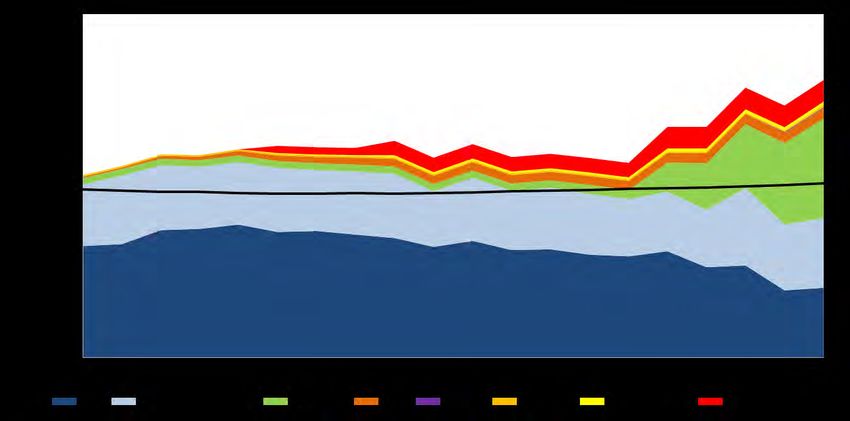
Meeting Guidelines
    Joan Soller, Director of Resource Planning

3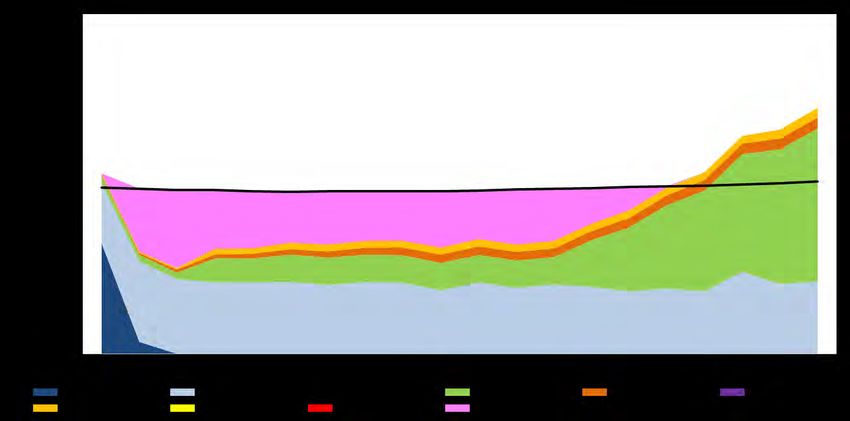
Agenda for today
    9:30am Welcome
            Meeting Agenda and Guidelines
            Summary & Feedback from IRP Public Advisory Meeting #2

    9:45am IRP modeling update
            Updates to modeling
            Draft model results for all scenarios

    10:30am Stakeholder Feedback

    10:45am Sensitivity analysis setup

    11:30am Conclusion

4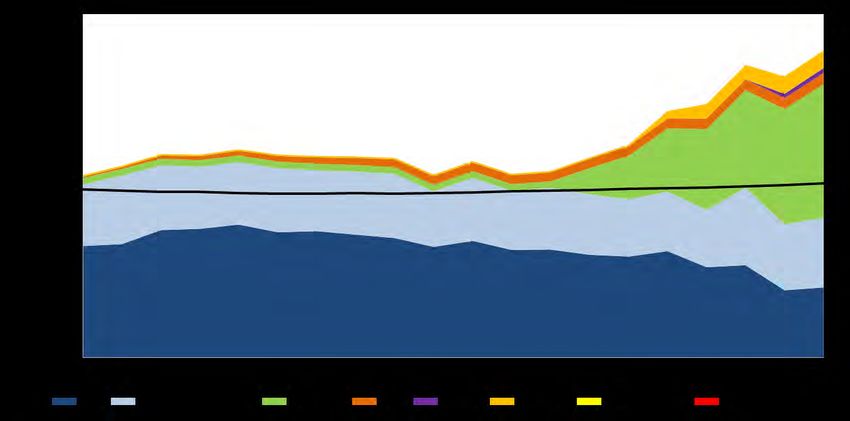
Meeting Guidelines
    • Time for clarifying questions at end of each presentation
    • Small group discussions
    • Three ways to participate remotely:
      – The phone line will be muted. Press *6 to un-mute your line, and
        please remember to press *6 again to re-mute when you are
        finished asking your question.

      – Use WebEx online tool for questions during meeting

      – Email additional questions or comments to ipl.irp@aes.com

    • All may email questions/comments by August 23 for IPL
      to respond via website by September 6

5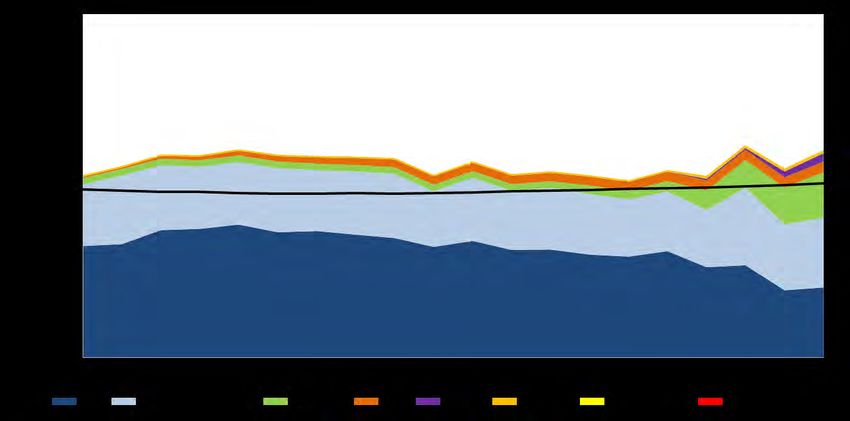
Active cases before
            the commission
    •   Cause   No.   42170,   ECR-26
    •   Cause   No.   44121,   Green Power (GPR 9)
    •   Cause   No.   43623,   DSM 13
    •   Cause   No.   44576,   Rates (under appeal)
    •   Cause   No.   44792,   DSM 2017 Plan
    •   Cause   No.   44794,   SO2 NAAQS and CCR
    •   Cause   No.   44795,   Capacity and Off System Sales Riders

6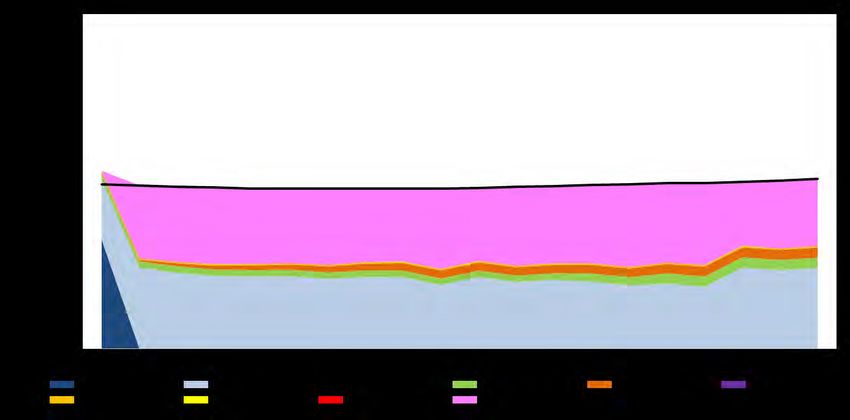
Summary & Feedback from IRP
    Public Advisory Meeting #2
    Joan Soller, Director of Resource Planning

7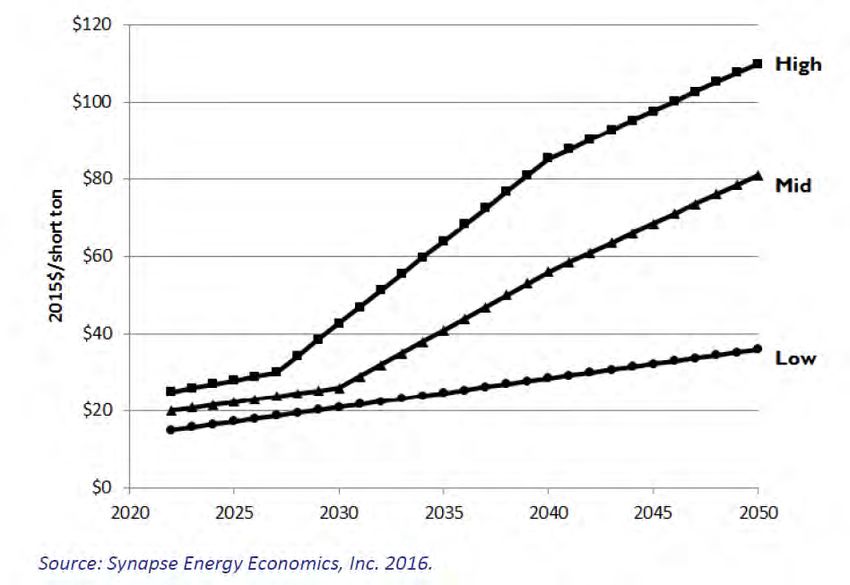
Topics covered in Meeting #2
    •   Stakeholder presentations
    •   Portfolio Comparison based on Metrics
    •   Transmission & Distribution
    •   Load Forecast
    •   Environmental Risks
    •   Portfolio and Metrics Exercises
    •   Draft base case results

    • Presentation materials, audio recording, acronym list, and
      meeting notes are available on IPL’s IRP webpage here:
      https://www.iplpower.com/irp/
8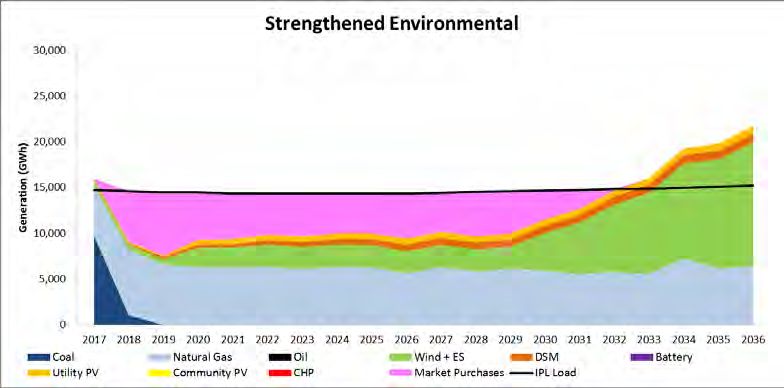
Stakeholder interaction continues

    • Since the June meeting, IPL has reached out to
      the following stakeholders:
      –   Citizens Energy
      –   Hoosier Interfaith Power & Light (HIPL)
      –   IPL Advisory Board
      –   National Association for the Advancement of Colored
          People (NAACP)

9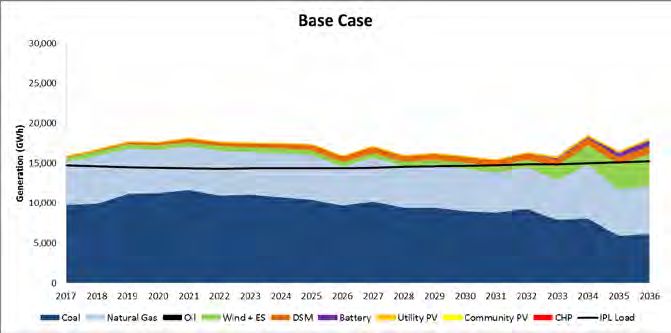
Stakeholder portfolio exercise
     feedback
                                 Potential IPL     Range of
                     Resource   2034 Portfolio   Stakeholder
                                  June 2016       Preferred
                                                   Capacity
                                                 Percentage
               Coal                 32%           0 – 30%
               Natural Gas          31%           0 – 35%
               Battery              18%           5 – 18%
               Wind                  9%           9 – 30%
               DSM                   7%           7 – 20%
               Solar                 3%           6 – 30%
               Oil                   0%           0 – 10%

10
Stakeholder metrics exercise
feedback
Metrics Scores
Air quality* 10
PVRR 10
CO2 intensity 8
Planning reserves 7
Rate impact in 5 year increment 6
CO2 emissions over time 5
Cost variance risk ratio 5
Annual average CO2 emissions 3
Flexibility - Quick start vs. peak
3
load
Bill impact / energy burden 2
Flexibility - Portfolio diversity
2
(fuel)
Resource mix over time 2
Social Equity 2
green = stakeholder proposed
blue= IPL proposed
*other pollutants including PM, NOx,
SO2, methane emissions
11Questions? 12
IRP Modeling Update
     Joan Soller, Director of Resource Planning

13
Base case has evolved
since last meeting
• Incorporated NERC standards voltage
stability requirements
– Minimum 450 MW baseload on 138 kV in addition to EV
CCGT
• Adjusted battery capacity credit to 25% to represent 4
hour energy output durations
• Added wind parameters
– Capacity credit in 2022 as a proxy for expected
transmission expansion
– Frequency response (via energy storage) per proposed
order in FERC docket RM 16-6 and reactive power (via
quick capacitors) provisions per recent FERC Order 827
– Limit 250 MW per year and total of 1000 MW to mirror
minimum loads
14Base case comparison
Initial Base Case Final Base Case
(June 2016) (Aug 2016)
*Wind resources are paired with Energy Storage (ES) in anticipation of proposed FERC rule for frequency
response.
15IPL created a Quick Transition Scenario to
reflect Stakeholder feedback
Inputs:
• All coal units retire by 2030
• Retain minimum NG on local 138
kV system to meet NERC
standards
• Adopt maximum achievable DSM
• Balance comprised of solar, wind
and storage
*Wind resources are paired with Energy Storage (ES) in anticipation of proposed FERC rule for
frequency response.
16Summary of scenarios
1. Base Case
2. Robust Economy
3. Recession Economy
4. Strengthened Environmental
Rules
5. High Adoption of Distributed
Generation
6. Quick Transition
1
17Scenario Characteristics/Variable Drivers
Scenario Name Load Forecast Natural Gas Clean Distributed
and Market Power Plan Generation
Prices (CPP) and (DG)
Environment
1 Base Case Use current load ABB Mass-based Mass-based CPP Expected moderate
growth methodology CPP Scenario starting in 2022. decreases in
Low cost technology costs for
environmental wind, storage, and
regulations: ozone, solar
316b, NSR, and CCR
2 Robust Economy High* High* Base Case Base Case
3 Recession Low* Low* Base Case Base Case
Economy
4 Strengthened Base Case Base Case 20% RPS + high Base Case
Environmental carbon costs. High
Rules costs: NAAQS ozone,
316b, OSM, NSR*
5 Distributed Base Case Base Case Base Case Base case with fixed
Generation additions of 150
MW in 2022, 2025,
*Purple
and 2032*
font
6 Quick Transition Base Case Base Case Base Case Fixed portfolio to
indicates
retire coal, add max
changes.
DSM, minimum
baseload (NG), plus
18 solar, wind andScenarios produce varied expansion
plans
MW
*Wind resources are paired with Energy Storage (ES) in anticipation of proposed FERC rule for frequency
response.
19Scenario observations
Base Case Assumes existing units operate through their estimated
useful life.
Robust Economy Load increased by ~370 MW with higher NG prices.
Recession Load decreased by ~300 MW, lower NG, includes Pete 1-
Economy 4 refuel early.
Strengthened Higher costs for CO2, 316 b, NAAQS ozone, OSM, and
Environmental NSR. Includes P1 retirement, P2-4 refuel.
Distributed Customers choose DG for reasons other than economics
Generation totaling ~450 MW or ~15% of IPL load.
Quick Transition Asset additions are "lumpy“ in 2030 when there is an
inflection point in Clean Power Plan compliance. The
Maximum Achievable Potential DSM was added.
2
20Planning capacity provides
resource adequacy in MISO
MW
*Wind resources are paired with Energy Storage (ES) in anticipation of proposed FERC rule for frequency response.
21Planning capacity for renewables is
lower than operating capacity
MW
MW
*Wind resources are paired with Energy Storage (ES) in anticipation of proposed FERC rule for frequency response.
22DSM varies by scenario
Incremental DSM 2017-2036
250,000
Final Base Case
200,000
Robust Economy
150,000 Recession Economy
MWh
Strengthened
Environmental Rules
100,000 Distributed Generation
Quick Transition
50,000
-
2017
2018
2019
2020
2021
2022
2023
2024
2025
2026
2027
2028
2029
2030
2031
2032
2033
2034
2035
2036
23Costs are shown as Present Value
Revenue Requirement (PVRR)
2017 - 2036
20 Year PVRR 2016 IRP
$14,000 4,000
$13,000 3,500
$12,000 3,000
$M $11,000 2,500 MW
$10,000 2,000
$9,000 1,500
$8,000 1,000
$7,000 500
$6,000 0
Base Robust Econ Recession Streng Enviro Adoption of Quick
Econ DG Transition
DG Costs Peak Load (MW)
*Light blue DG costs are estimated for 450 MW. Customer DG costs will vary.
24Questions? 25
Sensitivity Analysis Setup
     Patrick Maguire
     Director, Corporate Planning & Analysis

26
Sensitivity analysis plan
• Two deterministic carbon sensitivities for
the base case
– Delayed CPP from 2022 to 2030
– High carbon cost for CPP
• Stochastic modeling for all portfolios
– Multiple inputs varied in each model run
• Examples: Load (peak and energy), commodity
prices, carbon prices, capital costs, forced outage
rates
27IRP modeling process
Production
Deterministic Cost Model Stochastic Stochastic
Capacity Run with Base Parameter Modeling and
Expansion Assumptions Setup Risk Analysis
Model for All
Portfolios
Complete Complete In Progress In Progress
28Two modeling approaches
Deterministic Model Stochastic Model
Scenario Scenario
CapEx Resource CapEx Resource
Plan Plan
Capital Example:
Cost
EFOR
10 variables
X 10 draws
Sensitivity a Sensitivity b Load
100 iterations for
each portfolio
e.g. NG ↑ e.g. NG ↓ Gas Price
NG ↑+ Load ↑ NG ↓+ Load ↓ Coal Price
CO2 Price
29Why model stochastically?
Deterministic Model Stochastic Model
Advantages Advantages
• Easy to administer with no • More robust accounting for
formal probability calculations interrelatedness and
• Can be comprehensive with the correlation between variables
right amount and combination • Well-established statistical
of variables principles and common use
guide the setup
Shortcomings Shortcomings
• More qualitative setup, e.g. • Difficult to perform and
variables changed by user- consolidate statistical
defined known and fixed probability data and
amounts correlations
• Difficult to capture correlations • All variable iterations fed into
between variables Integrated Model to generate
power prices => significantly
higher amount of model
simulation time
30Parameter setup
Define the P(x) P(x) P(x)
distribution
1 Account for specific variable
Determine characteristics:
Cumulative F(x)
• Random Walking
Distribution 0
X • Mean Reversion
• Seasonality
• Skewness
Pick a random • Kurtosis
number
1.000
0.900
1.037
0.800 0.980
Use random
0.700
0.600 0.952
number to get 0.500
0.400 1.005
to multiplier 0.300
0.200 1.002
0.100
0.000
1.013
0.800 0.840 0.880 0.920 0.960 1.000 1.040 1.080 1.120 1.160 1.200
1.003
31Stochastic Parameter: Gas
1.5
1.4
Well established market 1.3
1.2
with extensive historical
Multipliers
1.1
data 1
0.9
0.8
Histogram of Historical Henry Hub 0.7
0.6
Spot Prices, 2005 - 2016 Years 1-5 Years 6-10 Years 11-15 Years 16-20
30%
25%
20%
Percent
15%
10%
5%
0%
1 2 3 4 5 6 7 8 9 10 11 12 13 14 15 16 0.50 0.60 0.70 0.80 0.90 1.00 1.10 1.20 1.30 1.40 1.50 1.60 1.70
Multiplier
Bin ($/MMBtu)
Distribution Mean
32Stochastic Parameter: CO2
Lack of historical pricing
complicates variable setup CO2 Forecast Range
140
120
Synapse forecasts guided the 100
CO2 Cost ($/ton)
range of outcomes 80
60
40
20
0
2017 2021 2025 2029 2033
Minimum 20th Percentile 50th Percentile
80th Percentile Maximum Nominal $
Real $
33Use of Stochastic Parameters
ILLUSTRATIVE PURPOSES ONLY
Variable Multipliers PVRR ($ in Billions)
Draw Gas Price Coal Price Demand etc. Draw Power Price Draw Portfolio 1 Portfolio 2 Portfolio 3
1 1.10 1.00 1.15 … 1 $40.50 1 $9.6 $10.8 $10.4
Fundamental
2 1.18 1.06 1.01 … 2 $37.97 2 $10.1 $10.6 $7.7
Forecasts
3 1.15 1.08 1.14 … 3 $51.53 3 $10.9 $12.2 $8.6
4 0.97 0.97 1.03 … 4 $31.25 4 $8.7 $9.4 $10.6
5 1.06 1.04 1.08 … 5 $37.35 5 $9.2 $12.8 $7.6
6 1.04 0.98 1.11 … 6 $36.09 6 $8.4 $10.8 $9.7
7 1.07 0.95 1.11 … 7 $35.60 7 $10.3 $12.4 $10.9
8 1.09 1.07 0.95 … Market 8 $34.20 Strategic 8 $11.2 $11.1 $8.9
9 1.10 1.00 1.00 … Price 9 $34.09 Planning 9 $7.9 $8.3 $10.0
10 1.06 1.07 0.99 … Model 10 $35.22 Model 10 $8.8 $12.5 $8.6
11 0.97 1.04 1.15 … 11 $36.99 11 $7.9 $9.8 $11.4
12 1.15 1.08 0.97 … 12 $37.36 12 $11.9 $9.0 $9.1
13 1.15 1.01 1.14 … 13 $41.81 13 $9.5 $11.9 $9.5
14 1.01 1.04 1.10 … 14 $36.73 14 $7.5 $8.1 $8.5
15 1.18 1.03 1.10 … 15 $41.87 15 $11.0 $12.2 $11.4
34Model Results and Application
Stochastic results ILLUSTRATIVE PURPOSES ONLY
will guide the
PVRR Results
formation of the 25th - 75th Percentile Range Median
metrics 20
Billions
18
• Provides a 16
range of results 14
12
(PVRR, carbon 10
emissions, etc.)
8
6
across all 4
2
iterations 0
Portfolio 1 Portfolio 2 Portfolio 3 Portfolio 4 Portfolio 5 Portfolio 6
35Questions? 36
Next Steps
     Joan Soller, Director of Resource Planning

37
Written comments and feedback
• Deadline to send written comments and
questions regarding this meeting to
ipl.irp@aes.com is Tuesday, August 23
• All IPL responses will be posted on the IPL IRP
website by Tuesday, September 6
38Final 2016 IPL IRP Public
Advisory Meeting
Friday, September 16, 2016
• Final model results
• Sensitivity analyses results
• Preferred Resource Plan
• Short-term Action Plan
39Thank you! We value your input and appreciate your participation. Please submit your feedback form and recycle your nametag at the registration table as you leave the meeting today.
APPENDIX – DSM DETAILS

41
Base case

42
Robust economy

43
Recession economy

44
Adoption of distributed
     generation

45
Strengthened environmental 46
Quick transition

47
DSM building blocks selected
                      (based upon maximum achievable)

                                       Final Base    Robust   Recession   Strengthened    Distributed
         DSM Blocks Selected              Case      Economy   Economy     Environmental   Generation
 Res Other up to $30MWh 2018-2020          X          X          X             X              X
 Res Other $30-60MWh 2018-2020                        X                        X
 Res Lighting up to $30MWh 2018-2020       X          X          X             X              X
 Res HVAC up to $30MWh 2018-2020           X          X          X             X              X
 Res Behavioral Program 2018-2020                     X          X             X
 Bus Other up to $30MWh 2018-2020          X          X          X             X              X
 Bus Lighting up to $30MWh 2018-2020       X          X          X             X              X
 Bus HVAC up to $30MWh 2018-2020           X          X          X             X              X
 Res Other up to $30MWh 2021+              X          X          X             X              X
 Res Lighting up to $30MWh 2021+           X          X          X             X              X
 Res HVAC up to $30MWh 2021+                          X                        X
 Res Behavioral Programs 2021+             X          X          X             X              X
 Bus Process up to $30MWh 2021+            X          X          X             X              X
 Bus Other up to $30MWh 2021+              X          X          X             X              X
 Bus Lighting up to $30MWh 2021+           X          X          X             X              X

48
Quick Transition DSM
DSM Blocks 2018-2020 2021-2037
EE Res Other (up to $30/MWh) X X
EE Res Other ($60+ /MWh) X X
EE Res Other ($30-60/MWh) X X
EE Res Lighting (up to $30/MWh) X X
EE Res HVAC (up to $30/MWh) X X
EE Res HVAC ($60+ /MWh) X X
EE Res HVAC ($30-60/MWh) X X
EE Res Behavioral Programs X X
EE Bus Process (up to $30/MWh) X X
EE Bus Process ($30-60/MWh) X X
EE Bus Other (up to $30/MWh) X X
EE Bus Other ($60+ /MWh) X X
EE Bus Other ($30-60/MWh) X X
EE Bus Lighting (up to $30/MWh) X X
EE Bus Lighting ($60+ /MWh) X X
EE Bus Lighting ($30-60/MWh) X X
EE Bus HVAC (up to $30/MWh) X X
EE Bus HVAC ($60+ /MWh) X X
EE Bus HVAC ($30-60/MWh) X X
DR Water Heating DLC X X
DR Smart Thermostats X X
DR Emerging Tech X X
DR Curtail Agreements X X
DR Battery Storage X X
DR Air Conditioning Load Mgmt X X
49APPENDIX II– ENERGY MIX BY SCENARIO 50
How to Read Energy Mix Slides
     •   “Long”= more generation in a single hour than load
          “Short”= more load in a single hour than generation
     •   IPL is long and short throughout the year at different times

     These graphs will be shared again and discussed at the final public advisory meeting.

              Long on energy more than short (selling to the market)

         Short on energy more than long (buying from the market)

                                                                       •   Based on the nature of dispatching
                                                                            units, IPL will still buy and sell
                                                                            from the market in the base case

51
Base Case Energy 52
Robust Economy Energy

53
Recession Economy Energy

54
Strengthened Environmental
     Energy

55
High Customer Adoption of DG
Energy
56Final Quick Transition
Energy
57You can also read