INTERACTIVE SARS-COV-2 MUTATION TIMEMAPS VERSION 1; PEER REVIEW: AWAITING PEER REVIEW
←
→
Page content transcription
If your browser does not render page correctly, please read the page content below
F1000Research 2021, 10:68 Last updated: 24 FEB 2021

BRIEF REPORT

Interactive SARS-CoV-2 mutation timemaps [version 1; peer
review: awaiting peer review]
René L. Warren, Inanc Birol
Genome Sciences Centre, BC Cancer Agency, Vancouver, British Columbia, V5Z 4S6, Canada

v1   First published: 03 Feb 2021, 10:68                                     Open Peer Review
     https://doi.org/10.12688/f1000research.50857.1
     Latest published: 03 Feb 2021, 10:68
     https://doi.org/10.12688/f1000research.50857.1                          Reviewer Status AWAITING PEER REVIEW

                                                                             Any reports and responses or comments on the

Abstract                                                                     article can be found at the end of the article.
As the year 2020 came to a close, several new strains have been
reported of the severe acute respiratory syndrome coronavirus 2
(SARS-CoV-2), the agent responsible for the coronavirus disease 2019
(COVID-19) pandemic that has afflicted us all this past year. However,
it is difficult to comprehend the scale, in sequence space,
geographical location and time, at which SARS-CoV-2 mutates and
evolves in its human hosts. To get an appreciation for the rapid
evolution of the coronavirus, we built interactive scalable vector
graphics maps that show daily nucleotide variations in genomes from
the six most populated continents compared to that of the initial,
ground-zero SARS-CoV-2 isolate sequenced at the beginning of the
year.
Availability: The tool used to perform the reported mutation analysis
results, ntEdit, is available from GitHub. Genome mutation reports are
available for download from BCGSC. Mutation time maps are available
from https://bcgsc.github.io/SARS2/.

Keywords
SARS-CoV-2, COVID-19, Mutation time maps, GISAID, Interactive SVG

               This article is included in the Disease Outbreaks
               gateway.

               This article is included in the Coronavirus
               collection.

                                                                                                                        Page 1 of 7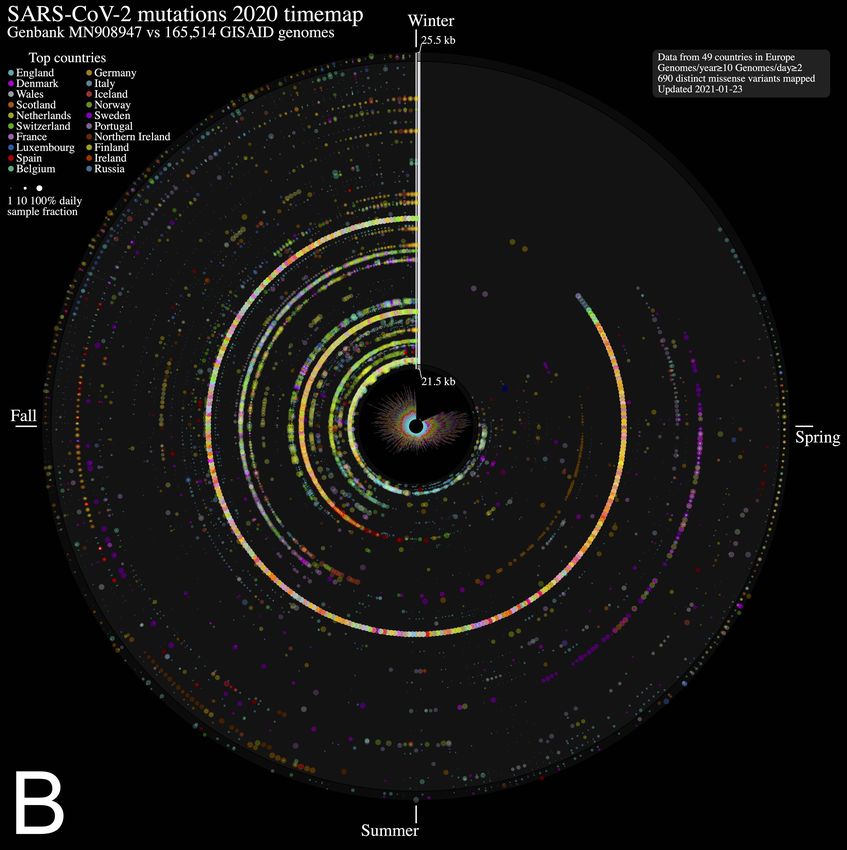
F1000Research 2021, 10:68 Last updated: 24 FEB 2021

Corresponding author: René L. Warren (rwarren@bcgsc.ca)
Author roles: Warren RL: Conceptualization, Formal Analysis, Resources, Software, Visualization, Writing – Original Draft Preparation;
Birol I: Funding Acquisition, Writing – Review & Editing
Competing interests: No competing interests were disclosed.
Grant information: This work was supported by Genome BC and Genome Canada [281ANV]; and the National Institutes of Health
[2R01HG007182-04A1]. The content of this paper is solely the responsibility of the authors and does not necessarily represent the official
views of the National Institutes of Health or other funding organizations.
The funders had no role in study design, data collection and analysis, decision to publish, or preparation of the manuscript.
Copyright: © 2021 Warren RL and Birol I. This is an open access article distributed under the terms of the Creative Commons Attribution
License, which permits unrestricted use, distribution, and reproduction in any medium, provided the original work is properly cited.
How to cite this article: Warren RL and Birol I. Interactive SARS-CoV-2 mutation timemaps [version 1; peer review: awaiting peer
review] F1000Research 2021, 10:68 https://doi.org/10.12688/f1000research.50857.1
First published: 03 Feb 2021, 10:68 https://doi.org/10.12688/f1000research.50857.1

                                                                                                                                  Page 2 of 7
F1000Research 2021, 10:68 Last updated: 24 FEB 2021
Introduction
In the last few weeks of 2020, new severe acute respiratory syndrome coronavirus 2 (SARS-CoV-2) mutations in the
United Kingdom (UK) were reported1. Although coronavirus genome mutations have been previously discovered and
announced throughout the year, including the widely discussed D614G missense change in the spike protein2,3, the latest
recurring surface protein mutations to be identified (e.g. N501Y, P681H) are cause for concern. The SARS-CoV-2 viral S
gene encodes a surface glycoprotein, which upon interaction with host ACE-2 receptors, makes it possible for the
coronavirus to gain entry to host cells and propagate. The reported changes to its sequence may be associated with
increased virulence4, infectivity3 and overall fitness5. The global response to those recent reports has been swift, with
several countries shutting down air travel from the UK. This highlights the severity of the situation and the importance to
track genomic variations and their predicted effects over time and space.
The rapid evolution of the SARS-CoV-2 genome in human hosts has prompted us to map all nucleotide changes that have
appeared in 2020, since the first genome sequence of a COVID-19 patient isolate from the outbreak epicentre in Wuhan,
China was made public6. For this, we leveraged the collaborative efforts of hundreds of institutions worldwide who have
graciously shared over 260,000 SARS-CoV-2 genome sequences with the GISAID central repository since early January
20207. Our mutation time maps show the staggering number of nucleotide variants that have accumulated on the whole
viral genome throughout the year, and especially since fall 2020, and in the six most populated continents. Here we
present key features of these maps and how they may be of utility to researchers.
Methods
We first downloaded all complete, high-coverage SARS- CoV-2 genomes from GISAID7 on January 23rd, 2021 (human
hosts samples collected). We then ran a genome polishing pipeline, which consists of ntHits8 (v0.1.0 -b 36 -outbloom -c
1 -p seq -k 25) followed by ntEdit9 (v1.3.4 -i 5 -d 5 -m 1 -r seq_k25.bf) and required at most 0.5 GB RAM and executed in
~1 sec. per genome on a single CPU. We used the first published SARS-CoV-2 genome isolate6 (WH- Human
1 coronavirus, GenBank accession: MN908947.3) as the reference and each individual GISAID genome in turn as
source of kmers to identify base variation relative to the former. The variant call format (VCF) output files from ntEdit
were parsed and we tallied, for each submitted GISAID genome, the complete list of nucleotide variations. We next
organized each nucleotide variant by sample collection date, continent of origin and, when applicable, evaluated its effect
on the gene product that harbours the change to output an interactive scalable vector graphics (SVG) file. The script we
developed to generate the maps is written in PERL and distributed under GPLv3. Users wishing to generate custom maps
can download the script from Zenodo10.
Results and discussion
We analyzed nucleotide variations over time in over 260,000 SARS-CoV-2 viral genomes, submitted to the GISAID
initiative7 from around the globe, relative to that of the ground zero COVID-19 clinical isolate6. We mapped each
mutation that was observed in five or more genomes each day. The 2020 calendar year from January 1st 2020 (day 1) to
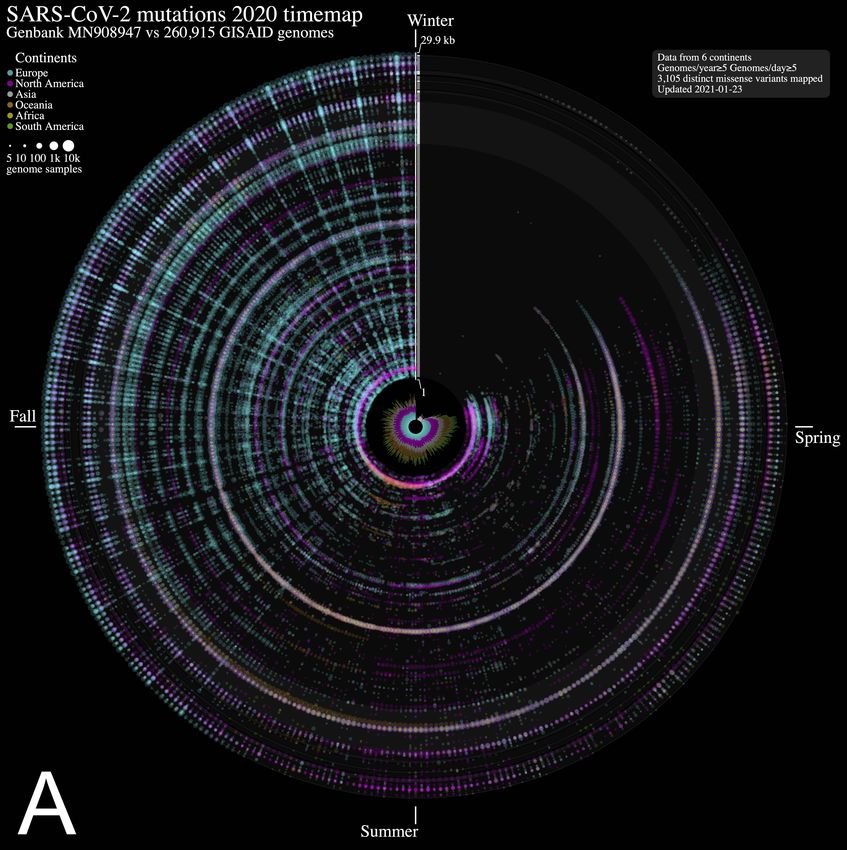
December 31st 2020 (day 366) is organized in a circle where each radius represents a day (1 day = 0.98 degree) and data
points represent mutations along the reference genome sequence from 1 (closest to center) to 29,903 bp (near the outer
rim). The size of each point is in log10 scale of the number of contributing viral genomes collected on that day that has the
mutation, with colour assignments indicating the continent of origin where the mutation is observed. A mouse over each
data point reveals the collection date, the nucleotide variant, the continent and associated number of contributing genome
sequences (including daily sample fraction) and, when applicable, the gene product and predicted amino acid change.
From the SARS-CoV-2 genome mutation time map (Figure 1A), we observe the first persistent mutations (≥5 genomes/
day) appearing in late February 2020, including the prevalent D614G mutation in Europe on February 22nd (albeit since
January in fewer samples, Figure 1B). From there, the original coronavirus genome sustained many changes overtime
(5,468 distinct variants mapped in 2020 as of January 23rd, 2021), including a sizeable proportion (56.8 %) of missense
mutations. It is immediately evident from Figure 1A that variations from Europe account for a larger share (71.2%) of the
variants mapped. Further, there appears to be a surge in variations identified in late summer/throughout fall 2020 in this
continent. This may be explained by a disproportionate number of submissions with samples originating from this
jurisdiction as the second wave hit hard. Thus, caution in interpreting the map is warranted. Of note, the spike protein gene
variant N501Y, observed on our maps in the UK in late September 2020 (Figure 1), is consistent with an earlier study
reporting on its recurrent emergence within this time frame1. We think these maps will be of utility to researchers in their
exploration of SARS-CoV-2 mutations and their predicted effect over time.
Page 3 of 7F1000Research 2021, 10:68 Last updated: 24 FEB 2021
Figure 1. Severe acute respiratory syndrome coronavirus 2 (SARS-CoV-2) evolution in human hosts. ntEdit was
used to map nucleotide variations between the first published coronavirus isolate from Wuhan, China in early
January and over 260,000 SARS-CoV-2 genomes sampled from around the globe during the 2020 coronavirus disease
2019 (COVID-19) pandemic. The maps show missense mutations arising daily (A) in the world within the whole viral
genome, with the reference genome represented by the vertical axis from bases 1 to 29.9 kbp and (B) in Europe
within the spike protein gene. Alternating dark/light grey vertical rectangles and associated tracks depict, starting
from the center, SARS-CoV-2 genes ORF1AB, S, ORF3A, E, M, ORF6, ORF7A, ORF8, N, and ORF10. Mutations identified daily
are represented by circles in a given radius and are coloured by regions and sized relative to raw count (panel A) or
ratio (panel B) of the daily samples. A stacked bar plot (center) shows sample count. The 2020 calendar year
mutations are organized clockwise from the upper vertical. Hovering the mouse cursor over each data point reveals
additional insights (not shown).
Data availability
Source data
The SARS-CoV-2 genome sequences can be accessed via the GISAID central repository. Processed single nucleotide
variant (SNV) data is available from https://www.bcgsc.ca/downloads/btl/SARS-CoV-2/mutations/.
Page 4 of 7F1000Research 2021, 10:68 Last updated: 24 FEB 2021
Figure 1. (continued)
Maps availability
- Maps are available from: https://bcgsc.github.io/SARS2
- SNV detection source code is available from: https://github.com/bcgsc/ntedit
- Archived source code at time of publication: https://doi.org/10.5281/zenodo.446984010
Data are available under the terms of the Creative Commons Attribution 4.0 International license (CC-BY 4.0).
Author contributions
Study design: RLW. Analysis: RLW. Both authors wrote the manuscript.
Acknowledgements
We acknowledge Cecilia (Lingyu) Yang for her early work on SARS-CoV-2 variants.
Page 5 of 7F1000Research 2021, 10:68 Last updated: 24 FEB 2021
References
1. Rambaut A, et al. : Preliminary genomic characterisation of an 6. Wu F, et al.: A new coronavirus associated with
emergent SARS-CoV-2 lineage in the UK defined by a novel set of human respiratory disease in China. Nature 2020;
spike mutations. Virological 2020. 579: 265–269.
Reference Source PubMed Abstract|Publisher Full Text|Free Full Text
2. Dey T, et al. : Identification and computational analysis of 7. re3data.org: GISAID; editing status. re3data.org - Registry of
mutations in SARS-CoV-2. Comput Biol Med 2021; 129: 104166. Research Data Repositories. 2020-02-03.
PubMed Abstract|Publisher Full Text|Free Full Text Publisher Full Text
3. Korber B, et al.: Tracking changes in SARS- CoV-2 spike: evidence 8. Mohamadi H, et al.: ntHits: de novo repeat identification of
that D614G increases infectivity of the COVID-19 virus. Cell 2020; genomics data using a streaming approach. BioRxiv 2020.
182: 812–827. Publisher Full Text
PubMed Abstract|Publisher Full Text|Free Full Text 9. Warren RL, et al.: ntEdit: scalable genome sequence polishing
4. Gu H, et al.: Adaptation of SARS-CoV-2 in BALB/c Mice for Testing Bioinformatics 2019; 35: 4430–4432.
Vaccine Efficacy Science 2020; 369: 1603–1607. PubMed Abstract|Publisher Full Text|Free Full Text
PubMed Abstract|Publisher Full Text|Free Full Text 10. Warren R, Birol I: Interactive SARS-CoV-2 mutation timemaps
5. Plante JA, et al.: Spike mutation D614G alters SARS-CoV-2 fitness. (Version v1.1). Zenodo 2021, January 26.
Nature 2020. Publisher Full Text
PubMed Abstract|Publisher Full Text
Page 6 of 7F1000Research 2021, 10:68 Last updated: 24 FEB 2021
The benefits of publishing with F1000Research:
• Your article is published within days, with no editorial bias
• You can publish traditional articles, null/negative results, case reports, data notes and more
• The peer review process is transparent and collaborative
• Your article is indexed in PubMed after passing peer review
• Dedicated customer support at every stage
For pre-submission enquiries, contact research@f1000.com
Page 7 of 7You can also read