INTERIM REPORT Q1 2022 - Midsummer AB (publ)
←
→
Page content transcription
If your browser does not render page correctly, please read the page content below
INTERIM REPORT Q1 2022
Midsummer AB (publ)

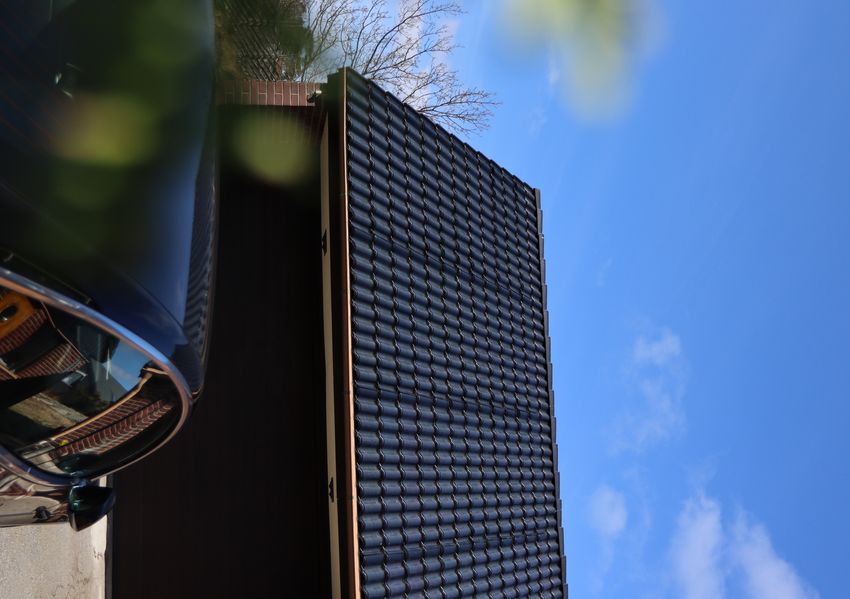
An installation of Midsummer SLIM

Midsummer in brief
Midsummer develops and sells equipment for the production of flexible thin-film solar
cells, and manufactures, sells and installs solar roofs. The company was founded in 2004
and Midsummer owns the entire chain from the manufacturing equipment to the installed
solar roofs. Manufacturing will take place in Sweden. These are CIGS solar cells that are
thin, lightweight, flexible, discreet and have a minimal carbon footprint compared to other
solar panels.

Midsummer’s technology and products are considered to be well-positioned to meet
future needs and expectations on a market experiencing strong, global growth, at a time
when aesthetics and a minimal carbon footprint are becoming increasingly important
among discerning customers. Midsummer’s subsidiary, Midsummer Italia, is completing
a factory in Bari, which will become the largest producer of thin-film solar cells in Europe
with a production capacity of 50 MW. The company’s shares are registered on Nasdaq
First North Premier Growth Market.

                                              1
Interim report quarter 1, 2022
Midsummer AB (publ) Nasdaq First North Premier Growth Market

  NOTABLE EVENTS JANUARY–MARCH 2022

    Net sales for the Group total TSEK                  Earnings per share was SEK 0.84
    10,505 (TSEK 7,382) for the first                   (-0.46) before and after dilution.
    quarter of 2022.
                                                        Midsummer signs an agreement
    Midsummer signs an agreement                        with the Italian roofing company
    with the Italian roofing                            PugliAsfalti for the supply of solar
    manufacturer Unimetal for                           panels manufactured by Midsummer
    the delivery of solar panels                        Italia at the new factory in Bari.
    manufactured by Midsummer Italia                    PugliAsfalti intends to purchase solar
    at the new factory in Bari.                         panels at a value of up to MSEK 124
    Unimetal intends to purchase solar                  per year over five years, which gives
    panels at a value of up to MSEK                     a total contract value of just over
    90 per year over five years, which                  MSEK 620. This is the third similar
    gives a total contract value of just                agreement in a short time and the
    over MSEK 450.                                      largest to date.

  NOTABLE EVENTS AFTER THE END OF THE PERIOD

    Final delivery and approved                         Final delivery and approved
    acceptance test of Midsummer's in-                  acceptance tests of the two DUO
    house developed UNO machine for                     machines shipped to China Q4 2021.
    research on thin film solar cells to
    the University of New South Wales
    in Sydney, Australia.

             The comparative figures in this report refer to the previous year unless otherwise stated.

                                                   2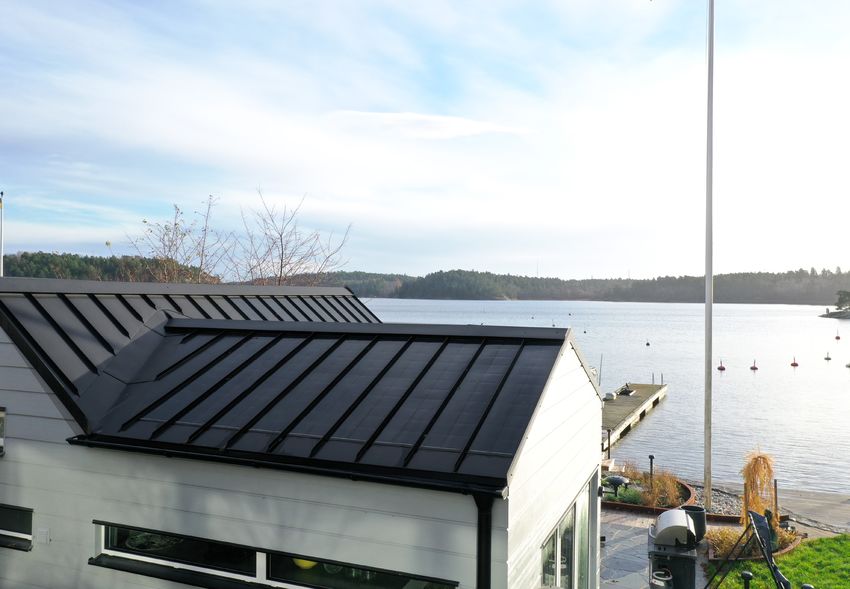
Key performance indicators
                                                Jan.-Mar. 2022 Jan.-Mar. 2021
TSEK
Net sales                                              10,505         7,382
Operating profit                                       55,727      -23,672
EBITDA                                                 63,973      -72,775
Profit before tax                                      49,814       -27,318
Comprehensive income for the period                    43,771      -26,735
Operating margin                                         531%     Negative
EBITDA margin                                           609%      Negative
Equity/assets ratio                                     55.4%        48.9%
Cash flow for the period                              -46,242      -42,357
Earnings per share
– before and after dilution (SEK)                        0.84         -0.46

                                      3   An installation of Midsummer SLIM
Midsummer’s factory in Bari, Italy

CEO’s statement
We have made impressive progress in the first quarter of this year in terms of the work
of establishing large-scale production of thin-film solar cells in Italy (the Invitalia project).
All the necessary agreements with authorities and other stakeholders are in place and
the completion of the factory in Bari is underway which includes electrical, water and
gas installations. Production equipment for the factory of the DUO model has been
manufactured in parallel in Järfälla. Three of these machines are ready for shipping, and
in addition to these three machines, Midsummer has delivered two machines of the DUO
R&D model, designed for research.

In connection with the start of the Invitalia project, Midsummer has started to recognise
the grant awarded by the Italian authorities in the last quarter of 2021. As a result, quarter
Q1, 2022 shows positive figures.

Midsummer has signed three five-year framework agreements for the delivery of
solar panels to Italian operators in the construction and roofing industries. Two of the
agreements were concluded this quarter while one was concluded at the end of last
year. Through these agreements, close to a third of the factory’s production capacity is
mortgaged to cover the next five years.

                                                4
This is an initial step in our international investment. Along with our Italian partners we are
convinced that our products will have a major impact on the Italian market.
The quarter also showed continued strong demand for Midsummer's solar roofs. New
orders for solar roofs in the first quarter rose by just over 26 per cent compared with the
same period last year. Revenues from the solar roof product line improved by 77 per cent
compared with the first quarter of 2021.
The European market for solar roofs is estimated to be worth BSEK 300 by 2030, and it
may be even better if the growth rate increases. The EU has presented really ambitious
programmes for the rapid transition to renewable energy with the goal of a much greater
domestic production of solar cells and solar panels. As part of this transition, Midsummer,
as one of the few European manufacturers of solar panels, can play a key role as our solar
panels have a lower carbon footprint than other solar panels and a lower carbon footprint
compared to wind and hydropower.
Europe is facing a major and comprehensive shift in terms of its energy production. And
we will be a part of this. Our goal is to come up to 1 GW of production capacity in Europe
by 2030. Sweden will play a key role for our expansion of production capacity. 2022 is
going to be a very exciting year.
Sven Lindström, CEO, Midsummer AB
5The development of earnings and financial
position in Q1 2022
Sales and earnings
Net sales for the Group for the first quarter of 2022 amounted to TSEK 10,505 (TSEK
7,382). Net sales for the Solar Roofs product line stood at TSEK 6,230 (TSEK 3,509),
while net sales for the Production Equipment product line amounted to TSEK 4,275
(TSEK 3,873).
Other operating income for the Group comprised contributions amounting to TSEK
97,035 (TSEK 243) and an exchange rate gain of TSEK 1,914 (TSEK 6,946).
Operating profit for the Group for the first quarter of 2022 was TSEK 55,727 (TSEK -
23,672), and profit before tax ended at TSEK 49,814 (TSEK -27,318).
Net sales for the parent company for the first quarter of 2022 stood at TSEK 357,685
(TSEK 39,221). Operating profit for the parent company was TSEK 198,438 (TSEK -
18,053).
In the fourth quarter of 2021, Italian authorities signed the decision that Midsummer, together
with Stellantis and ENEL, would be one of the initial three companies to be awarded start-up
support as part of Italy’s Recovery and Resilience Plan. This means that the company has
been able to start work on completing our solar cell factory in Bari.
At the end of the first quarter of 2022, Midsummer has completed five DUO machines for the
Bari factory (out of a total of 12 scheduled). One DUO machine was shipped during the period
and a second was shipped to Italy at the beginning of the second quarter. In parallel with the
manufacture of production equipment, the factory is also being prepared with electrical,
water, gas and clean room installations.
The Italian start-up support is recognised as revenue based on the degree of completion of
the project and in parallel with the project being expensed. In the first quarter of 2022,
Midsummer recognised SEK 96,764 of the Italian grant as income.
The start-up support is paid to the Midsummer Italia subsidiary in retrospect, when it
recognises costs in the project. The DUO machines are sold from the parent company to the
subsidiary at the market price. This invoice was issued in the first quarter, which means that
the parent company shows large net sales of TSEK 357,685, where TSEK 348,051 derives
from internal sales in the Italian project, which are eliminated in the consolidated figures. As
the start-up support is paid to the Italian subsidiary, it does not appear in the parent
company’s figures.
New orders
New orders for the Solar Roofs product line in the first quarter of 2022 amounted to
TSEK 12,490 (TSEK 9,870), while the total order book for the Solar Roofs product line
stood at TSEK 32,969 at the end of the quarter (TSEK 26,704 as at 31 December
2021).
New orders for the Group for the Production Equipment product line in the first
quarter of 2021 amounted to TSEK 3,059 (TSEK 571), while the total order book for
the Production Equipment product line stood at TSEK 53,024 at the end of the quarter
(TSEK 53,689 as at 31 December 2020).
6Cash flow and financing
In the first quarter of 2022 cash flow was TSEK -46,242 (TSEK -42,357). Cash and cash
equivalents amounted to TSEK 111,599 at the end of the quarter (TSEK 176,000 at the end of
Q1, 2021).
Inventories in the Group rose slightly during the quarter from TSEK 30,384 to TSEK 32,228
(TSEK 25,084 at the end of the Q1, 2021).
The negative cash flow stems from the fact that the Italian start-up support is paid
retrospectively once the Italian subsidiary has recognised the project costs to Invitalia, the
Italian authority that administers grant payments for the project. No start-up support was
paid in the first quarter.
Investments
The total investments in property, plant and equipment for the Group for the first quarter of
2022 amounted to TSEK -29,685 (TSEK 24,005). The reason why total investments are
negative is because part of the start-up support from Invitalia reduces the tangible fixed
assets for the DUO machines included in the project.
The total investments in property, plant and equipment in the first quarter of 2022 for the
parent company amounted to SEK 41 (TSEK 13,929).
Significant risks and uncertainties
Midsummer’s operations comprise the development and manufacture of equipment for the
production of flexible thin-film solar cells, as well as the production and sale of solar panels
and integrated solar roofs. Midsummer’s business is therefore associated with commercial
and operational risks, legal and regulatory risks, and financial risks.
A detailed description of Midsummer’s significant risks is available in the Directors’ Report in
the 2021 Annual Report.
This information also applies to the parent company.
7Transactions with associates
No transactions with associates have taken place in the Group. However, associate
transactions have taken place in the parent company.
In 2020, Midsummer AB started the wholly owned subsidiary Midsummer Italia S.r.l. in
connection with the company applying for start-up support from the Italian authority Invitalia.
Start-up support for setting up the mass production of solar roofs and solar panels at
Midsummer's factory in Bari was granted in the fourth quarter of 2021. The criteria for the
start-up support is that the subsidiary receives the grant from the Italian state and purchases
a turnkey production facility from the parent company at a market price that has been set
together with Invitalia based on the parent company’s sales price of similar facilities to
external customers.
In connection with the Invitalia project being officially started and the company being able to
make investments in the project, the above-mentioned transactions between the parent
company and its subsidiaries were initiated in the quarter.
The parent company has invoiced the subsidiary a total of TSEK 559,781, of which TSEK
348,051 was recognised as income in the first quarter. The remaining TSEK 211,730 is
recognised as liabilities to Group companies in the balance sheet and will be recognised as
income as the project progresses. At the end of the quarter, the subsidiary had paid invoices
of TSEK 342,138, leaving TSEK 217,643 in accounts receivable with the subsidiary.
The parent company has financed the subsidiary at a total of TSEK 178,856 in shareholder
contributions, and TSEK 180,327 in shareholder loans, where the shareholder loans will be
repaid as and when payments are made from Invitalia to the subsidiary.
Ownership structure as at 31 March 2022
Liang Gao 6,305,450 9.31%
Philip Gao 6,305,400 9.31%
H. Waldeaus AB 5,154,695 7.61%
Nordea Fonder 4,116,381 6.08%
Jan Lombach incl. company 3,653,975 5.39%
Infologix (BVI) Ltd. 3,037,293 4.48%
Avanza Pension 2,572,221 3.80%
Jörgen Persson incl. company 2,130,000 3.14%
Skandia fonder 1,947,695 2.88%
Länsförsäkringar fonder 1,841,626 2.72%
Other shareholders (11,050) 30,676,673 45.28%
Total number of shares 67,741,409 100.00%
8Consolidated statement of income and other
comprehensive income
Jan–Mar Jan–Mar
TSEK Note
2022 2021
Net sales 3 10,505 7,382
Other operating income 98,949 7,202
109,454 14,585
Own work capitalised 5,229 6,895
Raw materials and consumables -18,328 -13,909
Other external expenses -11,552 -3,144
Staff expenses -20,518 -18,796
Depreciation/amortisation and impairment of property, plant and
equipment and intangible assets -8,246 -8,909
Other operating expenses -312 -393
Operating profit 55,727 -23,672
Financial income 37 875
Financial expenses -5,950 -4,521
Net financial items -5,913 -3,645
Profit before tax 49,814 -27,318
Profit for the period 49,814 -27,318
Other comprehensive income
Other comprehensive income for the period -6,043 583
Comprehensive income for the period 43,771 -26,735
Profit for the period attributable to:
- Owners of the parent 49,814 -27,318
Comprehensive income for the period attributable to:
- Owners of the parent 43,771 -26,735
Earnings per share
- before and after dilution (SEK) 0.84 -0.46
Number of outstanding shares at end of reporting period
- before dilution and after dilution 67,741,409 59,171,392
Average number of outstanding shares
- before dilution and after dilution 67,741,409 59,171,392
9Consolidated statement of financial position
31 Mar 31 Dec
TSEK Note 2022 2021
Assets
Intangible assets 54,104 53,249
Property, plant and equipment 110,345 142,186
Right-of-use asset 10,994 12,333
Non-current receivables 40 40
Total non-current assets 175,483 207,808
Inventories 32,228 30,384
Contract assets 68,846 66,661
Tax assets 1,774 1,537
Accounts receivable 11,940 22,782
Prepayments and accrued income 131,443 1,362
Other receivables 2,623 1,541
Cash and cash equivalents 111,599 159,161
Total current assets 360,454 283,428
Total assets 535,937 491,236
Equity
Share capital 2,710 2,710
Other paid-in capital 530,037 530,037
Reserves in equity -5,819 224
Retained earnings incl. profit/loss for the period -230,201 -280,015
Equity attributable to owners of parent 296,726 252,956
Total equity 296,726 252,956
Liabilities
Non-current interest-bearing liabilities 199,700 202,770
Leasing liabilities 3,897 5,053
Other provisions 1,297 -
Total non-current liabilities 204,876 207,823
Current interest-bearing liabilities 1,369 1,367
Leasing liabilities 6,198 6,343
Trade payables 11,980 10,107
Contract liabilities 261 611
Tax liabilities - 273
Other liabilities 2,544 3,832
Accruals and deferred income 11,983 7,924
Total current liabilities 34,335 30,457
Total liabilities 239,210 238,280
Total equity and liabilities 535,937 491,236
10Consolidated statement of changes in equity
Equity attributable to owners of parent
Retained
earnings
Share Other Translation incl. Non- Total
TSEK capital paid-in reserve profit/loss Total controlling equity
capital for the interests
period
Opening equity 1 2,710 530,037 224 -280,015 252,956 - 252,956
Jan 2022
Comprehensive income for
the period
Profit for the period - - - 49,814 49,814 - 49,814
Other comprehensive income
- - -6,043 - -6,043 - -6,043
for the period
Comprehensive income for
the period - - -6,043 49,814 43,771 - 43,771
Closing equity 31 2,710 530,037 -5,819 -230,201 296,726 - 296,726
Mar 2022
Retained
earnings
Other Non-
TSEK Share paid-in Translation incl. Total controlling Total
capital capital reserve profit/loss interests equity
for the
period
Opening equity 1 2,367 404,510 -440 -150,504 255,933 - 255,933
Jan 2021
Comprehensive income for the
period
Profit for the period - - - -27,318 -27,318 - -27,318
Other comprehensive income
for the period - - 583 - 583 - 583
Comprehensive income for
the period
- - - -27,318 -26,735 - -26,735
New issue - 750 - - 750 - 750
Closing equity 31 2,367 405,260 143 -177,823 229,947 - 229,947
Mar 2021
11Consolidated statement of cash flows
TSEK Note Jan–Mar 2022 Jan–Mar 2021
Operating activities
Profit before tax 43,771 -26,325
Adjustment for non-cash items 10,490 7,685
Income tax paid - -
Increase (–)/Decrease (+) in inventories -1,844 1,598
Increase (–)/Decrease (+) in operating receivables -122,743 29,879
Increase (+)/Decrease (–) in operating liabilities 953 -23,551
Cash flow from operating activities -69,373 -10,713
Investing activities
Acquisitions/sales net of property, plant and equipment 29,685 -24,005
Acquisition of intangible assets -5,253 -6,907
Cash flow from investing activities 24,432 -30,912
Financing activities
Share issue - 750
Repayment of loans - -
Repayment of leasing liabilities -1,301 -1,481
Cash flow from financing activities -1,301 -731
Cash flow for the period -46,242 -42,357
Cash and cash equivalents at start of period 159,161 217,610
Exchange difference in cash and cash equivalents -1,319 746
Cash and cash equivalents at end of period 111,600 176,000
12Income statement for the parent company
Jan–Mar Jan–Mar
TSEK Note 2022 2021
Net sales 3 357,685 39,221
-88,949 -11,922
Change in goods in progress, finished goods and work in progress
Own work capitalised 5,229 6,895
Other operating income 1,439 2,724
275,403 36,918
Raw materials and consumables -20,173 -25,654
Other external expenses -12,596 -4,532
Staff expenses -19,796 -18,416
Depreciation/amortisation and impairment of property, plant and -6,554 -6,102
equipment and intangible assets
Other operating expenses -17,847 -267
Operating profit 198,438 -18,053
Profit from financial items
Interest income and similar profit/loss items 37 875
Interest expense and similar profit/loss items -7,198 -4,432
Profit after financial items 191,277 -21,610
Profit before tax 191,277 -21,610
Tax - -
Profit for the period 191,277 -21,610
Statement of income and other comprehensive
income for the parent company
Not Jan–Mar Jan–Mar
TSEK e 2022 2021
Profit for the period -21,610
191,277
Other comprehensive income
- -
Other comprehensive income for the period
- -
Comprehensive income for the period -21,610
191,277
13Balance sheet for the parent company
TSEK Note 31 Mar 31 Mar
2022 2021
Assets
Non-current assets
Intangible assets 53,949 48,381
Property, plant and equipment 30,814 34,421
Financial non-current assets
- Interests in subsidiaries 178,856 33,326
- Receivables at Group companies 180,327 -
- Other non-current receivables 40 40
Total financial non-current assets 359,222 33,366
Total non-current assets 443,986 116,168
Current assets
Inventories, etc. 56,408 90,221
Current receivables
- Accounts receivable 11,940 11,527
- Receivables at Group companies 217,643 -
- Contract assets 30,176 49,102
- Other receivables 2,539 2,497
- Prepayments and accrued income 3,346 1,594
Total current receivables 265,645 64,720
Cash and bank balances 108,760 173,656
Total current assets 430,813 328,597
Total assets 874,799 444,765
Condensed balance sheet for the parent company continues on next page
14Balance sheet for the parent company continued
31 Mar 31 Mar
TSEK Note
2022 2021
Equity and liabilities
Equity
Restricted equity
- Share capital 2,710 2,367
- Fund for development expenses 54,273 51,203
Non-restricted equity
- Share premium reserve 530,037 405,260
- Retained earnings -344,722 -226,843
- Profit for the period 192,596 -21,610
Total equity 434,894 210,377
Provisions
- Other provisions 1,279 125
Total provisions 1,279 125
Non-current liabilities
- Bonds 194,000 194,000
- Liabilities to credit institutions 5,700 7,067
Total non-current liabilities 199,700 201,067
Current liabilities
- Liabilities to credit institutions 1,367 535
- Advances from customers 261 2,562
- Trade payables 11,327 11,864
- Liabilities to Group companies 211,730 8,033
- Other current liabilities 2,257 2,743
- Accruals and deferred income 11,983 7,460
Total current liabilities 238,926 33,195
Total equity and liabilities 874,799 444,765
15Note 1 Accounting policies
This condensed consolidated interim report was prepared in accordance with IAS 34, Interim
Financial Reporting, and applicable provisions in the Swedish Annual Accounts Act. The
interim report for the parent company has been prepared in accordance with Chapter 9,
Interim Financial Reports, in the Swedish Annual Accounts Act. The same accounting policies
and methods of computation have been applied for the Group and the parent company as in
the most recent annual report.
Disclosures in accordance with IAS 34.16A appear in the financial statements and their
accompanying notes, as well as in other sections of this interim report.
Note 2 Key estimates and assessments
The company management and the Board have discussed the development, choice and
information regarding the Group’s important accounting policies and estimates, as well as the
application of these policies and estimates.
Listed below are some important accounting assessments and estimates.
Leases
The Group has leases for both vehicles and premises. When ascertaining the size of leasing
liabilities and leasing assets, assessments are required to determine whether it is reasonably
certain that the Group will use the extension options. When assessing whether it is
reasonably certain that extension options will be used for the premises, the Group has taken
into consideration its future growth, and based on this, it has determined how long it could
use the current premises. As a result, the Group has determined that it is not reasonably
certain that the Group will use its extension options. However, this is something that may
change in the future and would then affect the size of the leasing liability and leasing asset.
Revenue recognition
Revenue is measured based on the consideration specified in the contract with the customer.
The Group recognises revenue when control over goods or services transfers to the
customer. Assessments are required to determine the time when control is transferred, i.e. a
point in time or a period of time. For contracts that have been signed with customers, the
Group assessed that some of these contracts meet the requirements for revenue recognition
over time, while others do not. Consequently, revenues from some contracts are recognised
over a period of time and not at a point in time, while revenues from other contracts are
recognised based on performance obligations being met at a point in time.
16Note 3 Operating segments and revenue
allocation
The Group’s business is divided into operating segments based on the parts of the business
monitored by the company’s chief operating decision-maker. This is known as a management
approach. The Group’s internal reporting is structured so as to allow Group management to
follow up on the operations in their entirety. Based on this internal reporting the Group has
identified that the Group only has one segment.
Revenue streams
The Group generates revenue from its two product lines, Production Equipment and Solar
Roofs. The Production Equipment product line is divided into the sale of production
equipment for solar cell production, the process for solar cell production and the service of
the production equipment. The Solar Roofs product line includes the sale and installation of
solar panels and solar roofs, as well as replacement roofs.
Breakdown of revenue from contracts with customers
The breakdown of revenue from contracts with customers into major product and service
areas is summarised below.
Product line Production Equipment Solar Roofs Total
Jan–Mar Jan–Mar Jan–Mar Jan–Mar Jan–Mar Jan–Mar
Product/service area 2022 2021 2022 2021 2022 2021
Production equipment for
solar cell production 3,580 3,313 - - 3,580 3,313
Process for solar cell
- - - - - -
production
Service and support 695 560 - - 695 560
Solar Roofs - - 6,215 3509 6,215 3,509
Other - - 15 - 15 -
Total 4,275 3,873 6,230 3,509 10,505 7,382
Geographic areas
Product line Production Equipment Solar Roofs Total
Jan–Mar Jan–Mar Jan–Mar Jan–Mar Jan–Mar Jan–Mar
Geographic area 2022 2021 2022 2021 2022 2021
Sweden - - 5,710 3,508 5,710 3,508
China/Hong Kong 2,200 1,026 - - 2,200 1,026
EU - 1 520 - 520 1
Other 2,075 2,846 - 1 2,075 2,847
Total 4,275 3,873 6,230 3,509 10,505 7,382
Revenue from external customers refers to individual countries using the country where the
customer is based. In the first quarter of 2022 the company had two customers that each
accounted for more than 10% of revenues. Sales to these customers amounted to TSEK 2,134
and TSEK 1,782.
17The Group’s non-current assets are mostly located in Sweden, but the Group’s subsidiary,
Midsummer Italia S.r.L., has also made investments in its premises in Italy. The Group’s total
non-current assets amount to TSEK 175,483, which includes TSEK 96,000 in Sweden and
TSEK 79,483 in Italy.
Note 4 Fair value of financial instruments
The carrying value of all financial assets and liabilities provide a reasonable approximation of
fair value.
Future reporting dates
• Annual General Meeting – 7 June 2022
• Interim report for the second quarter of 2022 – 31 August 2022
• Interim report for the third quarter of 2022 – 16 November 2022
• Year-end report 2022 – 24 February 2023
18Certification
The Board of Directors and the Chief Executive Officer hereby certify that this year-end
report provides an accurate overview of the operations, position and earnings of the Group
and the parent company and that it describes the material risks and uncertainties faced by
the parent company and the Group companies.
Signatures/submission of the report
Stockholm 18 May 2022
Jan Johansson Jan Lombach Lisa Pers-Ohlsén
Board Chair Board Member Board Member
Philip Gao Johan Magnusson Claes Hofmann
Board Member Board Member Board Member
Review
This report has not been reviewed by the company’s auditors.
19Definitions and descriptions of alternative key
performance indicators
The company presents some financial measures in this interim report that are not defined
under IFRS. The company believes that these measures provide valuable supplemental
information for investors and the company’s management as they enable the evaluation of
the company’s performance.
Operating profit
Operating profit is profit before net financial items and taxes.
Operating profit is a measure that aims to show profitability in operating activities.
EBITDA
Operating profit before depreciation/amortisation and impairment.
EBITDA is a measure that the Group regards as relevant for investors who wish to
understand the earnings generated before investments in non-current assets.
Operating margin
Operating profit/Net sales
Operating profit is a measure that aims to show profitability in operating activities.
EBITDA margin
EBITDA/Net sales
EBITDA margin is a measure that the Group regards as relevant for investors who wish to
understand the earnings generated in relation to sales before investments in non-current
assets.
Equity/assets ratio
Equity in relation to total assets.
The equity/assets ratio is a key performance indicator that shows the proportion of the
assets that are financed with equity and can be used as an indication of the company’s long-
term solvency.
New orders
The value of orders received and changes to existing orders during the current period.
Order book
The value of existing orders at the end of the current period.
20EBITDA
Group, TSEK Q1 2022 Q1 2021
Operating profit 55,727 -23,672
Depreciation/amortisation and impairment of 8,246 8,909
property, plant and equipment and intangible
assets (+)
EBITDA 63,973 -14,763
Operating margin
Group, TSEK Q1 2022 Q1 2021
Operating profit 55,727 -23,672
Net sales 10,505 7,382
Operating margin 531% Negative
EBITDA margin
Group, TSEK Q1 2022 Q1 2021
EBITDA 63,973 -14,763
Net sales 10,505 7,382
EBITDA margin 609% Negative
Equity/assets ratio 31 Mar 31 Mar
Group, TSEK 2022 2021
Equity 296,726 229,947
Total assets 535,937 470,245
Equity/assets ratio 55.37% 48.90%
21You can also read