International Baccalaureate Career-related Programme students studying at UK higher education institutions: How do they perform in comparison ...
←
→
Page content transcription
If your browser does not render page correctly, please read the page content below
International
Baccalaureate Career-
related Programme
students studying at UK
higher education
institutions:
How do they perform in
comparison with BTEC
students?
Vicky Duxbury, Chris Westlake, Emma
Jones, Will Joice

April 2021
Conducted on behalf of the International Baccalaureate Organization

Jisc data analytics

Contents
Executive summary ...................................................................................................................... 4

Introduction .................................................................................................................................. 5

     Data sources ......................................................................................................................................................... 5

Descriptive comparison of IB CP and BTEC holders ................................................................... 7

  Time series of student cohorts .................................................................................................................................. 7
     Figure 1 UK domiciled first year full-time first degree students by entry qualification, 2014/15 to 2018/19 .........7
     Figure 2 UK domiciled first year full-time first degree students by entry qualification and sex, 2014/15 to
     2018/19 combined ................................................................................................................................................. 8
  Region of domicile for UK domiciled students .......................................................................................................... 8
  Equal opportunity and widening participation ........................................................................................................... 9
     Figure 3 UK domiciled first year full-time first degree students by entry qualification and ethnicity, 2014/15 to
     2018/19 combined ................................................................................................................................................. 9
     Figure 4 UK domiciled first year full-time first degree students by entry qualification and low participation
     neighbourhoods marker (POLAR4), 2014/15 to 2018/19 combined ...................................................................10
     Figure 5 Proportion of UK domiciled first year full-time first degree students by entry qualification and socio-
     economic classification (1-7), 2014/15 to 2018/19 combined .............................................................................11
  Region of HE provider .............................................................................................................................................12
     Figure 6 UK domiciled first year full-time first degree IB CP and BTEC students by region of HE provider and
     entry qualification, 2014/15 to 2018/19 combined ...............................................................................................12
  Subject area ............................................................................................................................................................13
     Figure 7 UK domiciled first year full-time first degree students by STEM marker and entry qualification subject,
     2014/15 to 2018/19 combined .............................................................................................................................13
     Figure 8 UK domiciled first year full-time first degree students by subject area and entry qualification, 2014/15
     to 2018/19 combined ...........................................................................................................................................14
     Figure 9 UK domiciled first year full-time first degree students by subject area and entry qualification subject,
     2014/15 to 2018/19 combined .............................................................................................................................15
  Non-continuation of students ..................................................................................................................................16
     Figure 10 Percentage of UK domiciled first year full-time first degree students that left with no award by entry
     qualification and entry subject, 2014/15 to 2017/18 combined ...........................................................................16
     Figure 11 Percentage of UK domiciled first year full-time first degree students who left with no award by entry
     qualification, entry subject and STEM subject marker, 2014/15 to 2017/18 combined ......................................17
     Figure 12 Percentage of UK domiciled first year full-time first degree students who left with no award by entry
     qualification and background demographics, 2014/15 to 2017/18 combined .....................................................18
  Qualifier cohorts ......................................................................................................................................................19
     Figure 13 Percentage of UK domiciled full-time first degree qualifiers by entry qualification and sex, 2015/16 to
     2018/19 combined ...............................................................................................................................................19
     Figure 14 Percentage of UK domiciled full-time first degree qualifiers by entry qualification and ethnicity,
     2015/16 to 2018/19 combined .............................................................................................................................20
     Figure 15 Percentage of UK domiciled full-time first degree qualifiers by entry qualification, entry subject and
     POLAR 4, 2015/16 to 2018/19 combined............................................................................................................20
     Figure 16 Percentage of UK domiciled full-time first degree qualifiers by entry qualification, entry subject and
     sec 2015/16 to 2018/19 combined ......................................................................................................................21
  Achievement............................................................................................................................................................22

                                                           How do they perform in comparison with BTEC students? | Executive summary | 2
Figure 17 Percentage of UK domiciled full-time first degree qualifiers by entry qualification and class of first
degree, 2015/16 to 2018/19 combined................................................................................................................22
Figure 18 Percentage of UK domiciled full-time first degree qualifiers by STEM subject marker and class of first
degree, 2015/16 to 2018/19 combined................................................................................................................22
Figure 19 UK domiciled full-time first degree qualifiers by class of first degree, entry qualification and
background demographics, 2015/16 to 2018/19 combined ................................................................................23
Graduate Outcomes cohort .....................................................................................................................................24
Activities of graduates .............................................................................................................................................24
Figure 20 UK domiciled full-time first degree graduates by entry qualification, domicile and activity, 2017/18 ..24
Occupations and industries of employed graduates ...............................................................................................25
Figure 21 UK domiciled full-time first degree graduates entering employment by industry and entry
qualification, 2017/18...........................................................................................................................................25
Figure 22 UK domiciled full-time first degree graduates entering employment by occupation and entry
qualification, 2017/18...........................................................................................................................................25
Summary.................................................................................................................................... 26
Student cohorts .......................................................................................................................................................26
Qualifier cohorts ......................................................................................................................................................26
Graduate cohorts ....................................................................................................................................................27
Appendices ................................................................................................................................ 28
Definitions .................................................................................................................................. 28
How do they perform in comparison with BTEC students? | Executive summary | 3Executive summary
Students enter higher education (HE) in the UK from a wide variety of educational backgrounds with differing
academic qualifications. It is of interest to explore any differences in the characteristics or trends in the cohorts of
students with different academic qualification prior to higher education, during and after their student journey.
The aim of this report is to compare students who enter UK HE after taking a Career-related Programme (CP)
awarded by the International Baccalaureate (IB) and those entering with a Business and Technology Education
Council (BTEC) qualification.
The report begins by investigating differences between first year, full-time first degree International Baccalaureate
Career Programme (IB CP) students and BTEC students enrolled in UK HE from 2014/15 to 2018/19 by their
background characteristics including domicile, entry qualification grade, equal opportunities and widening
participation. Following this, comparisons are made on the subject areas that IB CP and BTEC students are
enrolled on.
On successful completion of a HE qualification, students become “qualifiers”. Differences between the achievement
of qualifiers from 2015/16 to 2018/19 who hold an IB Career Programme or BTEC qualification are analysed; this is
further investigated by subject.
The Higher Education Statistics Agency (HESA) Graduate Outcomes survey was collected approximately 15
months after successful completion of their qualification; qualifiers become known as “graduates”. The survey
results give insight into whether graduates engage into the graduate journey of work or study post-HE. Differences
between graduates in 2017/18 who hold an IB CP qualification or BTEC qualification by post-HE activity are
explored including occupation, and industry.
Between 2014/15 and 2018/19, there were a total of 535 IB CP students identifiable in the HESA data. A small
number of students (50) were identified in 2014/15, this increased in 2018/19 to 145. The number of IB CP
students identifiable in the HESA data is far lower than their equivalent BTEC students. There were 87,505 BTEC
students in 2014/15 increasing to 88,530 in 2018/19. Thus, it is important to note that due to small samples of IB
CP students, qualifiers and leavers available for analysis care should be taken when interpreting the trends in CP
students’ outcomes and the comparisons between IB CP and BTEC students.
STEM subjects were more popular with BTEC students (43%) than IB CP students (39%). The most popular
subjects of study for IB CP students were business & administrative studies, 18%, and biological sciences, 18%.
The most popular subjects studied by BTEC students were business & administrative studies (16%) and creative
art & design (16%).
For those who achieved a first degree qualification from a UK HE provider, 70% of IB CP qualifiers achieved a first
class or upper second class honours degree compared to 66% of BTEC qualifiers. The same proportion (64%) of
IB CP and BTEC qualifiers who had studied a STEM subject at HE achieved a first class or upper second class
honours degree. For non-STEM subjects, a higher percentage of IB CP qualifiers (73%) gained a first or upper
second class honours compared to BTEC qualifiers (67%).
With regards the outcomes of graduates, a similar proportion of IB CP (74%) and BTEC graduates were in work
(75%). A higher proportion of IB CP graduates (11%) were engaged in further study than BTEC graduates (6%).
How do they perform in comparison with BTEC students? | Executive summary | 4Introduction This report provides a comparative in depth-analysis of students who enter UK higher education with an International Baccalaureate Career Programme (IB CP) qualification to those who enter with Business and Technology Education Council (BTEC) qualifications, with a focus on enrolment on Science Technology Engineering or Mathematics (STEM) subjects, continuation into the second year, achievement of first class honours degree, and activity fifteen months post completion of their first degree. The IB CP qualification is studied by students aged 16-19 and is currently available in more than 250 schools in 30 countries, including the United Kingdom. In 2012, in the UK County of Kent, an initiative was undertaken to implement the IB CP in its state schools. Currently there are approximately 30 schools participating in the Kent initiative and a total of 47 schools offer the IB CP in the UK (IBO, 2021). The IB CP is a framework of international education that incorporates the values of the International Baccalaureate into a unique programme addressing the needs of students engaged in career-related education. The programme can lead to further/higher education, apprenticeships or employment. IB CP students undertake a minimum of two IB Diploma Programme courses, a core consisting of four components (the reflective project, service learning, personal and professional skills, and language development) and a career-related study. BTEC qualifications (Level 3) are offered in many schools and further education colleges around the UK and are studied by 16-18 year-old students, typically over two years. They are specialist work-related qualifications and are undertaken in a wide range of vocational subjects including business studies and engineering. Data sources The report combines data sourced from both the International Baccalaureate Organization (IBO) and the Higher Education Statistics Agency (HESA). IBO maintains an information system (IBIS) that holds information about students around the world who have taken at least one IB examination. HESA collects information about the academic career of students prior to their enrolment in HE, their achievement at HE and their destination after leaving HE. HESA have linked the individual IB student records to HESA student records to identify students holding IB qualifications to enable the tracking of students through their academic career. The IB CP cohort is based on students known to hold an IB CP qualification from IBIS who successfully link to the HESA data. Detailed information about students’ qualifications prior to starting HE was collected by HESA for entrants from 2007/08 onwards. This information only covers a subset of students who apply to HE through the admissions service responsible for managing applications to HE courses in the UK (UCAS). Only information on qualifications for which the students passed prior to entering HE are held in the HESA record. IBIS also includes qualifications which were taken but not passed. Successful linking between the HESA record and IBIS enabled HESA to identify students in the HESA record who were known to hold an IB CP qualification. The IB CP cohort is therefore comprised of all students in the HESA record who have a successful link to the IB datasets and the qualification information from that record can be utilised. All analysis is restricted to students who were UK domiciled. A small number of students were identified in the HESA record as holding both an IB CP and BTEC qualification. Due to the linking logic, these students were classified as IB CP students and no information about their BTEC qualification was retained for the purposes of this report. Some of the information contained in the HESA record is returned from an entrant’s UCAS application form via the student’s HE provider. If an entrant does not apply through UCAS, the HE provider is encouraged to complete this information but that is not always the case and so may return unknown. This can create missing values for qualifications on entry or socio-economic classification (SEC), to name but a few. In this report the BTEC cohort is defined as students who hold a BTEC qualification on entry. The report provides an overview and descriptive statistics of the IB CP cohort shown alongside the equivalent BTEC cohorts. Where appropriate, a two-proportion z-test is performed to investigate if specified characteristics are significantly different between the IB CP and BTEC cohorts. All z-tests are performed at the 5% significance level (p
Throughout the report, any percentages calculated on small populations have been suppressed (see rounding
strategy for details).

                                             How do they perform in comparison with BTEC students? | Introduction | 6
Descriptive comparison of IB CP and BTEC
holders
Time series of student cohorts
Within the section regarding students at UK HE providers, references to IB CP/ BTEC students are students who
were UK domiciled, in their first year of study, enrolled on a full-time first degree at a UK HE provider with an IB CP
qualification or BTEC qualification, respectively.
Figure 1 shows between 2014/15 and 2018/19, there were a total of 535 IB CP students identifiable in the HESA
data. The small number of students in 2014/15 (50) was followed by larger increases in the following years, with
nearly three times the number of students enrolled in 2018/19 (145). This is likely to be related to the uptake of the
IB CP qualification in the County of Kent, where the number of schools implementing the IB CP increased from 9 in
2012 to 29 in 2020. However, the number of IB CP students identifiable in the HESA data is far lower than the
equivalent BTEC students. There were 87,505 BTEC students in 2014/15, peaking in 2016/17 at 96,910 and falling
to 88,530 in 2018/19.
Figure 1 UK domiciled first year full-time first degree students by entry qualification,
2014/15 to 2018/19
140 (120) (125) (145)
120
100
IB CP 80 (95)
60
40
(50)
20
100K
(95,085) (96,910) (95,830)
80K
(87,505) (88,530)
60K
BTEC
40K
20K
0K
2014/15 2015/16 2016/17 2017/18 2018/19
Due to the small number of IB CP students identified in the HESA data, all further analysis compares all IB CP
students and BTEC students combined across the time series 2014/15 to 2018/19.
How do they perform in comparison with BTEC students? | Descriptive comparison of IB CP and BTEC holders | 7Figure 2 shows the breakdown of entry qualifications by sex for 2014/15 to 2018/19 combined. The proportion of
males and females is equally split for both IB CP students and BTEC students across the complete time series.
Figure 2 UK domiciled first year full-time first degree students by entry qualification and
sex, 2014/15 to 2018/19 combined
50% 50%
IB CP
(265) (270)
50% 50%
BTEC
(233,530) (230,215)
Sex
Female
Male
Region of domicile for UK domiciled students
The IB CP qualification was launched in 2012, in the County of Kent. Perhaps unsurprisingly, across the time
series 2014/15 to 2018/19, 58% of IB CP students were domiciled from the South East and 19% were domiciled
from London. The remaining 23% were from different regions including the West Midlands (6%), Yorkshire and the
Humber (6%), the North West (7%) and East of England (4%).
BTEC students were domiciled from across the UK within the time series 2014/15 to 2018/19. The highest
proportion were domiciled from London (18%) followed by the North West (14%), the South East (12%), the West
Midlands (12%), Yorkshire and The Humber (10%), the East of England (8%), the East Midlands (7%) and the
South West (7%). All other regions had 5% or fewer BTEC students domiciled from there.
How do they perform in comparison with BTEC students? | Descriptive comparison of IB CP and BTEC holders | 8Equal opportunity and widening participation
This section concentrates on equal opportunity and widening participation background characteristics of IB CP and
BTEC students, focussing on participation of certain groups that may be underrepresented in HE for 2014/15 to
2018/19 combined.
The proportion of IB CP students from a Black, Asian and minority ethnic (BAME) background was 23% which was
statistically significantly lower than the proportion of BAME BTEC students (34%) across the time series.
Looking in more detail in Figure 3, there was a higher proportion of Asian BTEC students (16%) than Asian IB CP
students (11%), similarly there was a higher proportion of Black BTEC students than Black IB CP students (6%).
Figure 3 UK domiciled first year full-time first degree students by entry qualification and
ethnicity, 2014/15 to 2018/19 combined
8%
IB CP Asian
(45)
6%
Black
(30)
6%
Mixed
(30)
4%
Other
(20)
77%
White
(410)
16%
BTEC Asian
(72,075)
11%
Black
(52,440)
5%
Mixed
(21,310)
2%
Other
(10,195)
66%
White
(304,855)
Ethnicity
Asian
Black
Mixed
Other
White
How do they perform in comparison with BTEC students? | Descriptive comparison of IB CP and BTEC holders | 9Information about the neighbourhood a student was living in prior to entering HE is based on POLAR4 developed
by the Higher Education Funding Council for England (HEFCE). It is an update of POLAR3, using cohorts of
students who were aged 15 at the start of academic years 2006/07 to 2011/12 and hence could have entered HE
between 2009/10 and 2014/15. Students whose postcodes fall within wards with the lowest 20% of participation
rates are denoted as being from a low participation neighbourhood. Figure 4 shows there was a statistically
significant higher proportion of IB CP students from a low participation neighbourhood (29%) than BTEC students
(17%) for 2014/15 to 2018/19 combined.
Figure 4 UK domiciled first year full-time first degree students by entry qualification and
low participation neighbourhoods marker (POLAR4), 2014/15 to 2018/19 combined
29% 71%
IB CP
(155) (380)
17% 83%
BTEC
(77,905) (372,260)
Low participation neighbourhood (POLAR4)
Other neighbourhood (POLAR4)
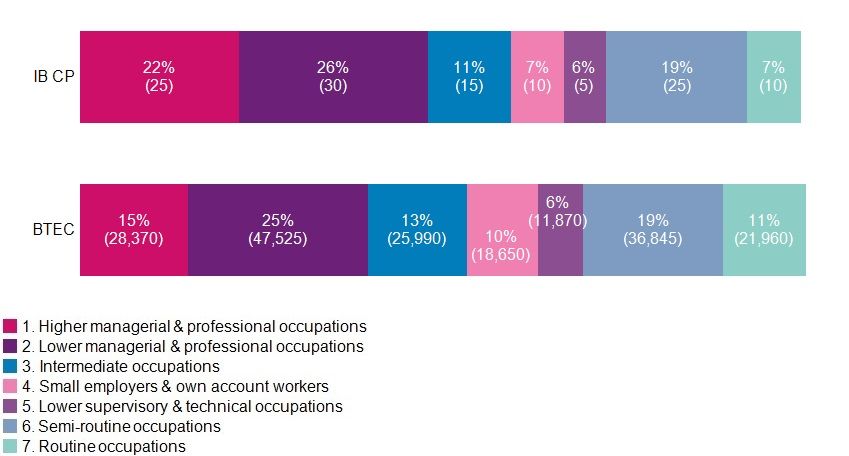
How do they perform in comparison with BTEC students? | Descriptive comparison of IB CP and BTEC holders | 10Socio-economic classification (SEC) of UK domiciled students aged under 21 on entry refers to the occupation of
their parent or guardian, whilst it corresponds to their own occupation if they are aged 21 and over. SEC
information is either not classified or unknown for approximately 16-17% of IB CP and BTEC students across the
time series. These students have been excluded from further calculations regarding SEC.
Figure 5 shows for 2014/15 to 2018/19 combined, ‘lower managerial and professional occupations’ (level 2) was
the most common classification for all students regardless of entry qualification (25% IB CP and 23% BTEC).
55% of IB CP students were from a higher socio-economic classification (1-3) compared to 52% of BTEC students.
A higher percentage of students were from a higher socio-economic classification (1-3) than lower socio-economic
classification (4-7) for both entry qualifications, although this was not statistically significantly different.
Figure 5 Proportion of UK domiciled first year full-time first degree students by entry
qualification and socio-economic classification (1-7), 2014/15 to 2018/19 combined 1
1 Please note that due to small numbers, the category ‘Never worked & long-term unemployed’ have been included
in the percentage calculations, but not shown (IB CP: 1% (5), BTEC: 1% (3,140).
How do they perform in comparison with BTEC students? | Descriptive comparison of IB CP and BTEC holders | 11Region of HE provider
IB CP and BTEC students were enrolled at 157 HE providers across the UK. Of these providers, 127 were in
England across 9 Government Office regions, 8 were in Wales, 18 in Scotland and 4 in Northern Ireland.
Figure 6 shows the proportion of IB CP and BTEC students by region of HE provider 2014/15 to 2018/19
combined. The most popular location of HE provider for IB CP students was the South East (45%), followed by
London (18%), the North West (8%) and West Midlands (8%). Over three quarters of IB CP students chose to
study in one of these regions. The location popularity of HE providers was much more geographically spread
across the UK for equivalent BTEC students; the most popular locations were the North West (15%), London
(13%), the South East (12%) and the East Midlands (12%).
For both IB CP students and BTEC students, there was a tendency to attend a HE provider within their own region
of domicile. Overall, 72% of IB CP students studied at a HE provider in the same region of domicile, compared with
59% for BTEC students. 70% of IB CP students domiciled from the South East attended a HE provider in the South
East, similarly 74% of IB CP students domiciled from London attended a HE provider in London.
This wasn’t quite as profound for BTEC students in these regions, with 56% of BTEC students domiciled from
London remaining in London to attend HE and 48% of BTEC students domiciled from the South East attending an
HE provider in the South East. This did differ dependent on region, 75% of BTEC students domiciled from the
North East attended a HE provider in the North East and 74% of BTEC students domiciled from the North West
remained at a HE provider in the North West.
Figure 6 UK domiciled first year full-time first degree IB CP and BTEC students by region
of HE provider and entry qualification, 2014/15 to 2018/19 combined
IB CP BTEC
45% | South East 15% | North West
18% | London 13% | London
8% | North West 12% | South East
8% | West Midlands 12% | East Midlands
6% | Yorkshire and The Humber 11% | Yorkshire and The Humber
6% | South West 10% | West Midlands
4% | East of England 8% | South West
3% | East Midlands 7% | Wales
1% | North East 5% | North East
1% | Wales 5% | East of England
0% | Northern Ireland 2% | Northern Ireland
0% | Scotland 1% | Scotland
© 2021 Mapbox © OpenStreetMap
© 2021 Mapbox © OpenStreetMap
How do they perform in comparison with BTEC students? | Descriptive comparison of IB CP and BTEC holders | 12Subject area
UK HE providers offer a wide range of subjects to study. Enrolment by subject area differed within, and between
the IB CP and BTEC student cohorts. Subject areas can be separated into two groups: STEM and non-STEM
subjects. STEM subjects were statistically significantly more popular with BTEC students (43%) than IB CP
students (39%).
The IB CP qualification allows students to choose at least two courses from the following subject groups: studies in
language and literature, language acquisition (due to small numbers these subject groups have been combined as
languages), individuals and societies; sciences; mathematics; and the arts. There are over 2,000 BTEC
qualifications across 16 sectors 2; the BTEC subjects were mapped to the five subject groups to allow comparison
at an entry qualification subject level. As a student could have multiple entry subjects, the following charts are
based on students with an element of the entry subject in their entry qualification. Therefore, there is an aspect of
double-counting of students in charts which include entry qualification subject.
Figure 7 shows the entry qualification subject by STEM marker for 2014/15 to 2018/19 combined. For IB CP
students, except for those who had a sciences element to their entry qualification, the majority went on to study a
non-STEM subject at HE regardless of their entry qualification subject. A similar pattern was seen for BTEC
students (with the exception for those students who had studied a mathematics or science element to their entry
qualification), where the majority went on to study a non-STEM related subject in HE.
Figure 7 UK domiciled first year full-time first degree students by STEM marker and entry
qualification subject, 2014/15 to 2018/19 combined
Individuals and
societies Languages Mathematics Sciences The arts Grand Total
34% 31% 46% 55% 25% 39%
IB CP STEM
(95) (65) (115) (120) (45) (220)
66% 69% 54% 45% 75% 61%
Non-STEM
(165) (130) (135) (105) (125) (340)
29% 29% 62% 65% 19% 43%
BTEC STEM
(67,160) (22,025) (74,295) (144,705) (34,020) (217,425)
71% 71% 38% 35% 81% 57%
Non-STEM
(143,225) (45,595) (48,835) (91,635) (116,975) (260,560)
2 What is a BTEC diploma? - Nationals, Firsts & Apprenticeships (ucas.com)
How do they perform in comparison with BTEC students? | Descriptive comparison of IB CP and BTEC holders | 13Figure 8 shows the breakdown of subject areas by entry qualification for 2014/15 to 2018/19 combined. The most
popular subjects studied by IB CP students were business & administrative studies (18%) and biological science
(18%). The most popular subjects studied by BTEC students were business & administrative studies (16%) and
creative art & design (16%).
Subjects allied to medicine was more popular with BTEC students than IB CP students (10% and 6% respectively).
Similarly creative arts & design was more popular with BTEC students than IB CP students (16% and 12%
respectively), while biological sciences was more popular with IB CP students than BTEC students (18% and 14%
respectively).
Figure 8 UK domiciled first year full-time first degree students by subject area and entry
qualification, 2014/15 to 2018/19 combined
IB CP BTEC
0%
(1) Medicine & dentistry (185)
6% 10%
(2) Subjects allied to
medicine (35) (50,115)
18% 14%
(3) Biological sciences (105) (74,895)
0%
(4) Veterinary science (90)
(5) Agriculture & related 1% 1%
subjects (5) (3,860)
2% 3%
(6) Physical sciences (10) (10,815)
0% 1%
(7) Mathematical sciences (5) (2,455)
5% 8%
(8) Computer science (30) (45,035)
(9) Engineering & 4% 5%
technology (25) (24,900)
3% 2%
(A) Architecture, building &
planning (15) (9,425)
11% 9%
(B) Social studies (70) (44,350)
4% 4%
(C) Law (25) (16,760)
(D) Business & 18% 16%
administrative studies (110) (79,820)
4% 4%
(E) Mass communications
& documentation (25) (19,685)
2% 2%
(F) Languages (15) (7,940)
(G) Historical & 4% 2%
philosophical studies (20) (5,540)
12% 16%
(H) Creative arts & design (65) (76,905)
6% 5%
(I) Education (40) (24,755)
0%
(J) Combined (265)
How do they perform in comparison with BTEC students? | Descriptive comparison of IB CP and BTEC holders | 14Figure 9 shows the entry qualification subject by subject of study at HE for 2014/15 to 2018/19 combined. The
chart shows that 32% of IB CP students who had a sciences element to their entry qualification went on to study
biological sciences at HE. Similarly, for IB CP students who had the arts element to their entry qualification, 31%
went on to study creative arts & design.
There was also a similar trend for BTEC students, where 50% of BTEC students who had the arts element to their
entry qualification went on to study creative arts & design. For BTEC students, 55% of those who had a
mathematics element to their entry qualification went on to study another STEM subject at HE 3.
Figure 9 UK domiciled first year full-time first degree students by subject area and entry
qualification subject, 2014/15 to 2018/19 combined
IB CP BTEC
Individuals
HE Subject of Individuals and Languages Mathematics Sciences The arts
Languages Mathematics Sciences The arts
study and societies societies
16% 17% 15% 32% 6% 10% 11% 7% 30% 5%
(3) Biological
sciences (45) (40) (45) (70) (15) (22,780) (8,040) (9,505) (68,910) (8,345)
18% 14% 31% 23% 18% 20% 19% 55% 35% 15%
Other STEM (50) (30) (75) (50) (30) (45,175) (14,280) (65,200) (78,200) (25,995)
12% 10% 9% 15% 8% 13% 9% 5% 10% 4%
(B) Social
studies (35) (25) (25) (35) (15) (27,410) (7,310) (7,145) (27,760) (7,405)
(D) Business & 24% 17% 22% 10% 18% 29% 13% 18% 9% 8%
administrative (60) (35) (60) (25) (35) (64,745) (9,855) (22,200) (23,970) (13,945)
studies
6% 17% 7% 6% 31% 7% 17% 7% 4% 50%
(H) Creative
arts & design (15) (30) (20) (15) (50) (18,280) (12,810) (9,565) (10,965) (72,105)
24% 26% 15% 15% 18% 21% 30% 8% 13% 18%
Other
non-STEM
(65) (50) (40) (35) (35) (41,060) (18,775) (12,535) (33,620) (29,175)
3Please see BTEC subject groupings in the appendices for more information on how the BTEC subjects were
grouped.
How do they perform in comparison with BTEC students? | Descriptive comparison of IB CP and BTEC holders | 15Non-continuation of students
The IB CP and BTEC students were linked from their first year of study into their second year of study to analyse
non-continuation rates. Although there is some variation in the non-continuation rate across entry qualifications and
entry subjects, most students do continue their studies into the second year. Care should be taken when
interpretating percentages of IB CP students due to small numbers.
Figure 10 Percentage of UK domiciled first year full-time first degree students that left
with no award by entry qualification and entry subject, 2014/15 to 2017/18 combined
Individuals and
societies Languages Mathematics Sciences The arts Grand Total
11% 11% 9% 10% 13% 11%
IB CP
(30) (20) (25) (25) (20) (60)
9% 8% 10% 9% 9% 9%
BTEC
(20,945) (5,500) (13,465) (24,100) (13,885) (51,190)
Figure 10 shows a slightly statistically significant higher percentage of IB CP students (11%) compared to BTEC
students (9%) left with no award after their first year of study during 2014/15 to 2018/19 combined.
Figure 10 shows that the percentage of students who left with no award also differed by entry subject. 13% of IB
CP students who had the arts element to their entry qualification left with no award compared to 9% of IB CP
students who had a mathematics element to their entry qualification. Except for those students who had an entry
qualification with a mathematics element, the percentage of students that left with no award was higher for IB CP
students than BTEC students across all entry subjects.
How do they perform in comparison with BTEC students? | Descriptive comparison of IB CP and BTEC holders | 16Figure 11 shows that there was also a difference in the percentage of students who left with no award when
analysing both entry subject and subject of study at HE for 2014/15 to 2018/19 combined. For both IB CP students
and BTEC students, a higher percentage of students left with no award when they were enrolled on a STEM
subject compared to a non-STEM subject (IB CP students, STEM: 12% Non-STEM 10%; BTEC students, STEM
10% Non-STEM 9%). Care should be taken when interpretating percentages of IB CP students due to small
numbers.
Figure 11 Percentage of UK domiciled first year full-time first degree students who left
with no award by entry qualification, entry subject and STEM subject marker, 2014/15 to
2017/18 combined
Individuals and
societies Languages Mathematics Sciences The arts Grand Total
17% 7% 11% 10% 12% 12%
IB CP STEM (15) (5) (15) (15) (5) (25)
8% 12% 8% 9% 13% 10%
Non-STEM (15) (15) (10) (10) (15) (35)
10% 9% 11% 9% 11% 10%
BTEC STEM (7,295) (2,070) (9,105) (16,015) (3,665) (26,060)
9% 8% 9% 9% 8% 9%
Non-STEM (14,315) (3,600) (4,655) (9,085) (10,560) (26,750)
How do they perform in comparison with BTEC students? | Descriptive comparison of IB CP and BTEC holders | 17There were differences in the non-continuation rates of IB CP and BTEC students by their background
demographics. Figure 12 shows the non-continuation rates of students by entry qualification and selected
background demographics.
A higher proportion of male IB CP and BTEC students (13% and 11% respectively) left HE without an award than
their female counterparts (9% and 8% respectively).
A higher proportion of BAME IB CP and BTEC students (13% and 10% respectively) left HE without an award than
their white counterparts (10% and 9% respectively).
A higher proportion of students from a lower socio-economic classification (4-7) (13% IB CP, 10% BTEC) left with
no award compared to students from a higher socio-economic classification (1-3) (9% IB CP, 8% BTEC).
A higher proportion of IB CP and BTEC students from low participation neighbourhoods (12% and 10%
respectively) left with no award than those from other neighbourhoods (10% and 9%).
Figure 12 Percentage of UK domiciled first year full-time first degree students who left
with no award by entry qualification and background demographics, 2014/15 to 2017/18
combined
IB CP BTEC
9% 8%
Female (25) (22,195)
13% 11%
Male (35) (28,990)
13% 10%
Black, Asian and
minority ethnic (BAME) (15) (18,740)
10% 9%
White (40) (31,980)
9% 8%
SEC 1-3 (25) (19,260)
13% 10%
SEC 4-7 (25) (19,935)
Low participation 12% 10%
neighbourhood (20) (8,910)
(POLAR4)
10% 9%
Other neighbourhood
(POLAR4) (40) (40,855)
How do they perform in comparison with BTEC students? | Descriptive comparison of IB CP and BTEC holders | 18Qualifier cohorts
IB CP and BTEC qualifiers are graduates who achieved a full-time first degree at a UK HE provider, and who
entered HE with an IB CP or BTEC qualification.
The IB CP initiative in the UK County of Kent was launched in 2012; the first students participating in the Kent
initiative most likely entered HE and were observed in the HESA data in 2014/15. Following a typical 3-year first
degree, the first IB CP qualifiers were in 2016/17 (30), increasing in 2017/18 to 75 and then slightly falling in
2018/19 to 50. In total, across the time series, 155 IB CP qualifiers were identified in the HESA data.
There has been a steady increase in BTEC qualifiers between 2015/16 to 2018/19. There were 51,120 BTEC
qualifiers in 2015/16, increasing year-on-year to 64,500 in 2018/19.
Figure 13 shows the percentage of full-time first degree qualifiers by entry qualification, entry subject and sex.
There was a similar proportion of IB CP female qualifiers (52%) compared to BTEC female qualifiers (53%),
although this was not statistically significantly different.
Figure 13 Percentage of UK domiciled full-time first degree qualifiers by entry
qualification and sex, 2015/16 to 2018/19 combined
52% 48%
IB CP
(80) (75)
53% 47%
BTEC
(126,455) (111,480)
Sex
Female
Male
How do they perform in comparison with BTEC students? | Descriptive comparison of IB CP and BTEC holders | 19The proportion of IB CP qualifiers from a Black, Asian and minority ethnic (BAME) background was 18%, which
was statistically significantly lower than the proportion of BAME BTEC students (27%) across the time series.
Care must be taken when interpretating trends for IB CP qualifiers in Figure 14 due to small numbers. Across all
entry subjects, there was a higher proportion of Asian BTEC qualifiers than any other ethnicity.
Figure 14 Percentage of UK domiciled full-time first degree qualifiers by entry
qualification and ethnicity, 2015/16 to 2018/19 combined
5%
IB CP Asian
(10)
6%
Black
(10)
6%
Mixed
(10)
2%
Other
(5)
80%
White
(125)
14%
BTEC Asian
(32,165)
9%
Black
(20,890)
4%
Mixed
(9,745)
2%
Other
(3,955)
72%
White
(170,025)
Ethnicity
Asian
Black
Mixed
Other
White
Figure 15 shows there was a statistically significant higher proportion of IB CP qualifiers from a low participation
neighbourhood (31%) than BTEC qualifiers (17%) for 2015/16 to 2018/19 combined.
Figure 15 Percentage of UK domiciled full-time first degree qualifiers by entry
qualification, entry subject and POLAR 4, 2015/16 to 2018/19 combined
31% 69%
IB CP
(50) (110)
17% 83%
BTEC
(39,710) (191,390)
Low participation neighbourhood (POLAR4)
Other neighbourhood (POLAR4)
How do they perform in comparison with BTEC students? | Descriptive comparison of IB CP and BTEC holders | 20Figure 16 shows for 2015/16 to 2018/19 combined, ‘lower managerial and professional occupations’ (level 2) was
the most common classification for all qualifiers regardless of entry qualification (26% IB CP and 25% BTEC).
There was a higher proportion of IB CP qualifiers from socio-economic classification (1-3) (59%) than BTEC
qualifiers (53%) for 2015/16 to 2018/19 combined, which was not statistically significantly different.
Figure 16 Percentage of UK domiciled full-time first degree qualifiers by entry
qualification, entry subject and sec 2015/16 to 2018/19 combined 4
4 Please note that due to small numbers, the category ‘Never worked & long-term unemployed’ has been included
in the percentage calculations, but not shown (IB CP: 2% (0), BTEC: 1% (1,615).
How do they perform in comparison with BTEC students? | Descriptive comparison of IB CP and BTEC holders | 21Achievement
Figure 17 shows the proportion of qualifiers by entry qualification and class of first degree for 2015/16 to 2018/19
combined. Figure 17 shows a higher percentage of IB CP qualifiers achieved a first or upper second class honours
(70%) than BTEC qualifiers (66%), which was not statistically significantly different.
Figure 17 Percentage of UK domiciled full-time first degree qualifiers by entry
qualification and class of first degree, 2015/16 to 2018/19 combined
21% 49% 24% 6%
IB CP (30) (70) (35) (10)
19% 47% 28% 6%
BTEC (41,135) (103,155) (62,135) (12,275)
First class honours
Upper second class honours
Lower second class honours
Third class honours/Pass
Figure 18 shows the achievement of first degree qualifiers by entry qualification and STEM subject marker. For
both IB CP and BTEC qualifiers, 64% of qualifiers who studied a STEM subject at HE were awarded a first or upper
second class honours. For those who had studied a non-STEM subject, a higher proportion of IB CP qualifiers
(73%) gained a first or upper second class honours compared to 67% of BTEC qualifiers.
Figure 18 Percentage of UK domiciled full-time first degree qualifiers by STEM subject
marker and class of first degree, 2015/16 to 2018/19 combined
STEM Non-STEM
23% 41% 27% 9% 21% 52% 22% 5%
IB CP
(10) (20) (10) (5) (25) (55) (25) (5)
6% 5%
20% 43% (5,725) 18% 50% (6,955)
BTEC 30% 28%
(18,050) (39,035) (24,035) (67,220)
(27,000) (37,275)
First class honours
Upper second class honours
Lower second class honours
Third class honours/Pass
How do they perform in comparison with BTEC students? | Descriptive comparison of IB CP and BTEC holders | 22As with non-continuation rates, academic achievement differs by their demographic background. Figure 19 shows
that 70% of both male and female IB CP qualifiers achieved a first or upper second class honours. A slightly higher
proportion of female BTEC qualifiers achieved a first or upper second class honours (68%) compared to their male
counterparts (64%).
A higher proportion of BAME IB CP qualifiers achieved a first or upper second class honours (73%) than white
qualifiers (69%), the converse was true for BTEC qualifiers, with 70% of white BTEC qualifiers achieving a first or
upper second class honours compared to 55% of BAME BTEC qualifiers.
A similar trend was seen when considering socio-economic classification for both IB CP qualifiers and BTEC
qualifiers. Those from a higher socio-economic classification (1-3) performed better (IB CP qualifiers: 76%, BTEC
qualifiers: 69%) than those from a lower socio-economic classification (4-7) (IB CP qualifiers: 73%, BTEC
qualifiers: 65%).
IB CP qualifiers who were from a low participation neighbourhood were more likely to obtain a first or upper second
class honours degree (72%) than those from other neighbourhoods (69%). The converse was true for BTEC
qualifiers, with 64% of BTEC qualifiers from a low participation neighbourhood achieving a first or upper second
class honours compared to 66% of BTEC qualifiers from other neighbourhoods.
Figure 19 UK domiciled full-time first degree qualifiers by class of first degree, entry
qualification and background demographics, 2015/16 to 2018/19 combined
IB CP BTEC
17% 53% 19% 49%
Female
(15) (40) (22,305) (57,385)
25% 45% 19% 45%
Male
(15) (30) (18,810) (45,755)
Black, Asian and 28% 45% 12% 43%
minority ethnic (BAME) (10) (15) (7,375) (25,920)
19% 50% 21% 49%
White (20) (60) (33,575) (76,730)
18% 58% 20% 49%
SEC 1-3
(10) (40) (19,075) (46,020)
24% 49% 18% 47%
SEC 4-7
(10) (20) (14,760) (38,070)
Low participation 21% 51% 18% 46%
neighbourhood (10) (20) (6,370) (16,695)
(POLAR4)
Other neighbourhood 21% 48% 19% 47%
(POLAR4) (20) (50) (33,660) (83,270)
First class honours Upper second class honours
How do they perform in comparison with BTEC students? | Descriptive comparison of IB CP and BTEC holders | 23Graduate Outcomes cohort
The HESA Graduate Outcomes survey was introduced for 2017/18 graduates and asked them detailed questions
to provide an understanding of the graduate journey. Data was collected approximately 15 months after graduation
via a survey undertaken at a centralised contact centre. In 2017/18, 52% of UK domiciled graduates responded to
the survey.
Within the section regarding graduates from UK HE providers, references to IB CP graduates / BTEC graduates
are meant to indicate UK domiciled graduates who achieved a full-time first degree at a UK HE provider and
completed the Graduate Outcomes survey approximately 15 months after graduation, and who had entered HE
with an IB CP qualification or BTEC qualifications, respectively.
In 2017/18, there were 40 IB CP graduates and 32,565 BTEC graduates who responded to the Graduate
Outcomes survey. Care must be taken when analysing activities of IB CP graduates due to small numbers.
Activities of graduates
Figure 20 shows the graduate’s activity approximately 15 months after completing their studies. Graduates may be
engaged in multiple activities on the survey date; in what follows, work refers to graduates in full-time or part-time
work, excluding those undertaking both work and further study. Similarly, graduates in further study excludes those
in work and further study.
A similar percentage of IB CP graduates (74%) and BTEC graduates (75%) were in work. A higher proportion of IB
CP graduates (11%) were engaged in further study than BTEC graduates (6%).
Figure 20 UK domiciled full-time first degree graduates by entry qualification, domicile
and activity, 2017/18
IB CP BTEC
74% 75%
Work
(30) (24,335)
Work and further 5% 8%
study (0) (2,760)
11% 6%
Further study
(5) (1,855)
8% 6%
Unemployed
(5) (2,015)
3% 5%
Other
(0) (1,600)
Due to the small numbers of IB CP course graduates, any analysis by subject area has been omitted.
How do they perform in comparison with BTEC students? | Descriptive comparison of IB CP and BTEC holders | 24Occupations and industries of employed graduates
As part of the Graduate Outcomes survey, graduates are asked to describe the type of jobs they are doing and the
industry they are working in. This information is then analysed to derive the Standard Industrial Classifications
(SIC) and Standard Occupational Classifications (SOC) of each graduate.
Figure 21 shows the industry of employment of IB CP and BTEC graduates. The most popular industries for IB CP
graduates are split out, with the others grouped together. The chart shows that the industry which graduates are
employed in varies between and within entry qualifications.
Figure 21 UK domiciled full-time first degree graduates entering employment by industry
and entry qualification, 2017/18
IB CP BTEC
18% 12%
Education
(5) (2,915)
Professional, scientific and 14% 8%
technical activities (5) (1,990)
Public administration and 14% 4%
defence; compulsory social
(5) (955)
security
Financial and insurance 11% 3%
activities (5) (830)
Wholesale and retail trade; 11% 13%
repair of motor vehicles
(5) (3,115)
and motorcycles
32% 60%
Other (including unknown)
(10) (14,525)
Figure 22 shows the occupations of IB CP and BTEC graduates. For both entry qualifications, over half of the
graduates were employed in professional occupations or associate professional and technical occupations.
Figure 22 UK domiciled full-time first degree graduates entering employment by
occupation and entry qualification, 2017/18 5
IB CP BTEC
Managers, directors and 4%
senior officials (1,015)
24% 28%
Professional occupations
(5) (6,530)
Associate professional and 28% 30%
technical occupations (5) (6,805)
Administrative and 8% 8%
secretarial occupations (0) (1,915)
4% 2%
Skilled trades occupations
(0) (475)
Caring, leisure and other 8% 9%
service occupations (0) (2,005)
Sales and customer 12% 10%
service occupations (5) (2,305)
Process, plant and 4% 1%
machine operatives (0) (215)
12% 7%
Elementary occupations
(5) (1,665)
5 ‘0’ figures in the chart show the HESA rounding strategy has been applied to the data (any number lower than 2.5
is rounded to 0).
How do they perform in comparison with BTEC students? | Descriptive comparison of IB CP and BTEC holders | 25Summary
Care should be taken when making comparisons between IB CP and BTEC students and identifying trends
in analysis due to instances of small number of IB CP students, qualifiers and leavers.
Student cohorts
All students in the report were UK domiciled first year, full-time, students enrolled on a first degree course at a UK
HE provider. The following summarises the findings for IB CP and BTEC students in 2014/15-2018/19 combined.
• Between 2014/15 and 2018/19, there were a total of 535 IB CP students identifiable in the HESA data. A small
number of students (50) were identified in 2014/15, this increased in 2018/19 to 145. The number of IB CP
students identifiable in the HESA data is far lower than their equivalent BTEC students. There were 87,505
BTEC students in 2014/15 increasing to 88,530 in 2018/19.
• 50% of IB CP students were female which was the same for BTEC students.
• Given the IB CP qualification was launched in the County of Kent, 58% of IB CP students were domiciled from
the South East and 19% were domiciled from London. The remaining 23% were from different regions
including the West Midlands (6%), Yorkshire and the Humber (6%), the North West (7%) and East of England
(4%). BTEC students were more spread around the UK; London (18%) followed by the North West (14%), the
South East (12%), the West Midlands (12%), Yorkshire and The Humber (10%), the East of England (8%), the
East Midlands (7%) and the South West (7%).
• The majority of IB CP and BTEC students were white (IB CP 77%, BTEC 66%). A higher proportion of IB CP
students came from a higher socio-economic background (classification 1-3), 55%, than BTEC students, 52%.
A higher proportion of IB CP students were from a low participation neighbourhood, 29%, than BTEC students
17%.
• The most popular location of HE provider for IB CP students was the South East (45%), followed
by London (18%), the North West (8%) and West Midlands (8%). Over three quarters of IB CP students chose
to study in one of these regions. The most popular locations of HE provider for BTEC students were the North
West (15%), London (13%), the South East (12%) and the East Midlands (12%).
• STEM subjects were more popular with BTEC students (43%) than IB CP students (39%). The most popular
subjects of study for IB CP students were business & administrative studies, 18%, and biological sciences,
18%. The most popular subjects studied by BTEC students were business & administrative studies (16%) and
creative art & design (16%).
• 11% of IB CP students left with no award after their first year of study compared to 9% of BTEC students.
Qualifier cohorts
All qualifiers in the report were UK domiciled and had successfully completed a full-time, first degree course at a
UK HE provider. The following summarises the findings for IB CP and BTEC students in 2014/15-2018/19
combined.
• 70% of IB CP qualifiers achieved a first class or upper second class honours degree compared to 66% of
BTEC qualifiers.
• The same proportion (64%) of IB CP and BTEC qualifiers who had studied a STEM subject at HE achieved a
first class or upper second class honours degree. A higher percentage of IB CP qualifiers (73%) gained a first
or upper second class honours compared to BTEC qualifiers (67%).
How do they perform in comparison with BTEC students? | Summary | 26Graduate cohorts
All graduates in the report were UK domiciled and had successfully completed a full-time, first degree course at a
UK HE provider and had completed the HESA Graduate Outcomes survey approx. 15 months later. The following
summarises some of the findings for IB CP and BTEC leavers in 2017/18.
• A similar proportion of IB CP (74%) and BTEC graduates were in work (75%).
• A higher proportion of IB CP graduates (11%) were engaged in further study than BTEC graduates (6%).
• Of those in work by occupation type, over half of both IB CP and BTEC graduates were employed in
professional occupations or associate professional and technical occupations.
How do they perform in comparison with BTEC students? | | 27Appendices
Definitions
Activity
Describes the activity of a graduate in the Graduate Outcomes survey. Work includes those who reported that they
were in full-time employment, part-time employment, an unknown pattern of employment and voluntary or unpaid
work. Work and further study includes those who indicated that they were in employment and further study. Further
study includes those who were in full-time or part-time or unknown pattern of further study. Unemployed includes
those who stated they were unemployed, due to start work or due to start further study. Other includes those who
were taking time out to travel, caring for someone or retired.
BTEC students
BTEC students are those who hold a BTEC qualification on entry to HE. BTEC qualifications (Level 3) are offered
in many schools and further education colleges around the UK and studied by 16-18 year-old students over two
years. They are undertaken in a wide range of vocational subjects including business studies and engineering.
BTEC subject groupings
The below gives an indication of how BTEC subjects were grouped into the IB CP subjects.
Individuals and societies
- Business Studies
- Geography
- History
- Politics
- Social care
Languages
- English language
- English literature
- Various foreign languages
Mathematics
- Computing
- Accounting
- Engineering
- Statistics
- Mathematics
Sciences
- Chemistry
- Physics
- Biology
- Sports science
- Healthcare
The Arts
- Photography
- Drama
- Music
- Art and design
Classification of first degree
The class obtained from first degree qualifications. Certain qualifications obtained at first degree level are not
subject to classification of award, notably medical and general degrees. These, together with ordinary degrees and
aegrotat qualifications have been included within Unclassified. Third class honours, fourth class honours and the
pass have been aggregated as Third class/pass. Lower second and undivided second class honours have been
aggregated as Lower second class.
Continuation status
This has been created for full-time first degree entrants prior to 2018/19 who, where possible, have been linked
forward to the next academic year.
How do they perform in comparison with BTEC students? | Appendices | 28Continuing or qualifying at HE provider- defined as all students who are progressing into their following year of
study at the same HE provider and fall within the HESA student population. It also includes those students who are
not progressing into their following year of study and who have achieved a qualification in one of the two
comparison years with that qualification deemed as being equivalent to or higher than the qualification aimed for.
Gained other award- Those students who are not progressing into their following year of study and who have
achieved a qualification in one of the two comparison years with that qualification deemed as being lower than the
qualification aimed for. Left with no award- Those students who are not continuing into their following year of study
and have not been awarded a qualification in either of the two comparison years. Dormant- Those students who
have not obtained an award and are not active or have dormant or writing-up mode.
Country/ Region of HE provider
The allocation of a HE provider to a geographical region is done by reference to the administrative centre of that
HE provider. Regions in this context are the nine England Regions (formerly Government Office Regions) and
Wales, Scotland and Northern Ireland. There may be students registered at HE providers who are studying in
regions other than that of the administrative centre of the HE provider.
Domicile
Indicates the location of the student's permanent or home address prior to entry to the course. UK domicile
students are those whose normal residence is in the UK, and for the purposes of this report includes Guernsey,
Jersey and the Isle of Man. Other European Union domiciled students are those whose normal residence prior to
commencing their programme of study was in countries which were European Union (EU) members as at 1
December of the reporting period. EU countries includes Austria, Belgium, Bulgaria, Cyprus, Czech Republic,
Denmark, Estonia, Finland, France, Germany, Gibraltar, Greece, Hungary, Ireland, Italy, Latvia, Lithuania,
Luxembourg, Malta, Netherlands, Poland, Portugal, Romania, Slovakia, Slovenia, Spain and Sweden. Where
European Union countries are shown separately, individual country figures exclude those domiciled in the Åland
Islands, the Canary Islands, and the French overseas departments of French Guiana, Guadeloupe, Martinique and
Réunion. These figures are included in European Union not otherwise specified. Other Europe includes Albania,
Andorra, Armenia, Azerbaijan, Belarus, Bosnia and Herzegovina, Croatia, Cyprus (Non-European-Union), Faroe
Islands, Georgia, Kosovo, Macedonia, Moldova, Monaco, Montenegro, Russia, San Marino, Serbia, Svalbard and
Jan Mayen, Switzerland, Turkey, Ukraine, Vatican City and Europe not otherwise specified.
Ethnicity
Students domiciled in England, Wales, Scotland, Northern Ireland, Guernsey, Jersey and the Isle of Man are
required to report their ethnic origin. Data on the ethnicity of students has therefore been restricted to UK domiciled
students. The coding frame is that recommended by the Office for National Statistics (ONS) for UK-wide data
collection.
White includes White, White - Scottish, Irish Traveller, Gypsy or Traveller, plus Other White background.
Black includes Black or Black British - Caribbean, Black or Black British - African, and other Black background.
Asian includes Asian or Asian British - Indian, Asian or Asian British - Pakistani, Asian or Asian British -
Bangladeshi, Chinese, and other Asian background.
Other includes Arab, plus other ethnic background.
Mixed includes mixed - White and Black Caribbean, mixed - White and Black African, mixed - White and Asian,
other mixed background
Not known includes not known and information refused. BME includes all non-white categories excluding not
known.
First degree
First degrees (including eligibility to register to practice with a health or social care or veterinary statutory regulatory
body), first degrees with Qualified Teacher Status (QTS)/registration with a General Teaching Council (GTC),
enhanced first degrees, first degrees obtained concurrently with a diploma and intercalated first degrees.
Full-time students
Those normally required to attend an HE provider for periods amounting to at least 24 weeks within the year of
study, on thick or thin sandwich courses, and those on a study-related year out of their HE provider. During that
How do they perform in comparison with BTEC students? | Definitions | 29You can also read