Interpretable Model Based on Pyramid Scene Parsing Features for Brain Tumor MRI Image Segmentation
←
→
Page content transcription
If your browser does not render page correctly, please read the page content below

Hindawi
Computational and Mathematical Methods in Medicine
Volume 2022, Article ID 8000781, 10 pages
https://doi.org/10.1155/2022/8000781

Research Article
Interpretable Model Based on Pyramid Scene Parsing Features for
Brain Tumor MRI Image Segmentation

          Mingyang Zhao ,1 Junchang Xin ,2,3 Zhongyang Wang ,1 Xinlei Wang ,2
          and Zhiqiong Wang 1,4,5
          1
            College of Medicine and Biological Information Engineering, Northeastern University, Shenyang 110169, China
          2
            School of Computer Science and Engineering, Northeastern University, Shenyang 110169, China
          3
            Key Laboratory of Big Data Management and Analytics (Liaoning Province), Northeastern University, Shenyang 110169, China
          4
            Institute of Intelligent Healthcare Technology, Neusoft Corporation, Ltd., Shenyang 110179, China
          5
            Acoustics Science and Technology Laboratory, Harbin Engineering University, Harbin 150001, China

          Correspondence should be addressed to Junchang Xin; xinjunchang@mail.neu.edu.cn

          Received 8 October 2021; Accepted 15 January 2022; Published 31 January 2022

          Academic Editor: Luminita Moraru

          Copyright © 2022 Mingyang Zhao et al. This is an open access article distributed under the Creative Commons Attribution
          License, which permits unrestricted use, distribution, and reproduction in any medium, provided the original work is
          properly cited.

          Due to the black box model nature of convolutional neural networks, computer-aided diagnosis methods based on depth learning
          are usually poorly interpretable. Therefore, the diagnosis results obtained by these unexplained methods are difficult to gain the
          trust of patients and doctors, which limits their application in the medical field. To solve this problem, an interpretable depth
          learning image segmentation framework is proposed in this paper for processing brain tumor magnetic resonance images. A
          gradient-based class activation mapping method is introduced into the segmentation model based on pyramid structure to
          visually explain it. The pyramid structure constructs global context information with features after multiple pooling layers to
          improve image segmentation performance. Therefore, class activation mapping is used to visualize the features concerned by
          each layer of pyramid structure and realize the interpretation of PSPNet. After training and testing the model on the public
          dataset BraTS2018, several sets of visualization results were obtained. By analyzing these visualization results, the effectiveness
          of pyramid structure in brain tumor segmentation task is proved, and some improvements are made to the structure of
          pyramid model based on the shortcomings of the model shown in the visualization results. In summary, the interpretable brain
          tumor image segmentation method proposed in this paper can well explain the role of pyramid structure in brain tumor image
          segmentation, which provides a certain idea for the application of interpretable method in brain tumor segmentation and has
          certain practical value for the evaluation and optimization of brain tumor segmentation model.

1. Introduction                                                         very high performance in various CAD systems [10–14], the
                                                                        complexity of these machine learning models is often greatly
The results of brain tumor image segmentation can clearly show          increased in order to improve the accuracy. Complex models
the category, location, and volume of lesion areas [1, 2]. There-       represented by CNN can extract image features through
fore, introducing an automatic image segmentation model into            multilevel abstract reasoning to deal with the very complex
the computer-aided diagnosis (CAD) system for brain tumor               relationship between dependent variables and independent
images can reduce the workload of doctors [3]. As a result,             variables, which can achieve very high accuracy. However,
the research on brain tumor image segmentation methods has              this complex feature extraction method not only improves
become a hotspot, so more and more brain tumor image seg-               the accuracy of the model but also leads to the inability to
mentation methods [4–6] have been proposed.                             know the relationship between the prediction results gener-
    Although some image segmentation frameworks [7–9]                   ated by the model and all the features extracted by CNN,
based on convolutional neural networks (CNN) have shown                 making CNN a black box model that is difficult for human
2                                                                     Computational and Mathematical Methods in Medicine

beings to understand [15]. After ResNet was proposed, the              The remainder of this paper is structured as follows. In
depth of CNN increased significantly from the original,             Section 2, the method is described in detail, including the
making the already incomprehensible model even more                brain tumor image segmentation module based on PSPNet
inexplicable. Therefore, only result-oriented evaluation cri-      and the interpretation module based on GradCAM. Section
teria such as accuracy rate and error rate can be used to eval-    3 describes the experimental process and result comparison
uate the credibility of the model, which is unreliable [16].       in detail, including experiments on segmentation and exper-
    Because CNN is a black box model, the CAD system               iments on interpretability. And a series of discussions are
based on CNN cannot give the diagnosis basis while giving          carried out on the interpretability experiments. In Section
the diagnosis results, which leads to the unreliable diagnosis     4, a conclusion is drawn.
results [17]. Therefore, such a diagnosis method lacking
human-computer interaction is difficult to be affirmed by              2. Methods
doctors and patients [18]. At the same time, such CAD
methods may also make wrong diagnosis when the instru-             2.1. Overview. The processing method for brain tumor MRI
ment is subjected to some disturbances that are difficult to         images under this framework includes an image segmenta-
be detected by human beings but will affect the diagnosis           tion module using PSPNet [9] and an interpretation module
results, causing serious consequences [19]. This phenome-          using GradCAM [27]. The process is shown in Figure 1. In
non seriously hinders the practical application of CNN in          the image segmentation module, CNN is used to extract fea-
CAD and other fields with high reliability requirements [20].       tures from the input brain tumors MRI images. After that,
    Although the CNN model has high complexity, it is not          global context information can be constructed from these
inexplicable. Using the interpretation model can improve           CNN features by using the pyramid pool structure in
the transparency of the black box model and give the judg-         PSPNet, which can be used to establish global scene analysis
ment basis of the model in a way that human beings can             on the feature map of the last layer of CNN. Then, through
understand [21]. The methods for interpreting the model            the upsampling operation of convolution layer, the segmen-
can be divided into ante-hoc and post-hoc [22]. Among              tation results of MRI images of brain tumors are obtained.
them, the post hoc method can explain the training results         At the same time, in the interpretation module, GradCAM
of the model, which is of great significance [23].                  is used to visualize the global context scene analysis informa-
    Therefore, it is particularly important for the practical      tion constructed in pyramid pooling structure. As a feature
application of CNN in CAD field to explain the CNN model            visualization method based on gradient information, Grad-
to improve its reliability [24–26]. With the continuous            CAM assigns weights to each neuron according to the gradi-
development of research in the field of deep learning, some         ent information flowing into the last convolution layer of
special architectures are often embedded in the newly pro-         CNN to extract the specific semantic information retained
posed CNN model as an improvement of the model. Taking             by each neuron. In this way, GradCAM can obtain the fea-
the PSPNet used in this paper as an example, the PSP struc-        tures concerned by CNN and display these features on the
ture is used to parse the scene context in the model. How-         original image in the form of heat map as a visualization of
ever, it is difficult to verify whether such a special               CNN. By analyzing the visualization results of GradCAM
architecture can play a role in the corresponding tasks, and       and the image segmentation results of PSPNet, the interpre-
it can only be evaluated by improving the accuracy of pre-         tation of the segmentation model can be obtained.
diction results. Although the introduced special model archi-      2.2. Using PSPNet for Brain Tumor MRI Image
tecture can usually improve the accuracy, these complex            Segmentation. For an input brain tumor MRI image, the
structures may lead to overfitting, which makes the model           process of image segmentation in PSPNet is shown in
achieve high accuracy on the test set, but it does not have        Figure 2.
the corresponding generalization and cannot be put into                Firstly, the pretrained residual network ResNet is used to
practical application. Therefore, it is necessary to verify the    extract the features of brain tumor from the image. ResNet
reasons for the improvement of accuracy and ensure the rel-        consists of a set of residual modules, which can learn resid-
evance between the model and the task. Therefore, the inter-       uals to prevent gradient explosion and overfitting phenom-
mediate results of PSP structure in PSPNet are visualized, so      ena caused by the increasing of depth. For each residual
that the reasoning process of CNN model can be seen to             module, setting the input of the residual module as x and
users. The GradCAM method visualizes the attention of              the output of the residual module as y. Then, the definition
the model to features in the way of heat map and uses it to        of a residual block can be obtained:
generate intermediate results in the process of model predic-
tion, which is suitable for analyzing the prediction process of
the model. In this paper, an interpretable brain tumor image                          y = F ðx, fW i gÞ + W s x,              ð1Þ
segmentation framework is proposed. In the framework,
PSPNet is used to segment brain tumor images, and the              where the function Fðx, fW i gÞ represents the learned resid-
visualization method based on GradCAM is used to explain           ual mapping and W s means matching x and y when the
the pyramid structure in PSPNet. The visualization results         number of channels is different.
obtained from it prove the ability of pyramid structure to             After the feature extraction of the last convolution layer
extract multiscale features. Based on the visualization results,   in ResNet, the obtained feature map is sent to the PSP-
some adjustments have been made to the pyramid structure.          Module. The processing of features in PSP-Module is
Computational and Mathematical Methods in Medicine                                                                                     3

                                                                                 Upsampling with
                                                                                                                Segmentation results
                                                                                 convolution layer
                                                     Pyramid
            Brain tumor         Feature
                                                      pooling
            MRI images         extraction
                                                     structure
                                                                                Visualization Based                Interpretable
                                                                                  on Grad-CAM                   segmentation results

                          Figure 1: The process of interpretable segmentation for brain tumors MRI image.

                                                                 CONV

                                                                 CONV

                                                                                        UPSAMPLE
                    CNN                POOL                                                                          CONV
                                                                 CONV

                                                                 CONV
                                                                                                      CONCATE

                                                                          PSP-Module

                                 Figure 2: Using PSPNet for brain tumor MRI image segmentation.

divided into four stages, which are used to analyze the con-            visualization on the context features obtained by the final
text information in the CNN features. In each stage, pooling            concatenation.
kernels with sizes of 1 × 1, 2 × 2, 3 × 3, and 6 × 6 are used to            Although the high complexity of PSPNet model usually
pool the feature map. The pooling result of the feature map             requires a large GPU memory and takes a long time to train
is used as the representation of four different scale-level sub-         a high-precision model, it takes little time and computa-
regions, and then, these feature maps need to be                        tional effort to visualize the PSPNet model by GradCAM.
concatenated. However, since pooling layers of different                 GradCAM uses gradient to calculate the heat map during
sizes are used in each stage, the sizes of feature maps that            the prediction process of the model. Therefore, GradCAM
output by each stage are also inconsistent, making it impos-            does not need to modify the structure of the original model
sible to directly concatenate these feature maps. Therefore,            or retrain the model, so it can quickly get visual results for
in the PSP-Module, after the pooling layer of each stage, a             analysis.
1 × 1 convolution layer is used to reduce the dimension of
the output of the pooling layer, and then, four feature maps
                                                                        2.3.1. Visualization on the CNN Features. For the CNN fea-
with the same size as the original feature map are obtained
                                                                        tures extracted by ResNet from brain tumors MRI images,
by interpolation. Therefore, different levels of features are
                                                                        GradCAM can be directly used to visualize them, which is
concatenated to obtain the final pyramid pool features,
                                                                        shown in Figure 4. In brain tumor segmentation using
which carry both local and global context information.
                                                                        PSPNet, the model will focus on the category of brain tumor,
    For the context information obtained by PSP-Module,
                                                                        while the neurons contained in the last convolution layer in
three deconvolution layers are used to upsample the feature
                                                                        ResNet retain semantic information for identifying this cat-
map. Finally, these feature maps are input into a 1 × 1 con-
                                                                        egory. GradCAM can be used to assign weights to each neu-
volution layer to obtain the final pixel-by-pixel prediction
                                                                        ron in this convolution layer according to gradient
results for brain tumors and complete the segmentation of
                                                                        information flowing into it. The semantic information in
brain tumor MRI images.
                                                                        these neurons determines whether ResNet can successfully
                                                                        identify the category of brain tumors, and these weights rep-
2.3. Using GradCAM to Interpret the Model. In order to                  resent how much influence each neuron can make on the
explain the PSPNet segmentation model trained with brain                decisions given by ResNet. In order to calculate these
tumors MRI images, the processing of visual interpretation              weights, the class of brain tumor is set as C, and then yc is
using GradCAM is applied on it, which is shown in                       the semantic information for ResNet to judge the class as
Figure 3. The visualization process on the PSPNet can be                C. In GradCAM, the gradient information of yc to feature
mainly divided into the visualization on the CNN features,              map Ak is calculated by back propagation, which is ∂yc /∂
the visualization on the four multiscale features, and the              Ak . Then, the global-average-pooling is carried out on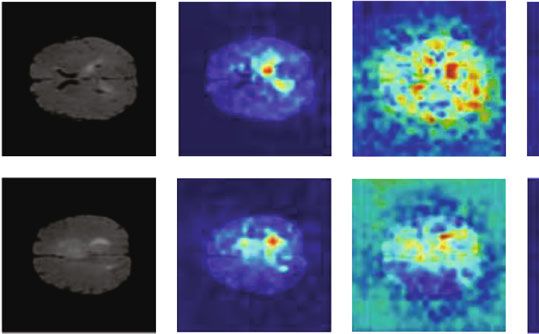
4                                                                                                       Computational and Mathematical Methods in Medicine

                                                                                        1×1

                                                                                                                   UPSAMPLE
                                                                                        2×2
                   CNN                                       POOL                                                                                                     CONV
                                                                                        3×3

                                                                                        6×6

                           Visualization on CNN features             Visualization on four multi-scales features              Visualization on PSP context features

                                                         Figure 3: Using GradCAM to interpret PSPNet.

                                      ResNet                        Feature maps

                                                                                                     a1c
                                                                                                     a2c

                                                                      Gradients                      ...                      +               ReLU
                                                                                                           c
                                                                                                    an-1
                                                                                                     anc

                                              Figure 4: Visualization on the CNN features using GradCAM.

gradient information in the width and height dimensions                                          GradCAM method can realize visual interpretation of
(indexed by i and j, respectively) of the feature map Ak . So                                    CNN features extracted from the model without modifying
the weight of the kth neuron for class C is obtained, which                                      and retraining the PSPNet model.
is αck :
                                                                                                 2.3.2. Visualization on the Four Multiscale Features. The
                   global average pooling                                                        visualization result of CNN features is only to draw a certain
                       1                             ∂yc
           αck =         〠 〠                                          :             ð2Þ          area on the original image with thermal map, which lacks
                       Z i j                         ∂Akij                                       specific and useful semantic information and is difficult to
                                                     |{z}                                        summarize into concepts that human beings can under-
                                            gradients via backprop                               stand. Such a simple explanation result makes the model
                                                                                                 which is still a black box, which has limited significance for
     Next, weighted linear fusion is performed on the feature                                    brain tumor segmentation. Therefore, GradCAM needs to
maps in all neurons with these weights. Then, ReLU is per-                                       be used to visualize the features with context semantics in
formed on the fusion results to activate the feature map                                         PSP-Module, so that the model can be interpreted with more
which has a positive impact on the brain tumor category                                          specific feature information. The process of visualization on
concerned by the ResNet model, thereby obtaining the                                             the PSP-Module features using GradCAM is shown in
class-discriminative localization map of Grade-CAM, which                                        Figure 5.
is LcGradCAM :                                                                                       In PSP-Module, in order to extract global context infor-
                                                                                                 mation from CNN features of brain tumors extracted by
                                                                                               ResNet, the process of extracting multiscale features is
              LcGradCAM = ReLU 〠k αck Ak :                                          ð3Þ          divided into four stages. Therefore, it is necessary to use
                                            |fflfflfflfflfflfflfflffl{zfflfflfflfflfflfflfflffl}                                 GradCAM to visualize the results of CNN features in the
                                         linear combination                                      four stages, so as to verify that each stage can extract features
                                                                                                 of different scales accordingly and contribute to the context
    Therefore, by using gradient information to calculate,                                       features finally concatenated by PSP-Module. By visualizing
Computational and Mathematical Methods in Medicine                                                                                          5

                              CNN Feature maps              Pooling            1×1 conv

                                     +                                        Interpolation

                              PSP Feature maps

                                                      a1c
                                                      a2c
                                  Gradients           ...             +         ReLU
                                                            c
                                                     an-1
                                                      anc

                                   Figure 5: Visualization on the PSP-Features using GradCAM.

                                                                                Table 1: The comparison of the segmentation results.
the PSP-Features, more detailed interpretation results can be
obtained from it than from the visualization of CNN                                              WT                   TC               ET
features.
                                                                          UNet                  0.2979              0.3410         0.2812
    GradCAM itself is proposed to explain the process of
extracting CNN features, so it can visualize the features                 PSPNet                0.4719              0.3763         0.2886
extracted by ResNet in the interpretation of brain tumor seg-
mentation However, in PSP-Module, GradCAM cannot be
directly used to visualize these four multiscale features,                modes, including T1, T2, Flair, and T1ce. Flair is used for
because practical visualization results cannot be obtained                WT and TC segmentation, and T1ce is used for ET segmen-
through such processing. In PSP-Module, through the pro-                  tation. The data of each modality of each case is a 3D MRI
cess of pooling and interpolation to filter the information,               image with sizes of (155, 240, and 240). The 3D brain MRI
only the CNN features at the current scale are retained in                images are cut into 155 2D images, and the gray-scale value
each stage. After that, the process of concatenating the orig-            of the ground truth (GT) is used as the threshold to separate
inal CNN features and the CNN features at a certain scale is              the GT of the three segmentation targets. In the experiment,
equivalent to weighting the original CNN features at a cer-               PSPNet is used for brain tumor image segmentation, and
tain scale. This model design makes these CNN features at                 dice coefficient between GT and segmentation result is taken
a certain scale show practical significance only when they                 as optimization objective and evaluation index:
are fused with the original CNN features, and it is difficult
to be visualized separately. Therefore, the visualization of                                           2jX ∩ Y j + smooth
                                                                                              Dice =                        ,           ð4Þ
multiscale features is replaced by an equivalent way. In each                                          jX j + jY j + smooth
stage, the CNN features at this scale are fused with the orig-
inal CNN features, and then, the fused features are visualized            where smooth = 1:0, X is GT, and Y is the segmentation result.
by GradCAM, so that the visualization on the four multi-
scale features can be obtained.                                           3.2. Experiments on Segmentation. In order to get consistent
                                                                          and clear segmentation results, whole tumor lesion is chosen
2.3.3. Visualization on the PSP Context Features. For the                 as the segmentation target, which is more convenient for anal-
context features obtained by concatenated in PSP-Module,                  ysis and more suitable for the visual interpretation. Addition-
GradCAM is used to visualize them directly, which is similar              ally, in order to explain the model from multiple angles
to those described in Section 2.3.1. Combined with the fea-               including good results and poor results and leave a certain
tures extracted from ResNet and the visualization results of              space for the improvement ideas based on the interpretation
multiscale features under the four stages in the pyramid                  results, the experiment uses few iterations and small batch size
structure, the visual interpretation of the multiscale feature            to limit the performance of the segmentation model in a cer-
fusion process of PSPNet can be realized.                                 tain extent. Therefore, in the experiment, batch size is set to
                                                                          8 and epoch is set to 10. In addition, all the experiments use
3. Experiments                                                            the learning-rate of 10−4 and the drop rate of 0.01. The com-
                                                                          parison of the segmentation results is shown in Table 1.
3.1. Datasets. The public brain tumor segmentation dataset
BRATS2018 [28] was used in the experiment. Three seg-                     3.3. Experiments on Interpretation
mentation targets are set in the dataset according to the type            3.3.1. Explanation on the Validity of Pyramid Structure
of the tumor region, including whole tumor (WT), tumor
core (TC), and enhancing tumor (ET). The dataset contains                 (1) Visualization of Pyramid Structure. In order to illustrate
351 cases, and each case contains data collected in four                  the effectiveness of pyramid structure, the input and output,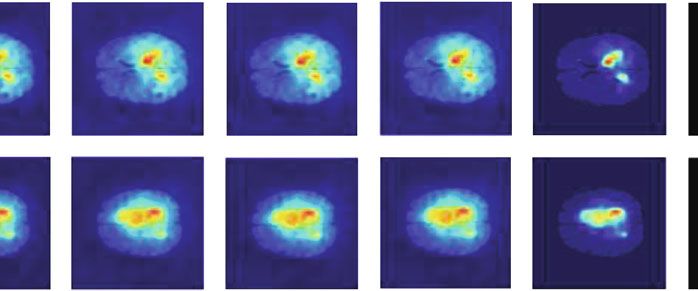
6                                                                          Computational and Mathematical Methods in Medicine

                (a)

                (b)

                (c)

                (d)

                      Input   CNN-Features   1×1         2×2        3×3        6×6     PSP-Features   Output      GT

Figure 6: Four groups are selected from the visualization results of PSPNet for analysis, including the ones with poor segmentation
performance (a, b) and the ones with good segmentation performance (c, d). Among them, 1 × 1, 2 × 2, 3 × 3, and 6 × 6, respectively,
represent the visualization of the pooling results under the four feature scales, while PSP-Features represents the fusion results of the
four pooling scales in PSPNet.

as well as the intermediate results of pyramid structure, are         convolution layers can extract high-level semantic features,
visualized. The experimental results are shown in Figure 6,           the features have nothing to do with both the label and out-
which visualizes and compares the poor and the good seg-              put, which have no positive effect on tumor segmentation.
mentation result, respectively. As shown in the figure, the            This result proves that although UNet can extract and fuse
visualization results of different scales show consistency in          multiscale features with the U-shape structure, the multi-
easily identified tumor core parts, while focusing on different         scale feature structure of PSPNet is much better than that
regions in other details. For example, the 3 × 3 pooling in           of UNet in the heat map of GradCAM, and the segmentation
Figure 6(a) and the 6 × 6 pooling in Figure 6(b) are both             result of PSPNet is indeed better than that of UNet.
focused on the bottom right region of the tumor. In contrast,
other stages of the pyramid model pay less attention to this          3.3.2. Analysis on the Segmentation Error
area and pay more attention to other areas. By comparing
the visualization results and the label, it can be concluded          (1) Interpretation and Analysis of Segmentation Errors. In
that these regions are the lesions. Therefore, these stages           addition to explaining the performance of pyramid struc-
make their contribution to the final concatenated features             ture, it is necessary to study the reason of segmentation error
as shown in the PSP-Features in the figure. The experimental           in the experiment. As shown in the visualization results of
result interpretably proves that the pyramid structure can            PSPNet in Figure 8, the visualization result of PSP-Features
extract features of different scales from the input image by           is similar to GT and Output in the case of good segmenta-
pooling the extracted features in multiple dimensions and             tion. However, in the case of poor segmentation, the visual-
then concatenate these features to obtain the final multiscale         ization result of PSP-Features is more similar to GT. It can
features. The output obtained by concatenated features is             be suspected that this phenomenon leads to the fact that
also very close to the label of the input image, which proves         most lesion areas are not accurately identified and seg-
the effectiveness of pyramid structure on extracting multi-            mented in images with poor segmentation results. The
scale features in an interpretable way. Therefore, introducing        PSP-Module feature maps contain these lesion regions in a
the pyramid structure into the model does have a positive             certain extent. However, the visualization results of the fea-
effect on the performance improvement of the model.                    ture maps output by PSP-Module include these lesion
                                                                      regions to a certain extent, but the extracted relevant features
(2) Comparison between PSPNet and UNet. Similar to multi-             are sparse due to reasons such as insufficient obvious fea-
scale feature structure of PSPNet, UNet [8] also has the abil-        tures of the lesion regions, resulting in errors in the follow-
ity to extract multiscale features, so the performances and           ing pixel-level segmentation process. This defect of the
visualization results of the two models are also compared             model makes it difficult to recognize and segment these
in the experiment. According to the multiscale structure              brain tumor images accurately.
characteristics of UNet, a visualization method similar to
PSPNet is adopted, which is interpreted based on Grad-                    In order to understand and analyze this phenomenon,
CAM. The visualization results are shown in Figure 7.                 this paper uses an evaluation method to further evaluate it
Through observation, it can be found that only conv_1 layer           quantitatively. Use PSNR between PSP-Features and Out-
is the most similar to label in the multiscale feature extrac-        put, PSP-Features, and GT to measure whether the visualiza-
tion process of UNet, which affects the segmentation results           tion result of PSP-Features is more similar to Output or GT.
through horizontal connection structure. Although other               Therefore, it is necessary to binarize the heat map of PSP-
Computational and Mathematical Methods in Medicine                                                                                                7

                 Input        Conv_1        Conv_2            Conv_3       Conv_4          Conv_5   UNet-Output      GT       PSPNet-Output

                                          Figure 7: Visual interpretation of multiscale features of UNet.

                           PSP-Features        Output               GT          PSP-Features          Output            GT
                                                 (a)                                                      (b)

Figure 8: Comparison of PSPNet visualization results with output and label is divided into the groups with poor performance (a) and good
performance (b).

Table 2: Comparison of PSNR between PSP-Features and Output, PSNR between PSP-Features, and GT under binarization treatment with
different thresholds.

Threshold          0.05             0.10               0.15              0.20             0.25            0.30         0.35           0.40    0.45
Output             12.57           14.49               15.93            17.39             18.87        20.21          21.28          21.54    21.45
GT                 13.34           15.46               16.96            18.28             19.03        18.98          18.53          17.90    17.38

                               psnr(dB)

                                  24

                                  22

                                  20

                                  18

                                  16

                                  14

                                  12

                                  10
                                              0.1                 0.2               0.3             0.4           threshold
                                               Output
                                               GT

Figure 9: Comparison of PSNR between PSP-Features and Output, PSNR between PSP-Features, and GT under binarization treatment with
different thresholds.

Features. By using different thresholds to limit the range of                    tion process with the weights in CNN features to simulate
features selected from the heat map, multiple groups of                         the heat map that can be obtained when the weights of all
PSP-Features processed by binarization are obtained. Then,                      features are increased in PSP-Features and quantify the
PSP-Features processed by binarization is used to calculate                     effect of increasing the weights on the segmentation results.
the PSNR value with Output and GT, respectively, and take                           Comparing the data in the table and the statistical chart,
the average value to obtain the data shown in Table 2, which                    it can be found that when it is close to the initial weight of
is plotted as shown in Figure 9. This evaluation method                         the features in the heat map, which means threshold = 0:45
makes it possible to correlate the threshold in the binariza-                   , it is more similar between PSP-Features and GT than
8                                                                                    Computational and Mathematical Methods in Medicine

                  Input      CNN-Features           1×1         2×2         3×3           6×6       PSP-Features       Output       GT

                  Input      CNN-Features           1×1         2×2         3×3           6×6       PSP-Features       Output       GT

                                           Figure 10: Visual interpretation of the weighted pyramid structure.

            (a)

            (b)

                    Input   CNN-Features      1×1         2×2         3×3    6×6         8×8      12×12     PSP-Features   Output    GT

                            Figure 11: Visualization result of increasing the number of stages in pyramid structure.

PSP-Features and Output. However, as the threshold                                0.5702. The visualization results are shown in Figure 10. It
decreases, the weights of other features in the heat map grad-                    can be observed that increasing the weight of the scale
ually increase, and PSP-Features gradually becomes more                           through the concatenated features can make the feature
similar to Output from being similar to GT. Especially when                       map which is much closer to GT, thus obtaining better seg-
the threshold is reduced to 0.25, the PSNR of PSP-Features                        mentation results. Similarly, it is not difficult to find that the
and GT reaches the highest and starts to be higher than that                      color of these regions in the heat map tends to be brighten
of PSP-Features and Output. This situation shows that at                          after weighting, and the segmentation result is also greatly
this threshold, the features of PSP-Features are the most                         improved. After the comparison of visualization results
similar to GT and more similar than Output. If the subse-                         and the improvement of segmentation effect, it can be con-
quent processing can be performed with the PSP-Features                           sidered that increasing the weight of these feature scales is
under this threshold, better segmentation results can be                          beneficial to improve the accuracy of brain tumor
obtained. Therefore, it can be considered that PSPModule                          segmentation.
can extract the inconspicuous features of these areas and
locate these focus areas to a certain extent. However, due                        3.3.3. Analysis on the Structure of PSPNet
to the defects of the model, there are problems in pixel rec-
ognition of these areas, and this defect can be improved by                       (1) The Number of Scales in Multiscale Features. Considering
increasing the weight of features.                                                the improvement of feature fusion results by increasing the
                                                                                  weight of scales according to feature extraction ability, it is
(2) Improvement and Optimization Based on Visualization.                          considered that the influence of changing the number of
Since the segmentation errors in PSPNet, an idea can be                           scales on feature fusion and segmentation results should also
applied to improve the pyramid structure to improve its per-                      be paid attention to as another improvement idea. There-
formance. Because the multiscale features extracted by some                       fore, in order to find a more suitable number of feature
stages of the pyramid structure are better in the visualization                   dimensions in the pyramid structure, some attempts are
results, the weights of these scales are increased in the exper-                  made to change the model by increasing or decreasing the
iment, which makes them have more influence on the output                          number of scales to control the extracted features, thus seek-
results of pyramid structure. It can be considered that 2 × 2                     ing to improve the performance of the model. The visualiza-
and 3 × 3 are similar to GT, but the fusion process dilutes                       tion results of this experiment are shown in Figure 11.
these features, resulting in darker colors and poor feature                       Increasing the number of scales makes the pooling scales
concentration in the heat map under the segmentation error                        into [1–3, 6, 8, 12], respectively. According to the visualiza-
in Figure 8(a). Increasing their weights can fill this deficiency                   tion results, it is considered that increasing the number of
and provide more appropriate scene analysis ability. How-                         scales will make the pyramid structure’s ability to extract
ever, the characteristics of 1 × 1 and 6 × 6 are less important                   multiscale features invalid, and the features extracted by
in comparison but still need to be preserved. Therefore, in                       each scale tend to be consistent, resulting in a decline in
the experiment, the ratio of 1 × 1, 2 × 2, 3 × 3, and 6 × 6                       model performance. However, reducing the number of
was set to 1 : 2 : 2 : 1. After increasing the weight of the 2 × 2                scales makes the pooling scales into 2 × 2 and 3 × 3, respec-
and 3 × 3 stage in PSPNet, the dice coefficient rises to                            tively. Observing the visualization results of each scale and
Computational and Mathematical Methods in Medicine                                                                                           9

                          (a)

                          (b)

                                Input   CNN-Features    2×2         3×3       PSP-Features   Output        GT

                        Figure 12: Visualization result of decreasing the number of stages in pyramid structure.

feature fusion in Figure 12, it can be found that reducing            Acknowledgments
scales will make the pooled features of each scale scattered,
unable to focus on the target tumor itself, and also make             This research was partially supported by the National Natu-
the pyramid model invalid. This problem leads to the inabil-          ral Science Foundation of China (No. 62072089), the Funda-
ity to clearly locate the outline of tumor in the result of fea-      mental Research Funds for the Central Universities (Nos.
ture fusion. Therefore, the segmentation visualization results        N2019007,      N2116016,       N2104001,      N180101028,
show that scale = 4 is the best number of dimensions of pyr-          N180408019, and N2024005-2), and the Open Program of
amid structure. Increasing or decreasing the number of                Neusoft Corporation (No. NCBETOP2102).
scales on this basis will have a negative impact on the feature
extraction ability of pyramid structure model.                        References
(2) Overfitting Problem of Pyramid Structure. In the process               [1] P. K. Chahal, S. Pandey, and S. Goel, “A survey on brain tumor
of model training with 6 stages, it is inevitable that the multi-             detection techniques for MR images,” Multimedia Tools and
scale features extracted in each scale tend to be consistent,                 Applications, vol. 79, no. 29-30, pp. 21771–21814, 2020.
which means that the multiscale feature structure tends to                [2] Z. A. Al-Saffar and T. Yildirim, “A hybrid approach based on
be overfitted. In order to increase the number of training                     multiple eigenvalues selection (MES) for the automated grad-
iterations and apply various methods to improve the model                     ing of a brain tumor using MRI,” Computer Methods and Pro-
and at the same time ensure the effectiveness of extracting                    grams in Biomedicine, vol. 201, p. 105945, 2021.
multiscale features from pyramid structure, it may be neces-              [3] P. Ghosal, T. Chowdhury, A. Kumar, A. K. Bhadra,
                                                                              J. Chakraborty, and D. Nandi, “MhURI:a supervised segmen-
sary to introduce a penalty function based on visualization
                                                                              tation approach to leverage salient brain tissues in magnetic
results in the training process. When the scale features                      resonance images,” Computer Methods and Programs in Bio-
extracted by pyramid structure are basically the same, it is                  medicine, vol. 200, p. 105841, 2021.
urged to extract other neglected features to limit the overfit-            [4] B. Chen, L. Zhang, H. Chen, K. Liang, and X. Chen, “A novel
ting degree of the model.                                                     extended Kalman filter with support vector machine based
                                                                              method for the automatic diagnosis and segmentation of brain
                                                                              tumors,” Computer Methods and Programs in Biomedicine,
4. Conclusion                                                                 vol. 200, p. 105797, 2021.
                                                                          [5] P. Singh, “A type-2 neutrosophic-entropy-fusion based multi-
In this paper, a visualization-based interpretation method is                 ple thresholding method for the brain tumor tissue structures
proposed to explain the image segmentation network based                      segmentation,” Applied Soft Computing, vol. 103, p. 107119,
on the multiscale feature model, which is used to segment                     2021.
MRI images of brain tumors. After training and testing the                [6] G. Karayegen and M. F. Aksahin, “Brain tumor prediction on
model on the public brain tumor MRI image dataset, the                        MR images with semantic segmentation by using deep learn-
interpretation results prove the effectiveness of the pyramid                  ing network and 3D imaging of tumor region,” Biomedical Sig-
structure, and a series of experiments are carried out based                  nal Processing and Control, vol. 66, p. 102458, 2021.
on the interpretation results to improve the performance of               [7] E. Shelhamer, J. Long, and T. Darrell, “Fully convolutional net-
pyramid structure.                                                            works for semantic segmentation,” IEEE Transactions on Pat-
                                                                              tern Analysis and Machine Intelligence, vol. 39, no. 4, pp. 640–
                                                                              651, 2017.
                                                                          [8] O. Ronneberger, P. Fischer, and T. Brox, “U-net: convolutional
Data Availability                                                             networks for biomedical image segmentation,” in Medical
                                                                              Image Computing and Computer-Assisted Intervention – MIC-
The data used to support the findings of this study are                        CAI 2015. MICCAI 2015, N. Navab, J. Hornegger, W. Wells,
included within the article.                                                  and A. Frangi, Eds., vol. 9351 of Lecture Notes in Computer
                                                                              Science, Springer, Cham, 2015.
                                                                          [9] H. Zhao, J. Shi, X. Qi, X. Wang, and J. Jia, “Pyramid scene pars-
Conflicts of Interest                                                         ing network,” in Proceedings of the IEEE Conference on Com-
                                                                              puter Vision and Pattern Recognition (CVPR), pp. 6230–
The authors declare that they have no conflict of interest.                    6239, Honolulu, HI, USA, 2017.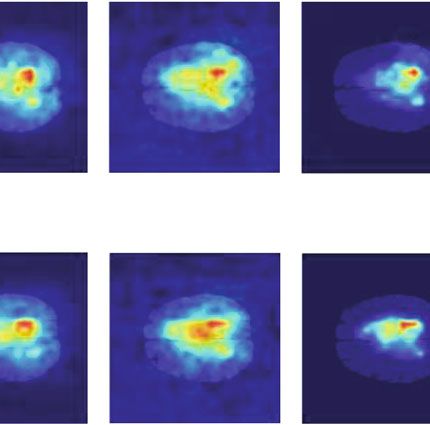
10                                                                           Computational and Mathematical Methods in Medicine

[10] J. Sun, Y. Peng, Y. Guo, and D. Li, “Segmentation of the mul-            and surgical planning,” International Journal of Computer
     timodal brain tumor image used the multi-pathway architec-               Assisted Radiology and Surgery, vol. 15, no. 5, pp. 847–857,
     ture method based on 3D FCN,” Neurocomputing, vol. 423,                  2020.
     pp. 34–45, 2021.                                                    [27] B. Zhou, A. Khosla, A. Lapedriza, A. Oliva, and A. Torralba,
[11] X. Zhu, Z. Cheng, S. Wang, X. Chen, and G. Lu, “Coronary                 “Learning deep features for discriminative localization,” in
     angiography image segmentation based on PSPNet,” Com-                    Proceedings of the IEEE Conference on Computer Vision and
     puter Methods and Programs in Biomedicine, vol. 200,                     Pattern Recognition (CVPR), pp. 2921–2929, Seattle, WA,
     p. 105897, 2021.                                                         USA, 2016.
[12] M. Aledhari and R. Razzak, “An adaptive segmentation tech-          [28] B. H. Menze, A. Jakab, S. Bauer et al., “The Multimodal Brain
     nique to detect brain tumors using 2D Unet,” in 2020 IEEE                Tumor Image Segmentation Benchmark (BRATS),” IEEE
     International Conference on Bioinformatics and Biomedicine               Transactions on Medical Imaging, vol. 34, no. 10, pp. 1993–
     (BIBM), pp. 2328–2334, Seoul, Korea (South), 2020.                       2024, 2015.
[13] Z. Zhou, M. M. Rahman Siddiquee, N. Tajbakhsh, and J. Liang,
     “UNet++: redesigning skip connections to exploit multiscale
     features in image segmentation,” IEEE Transactions on Medi-
     cal Imaging, vol. 39, pp. 1856–1867, 2019.
[14] L. Tan, W. Ma, J. Xia, and S. Sarker, “Multimodal magnetic
     resonance image brain tumor segmentation based on ACU-
     net network,” IEEE Access., vol. 9, pp. 14608–14618, 2021.
[15] R. Guidotti, A. Monreale, S. Ruggieri, F. Turini, D. Pedreschi,
     and F. Giannotti, “A survey of methods for explaining black
     box models,” ACM Computing Surveys (CSUR), vol. 51,
     pp. 1–42, 2018.
[16] Q. Zhang, W. Wang, and S. C. Zhu, Examining CNN represen-
     tationswith respect to dataset bias, AAAI, New Orleans, LA,
     USA, 2017.
[17] Q. Pan, L. Zhang, M. Jia et al., “An interpretable 1D convolu-
     tional neural network for detecting patient- ventilator asyn-
     chrony in mechanical ventilation,” Computer Methods and
     Programs in Biomedicine, vol. 204, p. 106057, 2021.
[18] T. Miller, “Explanation in artificial intelligence: insights from
     the social sciences,” Artificial Intelligence, vol. 267, pp. 1–38,
     2019.
[19] A. Kurakin, I. Goodfellow, and S. Bengio, “Adversarial exam-
     ples in the physical world,” 2017, http://arxiv.org/abs/1607
     .02533.
[20] A. J. Banegas-Luna, J. Peña-García, A. Iftene et al., “Towards
     the interpretability of machine learning predictions for medi-
     cal applications targeting personalised therapies: a cancer case
     survey,” International Journal of Molecular Sciences, vol. 22,
     no. 9, p. 4394, 2021.
[21] X. Huang, D. Kroening, W. Ruan et al., “A survey of safety and
     trustworthiness of deep neural networks: verification, testing,
     adversarial attack and defence, and interpretability,” Computer
     Science Review, vol. 37, p. 100270, 2020.
[22] E. M. Kenny, C. Ford, M. Quinn, and M. T. Keane, “Explaining
     black-box classifiers using _post-hoc_ explanations-by-exam-
     ple: the effect of explanations and error-rates in XAI user stud-
     ies,” Artificial Intelligence, vol. 294, p. 103459, 2021.
[23] Z. C. Lipton, “The mythos of model interpretability,” Commu-
     nications of the ACM, vol. 61, no. 10, pp. 36–43, 2018.
[24] P. Natekar, A. Kori, and G. Krishnamurthi, “Demystifying
     brain tumor segmentation networks: interpretability and
     uncertainty analysis,” Frontiers in Computational Neurosci-
     ence, vol. 14, pp. 1–12, 2020.
[25] S. M. Thomas, J. G. Lefevre, G. Baxter, and N. A. Hamilton,
     “Interpretable deep learning systems for multi-class segmenta-
     tion and classification of non-melanoma skin cancer,” Medical
     Image Analysis, vol. 68, p. 101915, 2021.
[26] A. Jiménez-Sánchez, A. Kazi, S. Albarqouni et al., “Precise
     proximal femur fracture classification for interactive training
You can also read