URBAN TRAFFIC FLOW ANALYSIS BASED ON DEEP LEARNING CAR DETECTION FROM CCTV IMAGE SERIES - ISPRS Archives
←
→
Page content transcription
If your browser does not render page correctly, please read the page content below
The International Archives of the Photogrammetry, Remote Sensing and Spatial Information Sciences, Volume XLII-4, 2018
ISPRS TC IV Mid-term Symposium “3D Spatial Information Science – The Engine of Change”, 1–5 October 2018, Delft, The Netherlands

 URBAN TRAFFIC FLOW ANALYSIS BASED ON DEEP LEARNING CAR DETECTION
                      FROM CCTV IMAGE SERIES

                                            M. V. Peppa 1 *, D. Bell 1, T. Komar1, W. Xiao 1

                             1   School of Engineering, Newcastle University, Newcastle upon Tyne, UK -
                                     (maria-valasia.peppa, d.bell5, tom.komar, wen.xiao)@ncl.ac.uk

                                                      Commission IV, WG IV/6

KEY WORDS: Computer vision, machine learning, tensorflow, traffic monitoring, CCTV big data, infrastructure management

ABSTRACT:

Traffic flow analysis is fundamental for urban planning and management of road traffic infrastructure. Automatic number plate
recognition (ANPR) systems are conventional methods for vehicle detection and travel times estimation. However, such systems are
specifically focused on car plates, providing a limited extent of road users. The advance of open-source deep learning convolutional
neural networks (CNN) in combination with freely-available closed-circuit television (CCTV) datasets have offered the opportunities
for detection and classification of various road users. The research, presented here, aims to analyse traffic flow patterns through fine-
tuning pre-trained CNN models on domain-specific low quality imagery, as captured in various weather conditions and seasons of
the year 2018. Such imagery is collected from the North East Combined Authority (NECA) Travel and Transport Data, Newcastle
upon Tyne, UK. Results show that the fine-tuned MobileNet model with 98.2% precision, 58.5% recall and 73.4% harmonic mean
could potentially be used for a real time traffic monitoring application with big data, due to its fast performance. Compared to
MobileNet, the fine-tuned Faster region proposal R-CNN model, providing a better harmonic mean (80.4%), recall (68.8%) and
more accurate estimations of car units, could be used for traffic analysis applications that demand higher accuracy than speed. This
research ultimately exploits machine learning alogrithms for a wider understanding of traffic congestion and disruption under social
events and extreme weather conditions.

                    1. INTRODUCTION                                    1.2 Related work

1.1 Background                                                         Recent studies have adopted various deep learning neural
                                                                       network systems for traffic analysis. For example Tang et al.
Traffic monitoring and analysis are crucial for an efficient urban     (2017) adapted a single shot multibox detector (SSD) to extract
planning and management of road traffic infrastructure. An             the location and orientation of cars from aerial imagery. Wang
ideal monitoring system would measure traffic movement,                et al. (2017) used a region proposal convolutional neural
density and interactions as well as predict disruption and             network (R-CNN) to classify vehicle types from images of
congestion in order to mitigate hazards for a safe functional          camera sensors which were set up at crossroads. These neural
infrastructure.                                                        network systems consist of multiple neurons with learnable
                                                                       filters, which are activated after processing an input image using
Traditionally, inductive loops embedded in road’s surface and          various convolutional operations (e.g. gradients, blobs, edge
automatic number plate recognition (ANPR) systems are                  filters etc.) in combination with fundamental learnable variables
utilised for vehicle detection and travel times estimation (Li,        (weights and biases). The trained network of neurons can
2008). However, ANPR systems do not always offer an overall            localise specific types of features at any spatial position of the
extent of road users due to specific focus on recognising              input image.
characters in car plates and discarding candidate detections if
car plate is not fully recognised (Buch et al., 2011). Such            Today’s architecture of convolutional neural networks (CNNs)
limitations have been overcome with the use of state-of-the-art        was firstly introduced in 1990s by LeCun et al. (1989) to
open-source deep learning technologies (Shi et al., 2017)              recognise handwritten numbers. This architecture was improved
alongside the freely-available closed-circuit television (CCTV)        more recently by Krizhevsky et al. (2012), using large
datasets, enabling training of models for detection and                benchmark image datasets collected from the web. Further
classification of various road users as well as traffic monitoring     improvements led to state-of-the-art CNNs of better
and prediction (Lv et al., 2015). Big data analytics from CCTV         performance with the introduction of region proposals creating,
image series can provide substantial knowledge of urban traffic        among others, for example the faster region based convolutional
flow behaviour. Number of cars, constituting a main parameter          neural network (Faster R-CNN; Ren et al. (2017)). R-CNN
in traffic analysis, can be estimated at various time scales from      segments each convolutional layer using a sliding window into
spatially heterogeneous CCTV locations. This type of multi-            proposed regions which contain the predicted location of
scale spatiotemporal observations supports understanding of            multiple anchor boxes of different sizes and scales per object. A
traffic congestion before, during and after a disruptive event.        global optimisation refines the predicted box location with the
                                                                       aid of regression algorithms. In comparison, SSD, introduced

* Corresponding author

                                               This contribution has been peer-reviewed.
                     https://doi.org/10.5194/isprs-archives-XLII-4-499-2018 | © Authors 2018. CC BY 4.0 License.                     499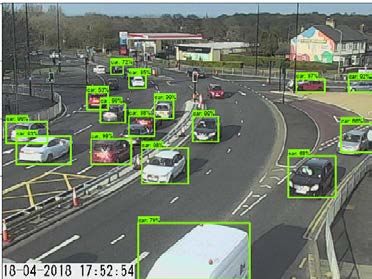
The International Archives of the Photogrammetry, Remote Sensing and Spatial Information Sciences, Volume XLII-4, 2018
ISPRS TC IV Mid-term Symposium “3D Spatial Information Science – The Engine of Change”, 1–5 October 2018, Delft, The Netherlands

by Liu et al. (2016), utilises anchor boxes to locate a feature by    the second set included three tests (Table 3 and 4) to evaluate
dividing an input image into grids and using multiple                 the performance of SSD MobileNet V1 COCO, Faster R-CNN
convolution layers of various scales and aspect ratios (Liu et al.,   COCO and KITTI pre-trained models as fine-tuned on domain-
2016; Tang et al., 2017). A mobile architecture of SSD, named         specific imagery. Such local imagery used to aid optimising the
MobileNet (Howard et al., 2017), was specifically designed for        performance of deep learning classifiers. It should be noted that
mobile processing in real time applications.                          various settings required to configure the deep learning process
                                                                      (e.g. image resolutions, intersection over union (IoU) threshold,
Various open-source benchmark image datasets with manually            loss function, number of convolution layers, number of region
labelled features have contributed to the advance of the              proposals, filter shapes and sizes, biases, weights etc.) were kept
aforementioned deep learning neural network systems (Gauen et         as default, based on the configurations of pre-trained models
al., 2017). Two of such benchmarks were used here, namely a)          (Rathod et al., 2018). Finally, traffic flow behaviour was
Common Objects in Context (COCO; Lin et al. (2014)) and b)            analysed using the fine-tuned models which provided the fastest
Karlsruhe Institute of Technology and Toyota Technological            and most precise performance.
Institute at Chicago Object Detections (KITTI; Geiger et al.
(2012)). COCO is a dataset introduced by Microsoft and                2.1 First experimental set
consists of 80 common objects in a 2.5 million labelled images
from the natural environment (Lin et al., 2014; Gauen et al.,         In particular, in the first experimental set of tests to train the
2017). KITTI contains datasets from urban environment                 deep learning classifiers and validate classification results, 550
captured from a car driven around the city of Karlsruhe (Geiger       images were sampled from NECA on different days, varying
et al., 2012). Over the last few years, these datasets have been      times, different weather conditions and various CCTV sensors
used to train the aforementioned deep learning neural network         around the city, including datasets with noise. Such noise is
systems with the scope to establish open-to-the-public models         typically caused by sensor moving/swaying, direct sun rays,
from out-of-the-box frozen graph inferences (Rathod et al.,           reflected sun rays, image blur/saturation and material on the
2018). These can ultimately expedite and facilitate object            lens (Buch et al., 2011). Hence, this selection would reduce a
detection and classification for various applications.                likelihood of bias in neural network training. 500 images were
                                                                      used for training and 50 images for evaluation. 2140 cars were
1.3 Aim                                                               manually identified, labelled with bounding boxes and
                                                                      organised in appropriate formats for the training process. 384
The study aims to analyse traffic flow pattern using long time        cars detected in the 50 images, served as ground truth
CCTV image series. It focuses on testing pre-trained state-of-        observations for assessing post training model performance. The
the-art deep learning neural network systems for car detection        tests in the first experiment were undertaken with 20,000
from low quality images captured in various environmental             training epochs. 500 images were used for all tests in Table 2
conditions. This analysis ultimately exploits machine learning        with the exception of test 6 and 7. 250 images were used for test
alogrithms for a wider understanding of the traffic behaviour         6, whereas no fine-tuning performed for test 7.
variations under social events and extreme weather conditions.
                                                                      2.2 Second experimental set
                    2. METHODOLOGY
                                                                      In the second experimental set two comparisons between the
The study presented here investigates the implementation of           SSD MobileNet V1 COCO, Faster R-CNN COCO and KITTI
deep learning methods for car detection in CCTV datasets of the       fine-tuned models were performed. Firstly, a comparison after
North East Combined Authority (NECA) Travel and Transport             fine-tuning with 20,000 and 40,000 training epochs and
Data (NECA, 2018b), Newcastle upon Tyne, UK. Traffic counts           secondly a comparison after fine-tuning with 500 images and
are analysed on imagery from two sets of dates and two key            then with 700 images. These tests aimed to evaluate the post-
locations that connect the city centre with southern and northern     training model performance after longer training with a larger
suburbs. First analysis was performed at A167 High Street,            training local image dataset. The 500 images were identical to
Tyne Bridge, Gateshead (NECA, 2018c) on Saturday 21st and             those used for training in the first experimental set. Additional
Saturday 28th of April 2018. The latter is the date of a football     200 images were sampled from NECA and Urban Observatory
match event. Second analysis was performed on 26-28th of              (UO; UO (2018)). These included images with views of roads
February 2018, that is before and during a snow event, taken on       outside the city centre and from dates with higher rainfall than
A193 Newbridge Street Roundabout where a CCTV sensor                  the aforementioned 500 images. Roads of different speed
monitors the traffic over a part of the A167 Central Motorway         categorisation were also considered (e.g. motorways, regional
(NECA, 2018a). Results from February were compared against            roads etc.). To identify rainy days, observations from UO were
traffic patterns analysed on 09-11th of July 2018 with sunny and      obtained (James et al., 2014). Weather conditions of the
dry weather conditions, retrieved from the same CCTV sensor           selected dates for the 700 images are reported in Table 1.
location. Traffic flow was finally estimated on a daily-basis on
09-17th of July 2018 from the same CCTV sensor location in             No of
                                                                                Weather conditions         Time of day          Date
order to compare the traffic pattern between weekend and              images
working days.                                                             30 Cloudy without rain       Morning, midday    28/01/2018
                                                                         138    Very snowy             Early afternoon    01/03/2018
Experiments were undertaken on two types of supervised neural            137    Snowy, dark             Late evening      03/03/2018
network systems, namely the SSD and the Faster R-CNN, as                 137  Snowy, overcast              Midday         04/03/2018
adopted in TensorFlow deep learning framework (Shi et al.,                                                                15/03/2018
                                                                        138        Dry, sunny          Late afternoon
2017). Two sets of experiments were conducted, as follows: a)                                                             17/03/2018
the first set included seven tests (Table 2) to optimise relevant       120      Overcast, rainy       Morning-Night      16/03/2018
parameters such as learning rate and number of images used for         Table 1. 700 images extracted from NECA and UO, used for
fine-tuning SSD MobileNet V1 COCO (Rathod et al., 2018); b)                       training the deep learning classifiers.

                                                This contribution has been peer-reviewed.
                      https://doi.org/10.5194/isprs-archives-XLII-4-499-2018 | © Authors 2018. CC BY 4.0 License.                    500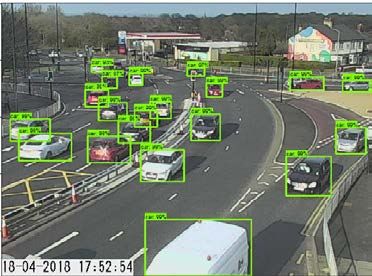
The International Archives of the Photogrammetry, Remote Sensing and Spatial Information Sciences, Volume XLII-4, 2018
ISPRS TC IV Mid-term Symposium “3D Spatial Information Science – The Engine of Change”, 1–5 October 2018, Delft, The Netherlands
A variety of weather conditions were selected mainly during In test 7, as no training with NECA images was performed, the
March 2018. Hence, the deep learning classifiers were trained initial pre-trained model suffered from both poor precision and
with domain-specific imagery of spectral heterogeneity. This recall. This indicates the importance of further training already
additional dataset also resulted in a better spatial distribution of pre-trained systems with images from a local urban environment
CCTV sensors around the extended area of Newcastle upon as it enhances the neural network performance. Among all tests
Tyne. In total 3676 cars were manually identified and labelled test 1 provided the best indices with a greater number of true
from the 700 images. positives and a smaller number of false negatives. Based on
these findings, a learning parameter of 0.0001 was set up for all
Moreover, 50 images, different from those used in the first remaining tests in the presented research.
experimental set, were selected for evaluation, with 381 cars
identified. These images were obtained from NECA and UO 3.2 Second experimental set
databases at various times during rainy and snowy days, also
different from those of the training dataset used in the first The second experimental set was performed on a computing
experimental set. Specifically, the selected images were platform with characteristics as follows: NVIDIA Quadro
captured on 27/02/2018, 02/04/2018, 18/04/2018 and P5000, CPU E3 – 1535M v6 @3.10GHz with 64GB RAM. The
02/06/2018. This ground truth dataset also included cases with hours required for training are recorded in Table 3. The
cropped images showing parts of the field of view from CCTV description of the neural network pre-trained models are also
sensors. This is a common issue possibly due to electronics presented in Table 3. It should be noted that no other process
faults of the CCTV sensor, usually occurring during extreme was running while training with the exception of evaluation and
weather conditions. visualisation on TensorBoard (TensorBoard, 2018).
TensorBoard constitutes a platform to monitor the training of
Initial pre-trained neural network checkpoints were retrieved deep learning classifier with the aid of graphs. It also shows the
from Rathod et al. (2018) and used for training at all detectors performance on selected images during training. These
experiments. After training, fine-tuned neural network processes might have consumed part of the computing memory
checkpoints at 20000 and 40000 epochs were extracted and usage as they were performed simultaneously alongside
utilised for performance evaluation with the aid of ground truth training.
of the 50 aforementioned images. For this evaluation three
indices were calculated, namely: a) precision which indicates
[seconds/image]
No of images
Post training
/epochs [K]
the percentage of identified cars (i.e. true positives) out of the
evaluation
Training
[hours]
Model
total number of all identified features (i.e. true and false
positives); b) recall which indicates the percentage of identified Description
cars out of the total number of cars manually identified (i.e. true
positives and false negatives); and c) harmonic mean (F) which
is calculated based on Equation 1, as seen below: A SSD MobileNet V1 COCO 500/20 8 1.4
B Faster R-CNN ResNet 101 COCO 500/20 3.7 7.3
precision ⋅ recall C Faster R-CNN ResNet 101 KITTI 500/20 3 7.2
F =2 (1)
precision + recall A SSD MobileNet V1 COCO 500/40 15.7 1.4
B Faster R-CNN ResNet 101 COCO 500/40 10.7 7.2
3. RESULTS C Faster R-CNN ResNet 101 KITTI 500/40 12.2 7.2
A SSD MobileNet V1 COCO 700/20 8 1.4
3.1 First experimental set B Faster R-CNN ResNet 101 COCO 700/20 4 7.3
C Faster R-CNN ResNet 101 KITTI 700/20 6 7.3
Results derived from the first experimental set are summarised A SSD MobileNet V1 COCO 700/40 15.7 1.4
in Table 2. In terms of the learning rate parameter, which B Faster R-CNN ResNet 101 COCO 700/40 6.5 7.2
regulates the training process, values lower than 0.01 provided C Faster R-CNN ResNet 101 KITTI 700/40 12.2 7.3
better performance. Precision and recall degraded when half of
Table 3.Details of training time [hours] and evaluation time
the images were used for training, as evidenced in test 6
(Table 2). [seconds] with the 50 images of the second experimental set.
As seen in Table 3 Faster R-CNN ResNet models were trained
False positives
False negatives
True positives
Precision (%)
Learning rate
Recall (%)
much faster than SSD MobileNet especially for 20000 epochs.
parameter
Identified
features
F (%)
For these epochs the larger image dataset (700) did not
Test
significantly affected the training duration, apart from Faster R-
CNN ResNet 101 KITTI. This model required double the time
when training with 700 images. However, double training
1 0.0001 256 246 10 138 96.1 64.1 76.9 epochs resulted in double time for deep learning with the
2 0.001 252 242 10 142 96.0 63.0 76.1 exception of Faster R-CNN ResNet 101 COCO pre-trained
3 0.01 258 237 21 147 91.9 61.7 73.8 model. Surprisingly, this model required only 6 and a half hours
4 0.1 0 0 0 384 0 0 0 for training with 700 images at 40000 epochs whereas the other
5 0.004 210 208 2 176 99.0 54.2 70.0 models needed almost double the time.
6 0.0001 242 228 14 156 94.2 59.4 72.8
7 - 183 143 40 241 78.1 37.2 50.4 Table 3 also reports the seconds per image required for car
detection during evaluation of each fine-tuned model. It should
Table 2. Post training evaluation of the first experimental set
be noted that post-training evaluation was performed with CPU
with fine-tuned SSD MobileNet V1 COCO. only. The detection was processed for every single image out of
This contribution has been peer-reviewed.
https://doi.org/10.5194/isprs-archives-XLII-4-499-2018 | © Authors 2018. CC BY 4.0 License. 501
The International Archives of the Photogrammetry, Remote Sensing and Spatial Information Sciences, Volume XLII-4, 2018
ISPRS TC IV Mid-term Symposium “3D Spatial Information Science – The Engine of Change”, 1–5 October 2018, Delft, The Netherlands
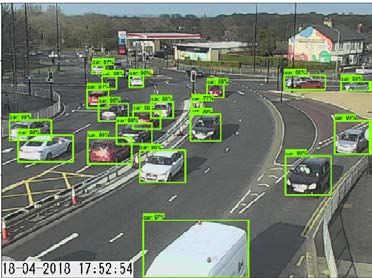
the 50 images, used as ground truth. As opposed to training R-CNN (Figure 1b and 1c), Faster R-CNN ResNet 101 COCO
duration, SSD MobileNet provided the fastest detections. provided more accurate detection as it identified a car which is
Whereas, Faster R-CNN ResNet required approximately five blurred and partly viewed in this particular image.
times longer period than SSD MobileNet for car detection. It is
noteworthy that no significant change on evaluation duration
occurred when COCO or KITTI datasets were used as seen in
Table 3.
Post training evaluation indices of the second experimental set
are presented in Table 4. In particular, models A fine-tuned
from SSD MobileNet V1 COCO provided similar performance (a) SSD MobileNet (500/40, test 2 in Table 4)
regardless of the number of images and epochs used for
training. Surprisingly, no improvement in precision, recall and
harmonic mean was observed when training performed with
more images and for longer period (700/40, test 4 in Table 4).
Among four tests with model A, SSD MobileNet (500/40, test 2
in Table 4) detected more true positives, resulting in the highest
(b) Faster R-CNN ResNet 101 KITTI (700/40, test 4 in Table 4)
precision, with a relatively low number of false positives,
providing the best recall.
False positives
False negatives
True positives
Precision (%)
No of images
/epochs [K]
Recall (%)
Identified
features
Model
F (%)
Test
(c) Faster R-CNN ResNet 101 COCO (700/40, test 4 in Table 4)
A 1 500/20 226 219 7 162 96.9 57.5 72.2
B 500/20 271 254 17 127 93.7 66.7 77.9
C 500/20 253 247 6 134 97.6 64.8 77.9
A 2 500/40 227 223 4 158 98.2 58.5 73.4 (d) Ground truth
B 500/40 242 231 11 150 95.5 60.6 74.2
Figure 1. Car detection example on cropped image with blur.
C 500/40 278 236 42 144 84.9 62.1 71.7
A 3 700/20 222 199 3 131 89.6 52.0 66.0
B 700/20 266 258 8 123 97.0 67.7 79.8 Figure 2 depicts an example of an image captured at night
C 700/20 277 246 31 135 88.8 64.6 74.8 during rainfall resulting in suboptimal lightning conditions and
A 4 700/40 244 213 6 117 87.3 55.9 68.2 noise due to reflections. SSD MobileNet (Model A, test 2
B 700/40 294 277 17 104 94.2 72.7 82.1 500/40 in Table 4) failed to detect the one and only car, whereas
C 700/40 271 262 9 119 96.7 68.8 80.4 both Models B and C (test 4 700/40 in Table 4) succeeded
(Figure 2). The poor performance of SSD MobileNet showed in
Table 4. Post training evaluation of the second experimental set.
the two examples, can be attributed to low complexity
(“shallowness”) of SSD as well as to low exposure in such
Models B fine-tuned from Faster R-CNN ResNet 101 COCO examples with noise on imagery. However, it should be noted
show comparable performance. Precision and recall were that among all tests with model A only SSD MobileNet from
estimated at four tests always over 93% and 60% respectively. test 4 in Table 4 successfully detected this car. This is because
A significant increase in number of true positives and decrease more images of rainy days were added into the initial training
in number of false negatives was observed when longer duration image dataset. (Section 2.2)
training with more images was performed. However, results of
models C fine-tuned from Faster R-CNN ResNet 101 KITTI did
not show such a progressive pattern. Evaluation indices from
test 1 (Model C 500/20) and test 4 (Model C 700/40) provided
comparable values. Among all results from models C, test 4
showed the highest harmonic mean indicating a good balance
between precision and recall.
Evaluation indices in Table 3 showed that Faster R-CNN
(Models B and C) gave a generally better performance than
SSD MobileNet (Models A). This is also evidenced in Figure 1
as more cars were identified with Faster R-CNN (Figure 1b and
1c versus 1a) on images when compared against ground truth
(Figure 1d). This image is partially blurred due to stained
CCTV sensor during rainfall. It also shows only distant objects
as part of the image was not recorded (hence the grey colour in Figure 2. Car detection example during night on a rainy day
the foreground). SSD MobileNet failed to identify small cars. with Faster R-CNN ResNet 101 COCO and KITTI
Moreover, it did not localise the cars’ boxes as precisely as (700/40, test 4 in Table 4).
Faster R-CNN. Between the two models fine-tuned with Faster
This contribution has been peer-reviewed.
https://doi.org/10.5194/isprs-archives-XLII-4-499-2018 | © Authors 2018. CC BY 4.0 License. 502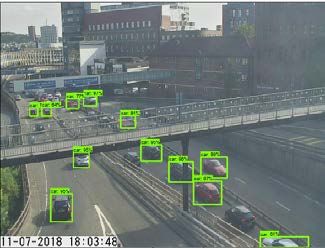
The International Archives of the Photogrammetry, Remote Sensing and Spatial Information Sciences, Volume XLII-4, 2018
ISPRS TC IV Mid-term Symposium “3D Spatial Information Science – The Engine of Change”, 1–5 October 2018, Delft, The Netherlands
A third example of an image with good lighting conditions 3.3 Traffic analysis
during a dry sunny day is shown in Figure 3. Here, it was
expected that zero false positives and negatives would be Based on the findings of the previous two experimental sets,
calculated. However, Faster R-CNN ResNet 101 KITTI traffic analysis was performed from two fine-tuned models,
identified a cone nearby the road as a car, (highlighted with a namely a) SSD MobileNet V1 COCO (Model A, test 3, 500/40
black dotted circle in Figure 3b). Similar errors (e.g. double in Table 4) and b) Faster R-CNN ResNet 101 COCO (Model C,
detection per single car, sensor stain drops detected as car etc.) test 4, 700/40 in Table 4). The former gave the best
were observed in the results for all models fine-tuned with performance among all fastest models (see post training
Faster R-CNN ResNet 101 KITTI (Table 4), regardless of the evaluation in Table 3 and Table 4). The latter provided the
training epochs and number of images. This is also reflected highest precision and recall among all models in Table 4. Faster
with the higher value of false positives in Table 4 compared to R-CNN ResNet 101 KITTI was excluded from the following
those values from all remaining tests. examples, as it did not provide consistent performance in all
tests in Table 4.
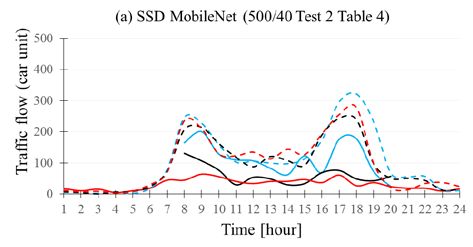
Figure 4 shows traffic behaviour on Saturday, day of a football
match event (28.04.18) and on the previous Saturday (21.04.18)
when no social event was organised in the city. During the
morning (from 07.00 till 12.00) of the date of the football match
the number of cars was gradually increased (as seen in blue in
Figure 4). It should be noted that the football match commenced
at 15.00 on 28.04.18. Whereas in the morning of the previous
Saturday, the number of cars significantly varied (as seen in red
in Figure 4). That day a general sinusoidal pattern indicated cars
driving in and out of the city centre at certain times. This
pattern was not observed on 28.04.18 as it is likely that more
cars were parked in the city centre to watch the football match.
(a) SSD MobileNet (500/40, test 2 in Table 4) However, on both Saturdays a low and high peak at 17.00 and
18.00 were observed respectively. This time coincided with the
end of the football match event as well as with the closure time
of the shopping centre. Both the football stadium and shopping
centre are located in the city centre. Hence, the post-match
peaks on 28.04.18 were partly caused by the finish of football
match and partly by the closure time of the shopping centre.
(b) Faster R-CNN ResNet 101 KITTI (700/40, test 4 in Table 4)
Figure 4. Car unit estimates on Saturday 28.04.18 date of a
football match event and on Saturday 21.04.18 from a NECA
CCTV location (NECA, 2018c).
(c) Faster R-CNN ResNet 101 COCO (700/40, test 4 in Table 4) Regarding the performance of two fine-tuned models, SSD
MobileNet V1 COCO underestimated the car units with a
Figure 3. Car detection example on a dry sunny day. maximum difference from Faster R-CNN ResNet 101 COCO of
82 units at 15.00 and 86 units at 11.00 on 21.04.18 and
In Figure 3a zero false positives were observed with SSD 28.04.18 respectively. Larger offsets between models were
MobileNet, but five false negatives were identified. SSD observed during day time when car estimates were higher than
MobileNet failed to detect small cars in the image background, night time. This is because SSD MobileNet V1 failed to
as also seen in previous examples. This type of error was not precisely distinguish each single car in images with a high car
eliminated even after training with more images and/or epochs. density within a close vicinity (i.e. when the cars are stand-still
and roads are congested).
This contribution has been peer-reviewed.
https://doi.org/10.5194/isprs-archives-XLII-4-499-2018 | © Authors 2018. CC BY 4.0 License. 503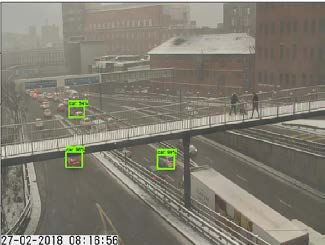
The International Archives of the Photogrammetry, Remote Sensing and Spatial Information Sciences, Volume XLII-4, 2018
ISPRS TC IV Mid-term Symposium “3D Spatial Information Science – The Engine of Change”, 1–5 October 2018, Delft, The Netherlands

Traffic patterns before and during a snow event on 26-28th of       traffic pattern was observed during the weekend on 14-15th of
February as well as during warm and dry weather conditions on       July. High peaks were apparent during midday but with
9-11th of July are depicted in Figure 5. The number of cars was     approximately 200 fewer cars than those estimated on working
signicifcantly reduced from Monday to Wednesday in February         days. Regarding the performance of the two models, fine-tuned
during rush hours, due to snowy conditions. It should be noted      Faster R-CNN outperformed in identifying more cars. An
that the snow event commenced Monday night and continued            average difference of 38 car units across the nine-day
the following days. Few observations in the early morning and       monitoring period was calculated between SSD MobileNet and
late evening were unavailable, as the CCTV sensor was shut          Faster R-CNN.
down. This is a common issue with CCTV technology during
extreme weather conditions. Due to snow, a flat traffic pattern
on Wednesday in February was observed, as opposed to the
pattern on the same day in July with drier weather conditions. In
comparison, high peaks in the early and late afternoons on 9 -
 11th of July indicate the traffic pattern of standard working
hours. Hence, the snow event clearly disrupted the typical daily
traffic behaviour.

                                                                                   (a) Car detection during a blizzard

                                                                           (b) Car detection during rush hour on a summer day

                                                                        Figure 6. Car detection example with fine-tuned SSD
                                                                       MobileNet from a NECA CCTV location (NECA, 2018a).

   Figure 5. Car unit estimates on three consecutive days in
  February (a) before and during a snow event and in July (b)
    during dry warm weather from a NECA CCTV location
                        (NECA, 2018a).

A considerably large difference in number of car unit estimates
is observed during rush hours between results from SSD
MobileNet and Faster R-CNN in Figure 5a and b respectively.
Similar to previous traffic analysis shown in Figure 4, SSD                 Figure 7. Car unit estimates on 9-17th July 2018.
MobileNet underestimated the number of cars. In particular, the
snowy conditions adversely affected object detection
performance, as small cars in the background of the image, seen                            4. DISCUSSION
in Figure 6a, could not be identified. It is also noticeable that
lower than 100 cars were estimated on Wednesday 28.02.18 in         Results from first experimental set have highlighted the
Figure 5a. However, the perfomance of SSD MobileNet was             significance to fine-tune pre-trained deep learning neural
improved on images captured on dry and sunny days, as               network systems with domain-specific imagery (i.e. NECA and
evidenced in Figure 6b.                                             UO CCTV images). Outcomes from the second experimental set
                                                                    have shown that fine-tuned Faster R-CNN performs better than
Nonetheless, both fine-tuned models provided similar flow           SSD MobileNet model even after fine-tuning. This outcome
trends with high peaks in the early morning and late afternoon,     complies with reported findings in a recent study Huang et al.
as also evidenced in Figure 7. These peaks were repetitive          (2017). Neural network systems performance can be improved
across all week days on 9-17th of July. Whereas a different         after fine-tuning with larger image dataset and longer training.

                                               This contribution has been peer-reviewed.
                     https://doi.org/10.5194/isprs-archives-XLII-4-499-2018 | © Authors 2018. CC BY 4.0 License.                504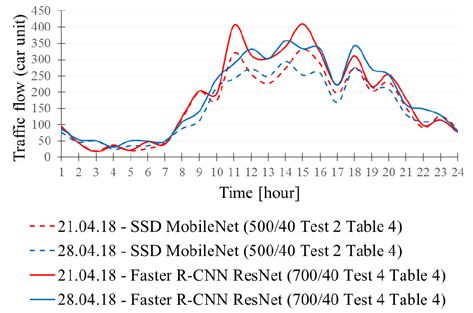
The International Archives of the Photogrammetry, Remote Sensing and Spatial Information Sciences, Volume XLII-4, 2018
ISPRS TC IV Mid-term Symposium “3D Spatial Information Science – The Engine of Change”, 1–5 October 2018, Delft, The Netherlands

In relation to speed, SSD MobileNet model works faster than                                   REFERENCES
Faster R-CNN. This also agrees with reports from previous
studies (Liu et al., 2016; Gauen et al., 2017). However, SSD          Buch, N., Velastin, S. A. and Orwell, J. 2011. A review of
MobileNet provides limited performance in detecting small cars        computer vision techniques for the analysis of urban traffic.
and cars on noisy images. This is possible due to SSD’s               IEEE Transactions on Intelligent Transportation Systems,
receptive field being smaller than R-CNN’s. It should be noted        12(3), pp. 920-939, doi:10.1109/TITS.2011.2119372.
that at all experiments configuration settings for training were
                                                                      Gauen, K., Dailey, R., Laiman, J., Zi, Y., Asokan, N., Lu, Y. H.,
kept unchanged and retrieved from Rathod et al. (2018). Future
                                                                      Thiruvathukal, G. K., Shyu, M. L. and Chen, S. C. 2017.
tests with varying parameterisation (e.g. image input size) can
                                                                      Comparison of visual datasets for machine learning.
potentially improve SSD’s performance.
                                                                      Proceedings - 2017 IEEE International Conference on
                                                                      Information Reuse and Integration, IRI 2017, 2017. pp. 346-
Examples of car unit estimates have shown the variations of
                                                                      355.
traffic patterns on hourly and daily-basis. This analysis can
ultimately support the understanding of traffic disruption and        Geiger, A., Lenz, P. and Urtasun, R. 2012. Are we ready for
congestion before, during and after an extreme weather                autonomous driving? The KITTI vision benchmark suite
condition event or a social event. It can be suggested that the       (http://www.cvlibs.net/datasets/kitti/). 2012 IEEE Conference
fine-tuned MobileNet model with 98.2% precision, 58.5%                on Computer Vision and Pattern Recognition, 16-21 June 2012
recall and 73.4% harmonic mean could potentially be used for a        2012. pp. 3354-3361.
real time traffic analysis with big data. This is because it
provides a trade-off between fast and precise performance             Howard, A. G., Zhu, M., Chen, B., Kalenichenko, D., Wang,
(Model A Test 2 in Table 4). Whereas, Faster R-CNN (Model C           W., Weyand, T., Andreetto, M. and Adam, H. 2017.
Test 4 in Table 4), with a better harmonic mean and recall than       MobileNets: Efficient Convolutional Neural Networks for
MobileNet, of 80.4% and 68.8% respectively, could be used for         Mobile Vision Applications, Computer Research Repository
traffic analysis applications that demand higher accuracy than        (CoRR), Cornell University (https://arxiv.org/abs/1704.04861).
speed (e.g. urban planning and management of road traffic             Huang, J., Rathod, V., Sun, C., Zhu, M., Korattikara, A., Fathi,
infrastructure).                                                      A., Fischer, I., Wojna, Z., Song, Y., Guadarrama, S. and
                                                                      Murphy, K. 2017. Speed/accuracy trade-offs for modern
To better interpret traffic flow behaviour from CCTV datasets         convolutional object detectors. Proceedings - 30th IEEE
with deep learning technology, additional parameters should be        Conference on Computer Vision and Pattern Recognition,
taken into consideration, such as a) environmental conditions as      CVPR 2017, 2017. pp. 3296-3305.
they can introduce noise on imagery, and b) the performance of
each neural network system in terms of precision and speed            James, P. M., Dawson, R. J., Harris, N. and Joncyzk, J. 2014.
even after fine-tuning. Similar traffic analysis is scheduled from    Urban Observatory Weather and Climate data. Newcastle
CCTV sensors of multiple key locations that link the city centre      University, doi:10.17634/154300-20.
with its outskirts. Additional tests will estimate the direction of   Krizhevsky, A., Sutskever, I. and Hinton, G. E. 2012. ImageNet
moving cars in relation to the city centre. This could further        classification with deep convolutional neural networks.
support decision making for stakeholders in case of evacuation        Advances in Neural Information Processing Systems, 2012. pp.
after prediction of an extreme weather event.                         1097-1105.

                     5. CONCLUSIONS                                   LeCun, Y., Boser, B., Denker, J. S., Henderson, D., Howard, R.
                                                                      E., Hubbard, W. and Jackel, L. D. 1989. Backpropagation
Investigations in the presented research have demonstrated the        Applied to Handwritten Zip Code Recognition. Neural
capabilities of state-of-the-art supervised deep learning             Computation, 1(4), pp. 541-551,
algorithms in car detection from CCTV big data for urban              doi:10.1162/neco.1989.1.4.541.
traffic monitoring with low quality datasets. Tests were
performed with imagery captured on days during varying                Li, Y. 2008. Short-term prediction of motorway travel time
environmental conditions and seasons of the year 2018, from           using ANPR and loop data. Journal of Forecasting, 27(6), pp.
two CCTV locations close to Newcastle upon Tyne city centre.          507-517, doi:10.1002/for.1070.
Fine-tuning, with domain specific imagery, of available to-the-       Lin, T. Y., Maire, M., Belongie, S., Hays, J., Perona, P.,
public pre-trained neural network systems, such as SSD                Ramanan, D., Dollár, P. and Zitnick, C. L. 2014. Microsoft
MobileNet V1 COCO and Faster R-CNN ResNet 101 COCO,                   COCO: Common objects in context. Lecture Notes in Computer
optimised traffic flow estimation during disruptive events.           Science (including subseries Lecture Notes in Artificial
Traffic flow analysis is fundamental for urban planning and           Intelligence and Lecture Notes in Bioinformatics).
management of road traffic infrastructure.                            doi:10.1007/978-3-319-10602-1_48.
                                                                      Liu, W., Anguelov, D., Erhan, D., Szegedy, C., Reed, S., Fu, C.
                   ACKNOWLEDGMENTS                                    Y. and Berg, A. C. 2016. SSD: Single shot multibox detector.
                                                                      Lecture Notes in Computer Science (including subseries
This research was funded by the Natural Environment Research          Lecture Notes in Artificial Intelligence and Lecture Notes in
Council (NERC) Flood-PREPARED award (NE/P017134/1;                    Bioinformatics). doi:10.1007/978-3-319-46448-0_2.
https://www.ncl.ac.uk/engineering/research/civil/water/projects/
                                                                      Lv, Y., Duan, Y., Kang, W., Li, Z. and Wang, F. Y. 2015.
flood-prepared.html). The North East Combined Authority
                                                                      Traffic Flow Prediction with Big Data: A Deep Learning
(NECA) Travel and Transport Data are used and published in
                                                                      Approach. IEEE Transactions on Intelligent Transportation
this paper with the permission of the Open Government
                                                                      Systems, 16(2), pp. 865-873, doi:10.1109/TITS.2014.2345663.
License 3.0, Newcastle City Council, 2014, Newcastle upon
Tyne, UK (https://www.netraveldata.co.uk/?page_id=13).

                                                This contribution has been peer-reviewed.
                      https://doi.org/10.5194/isprs-archives-XLII-4-499-2018 | © Authors 2018. CC BY 4.0 License.                  505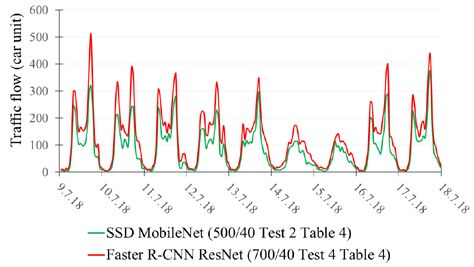
The International Archives of the Photogrammetry, Remote Sensing and Spatial Information Sciences, Volume XLII-4, 2018
ISPRS TC IV Mid-term Symposium “3D Spatial Information Science – The Engine of Change”, 1–5 October 2018, Delft, The Netherlands

NECA, 2018a. CCTV sensor overlooking the A167 Central
Motorway from the A193 Newbridge Street Roundabout
[Online]. Available: https://netrafficcams.co.uk/newcastle-a167-
central-motorway-a193-newbridge-street-roundabout-0
[Accessed: 24 May 2018].
NECA, 2018b. NECA CCTV database [Online]. Available:
https://netrafficcams.co.uk/ [Accessed: 2 February 2018].
NECA, 2018c. NECA CCTV sensor located at A167 High
Street, Tyne Bridge, Gateshead [Online]. Available:
https://www.netrafficcams.co.uk/gateshead-a167-high-street-
tyne-bridge-0 [Accessed: 15 May 2018].
Rathod, V., Pkulzc and Wu, N., 2018. Raw pre-trained
TensorFlow models for various neural network systems
[Online]. Available:
https://github.com/tensorflow/models/blob/master/research/obje
ct_detection/g3doc/detection_model_zoo.md
[Accessed: 15 June 2018].
Ren, S., He, K., Girshick, R. and Sun, J. 2017. Faster R-CNN:
Towards Real-Time Object Detection with Region Proposal
Networks. IEEE Transactions on Pattern Analysis and Machine
Intelligence, 39(6), pp. 1137-1149,
doi:10.1109/TPAMI.2016.2577031.
Shi, S., Wang, Q., Xu, P. and Chu, X. 2017. Benchmarking
state-of-the-art deep learning software tools. Proceedings -
2016 7th International Conference on Cloud Computing and
Big Data, CCBD 2016, 2017. pp. 99-104.
Tang, T., Zhou, S., Deng, Z., Lei, L. and Zou, H. 2017.
Arbitrary-oriented vehicle detection in aerial imagery with
single convolutional neural networks. Remote Sensing, 9(11),
doi:10.3390/rs9111170.
TensorBoard, 2018. TensorBoard: Visualising Deep Learning
[Online]. Available:
https://www.tensorflow.org/guide/summaries_and_tensorboard
[Accessed: 15 February 2018].
UO, 2018. Urban Observatory, weather, climate and traffic
data, generated by Newcastle University [Online]. Available:
http://uoweb1.ncl.ac.uk/ [Accessed: 30 June 2018].
Wang, X., Zhang, W., Wu, X., Xiao, L., Qian, Y. and Fang, Z.
2017. Real-time vehicle type classification with deep
convolutional neural networks. Journal of Real-Time Image
Processing, doi:10.1007/s11554-017-0712-5.

                                               This contribution has been peer-reviewed.
                     https://doi.org/10.5194/isprs-archives-XLII-4-499-2018 | © Authors 2018. CC BY 4.0 License.            506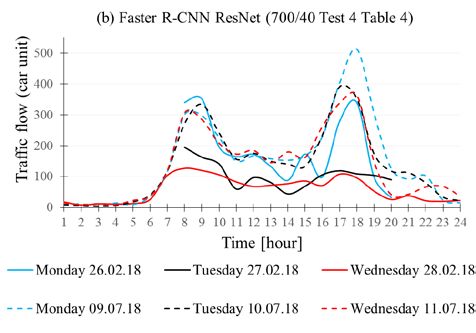
You can also read