IPHC Fishery-Independent Setline Survey (FISS) and commercial data modelling
←
→
Page content transcription
If your browser does not render page correctly, please read the page content below

IPHC-2021-SRB019-05

       IPHC Fishery-Independent Setline Survey (FISS) and commercial data modelling

                                         PREPARED BY: IPHC SECRETARIAT (R. WEBSTER; 21 AUGUST 2021)

                                 Part 1: 2022-24 FISS design evaluation
PURPOSE
To review the 2022-24 FISS designs presented at SRB018 and endorsed by the Scientific
Review Board (SRB) at that meeting.

BACKGROUND
At SRB018, Secretariat staff presented proposed FISS designs for 2022-24 together with an
evaluation of those designs (Webster 2021). Based on the evaluation, it is expected that the
proposed designs would lead to estimated indices of density that would meet bias and precision
criteria. In their report (IPHC-2021-SRB018-R, paragraph 16) the SRB stated:
         The SRB ENDORSED the final 2022 FISS design as presented in Fig. 2, and provisionally
         ENDORSED the 2023-24 designs (Figs. 3 and 4), recognizing that these will be reviewed
         again at subsequent SRB meetings.

PROPOSED DESIGNS FOR 2022-24
The designs proposed for 2022-24 (Figures 1.1 to 1.3) use efficient subarea sampling in IPHC
Regulatory Areas 2A, 4A and 4B, and incorporate a randomized subsampling of FISS stations
in IPHC Regulatory Areas 2B, 2C, 3A and 3B (except for the near-zero catch rate inside waters
around Vancouver Island), with a sampling rate chosen to keep the sample size close to 1000
stations in an average year. This was also used to generate the designs originally proposed for
2020 (but modified as a result of the impact of COVID19 and cost considerations), and for those
proposed and approved for 2021. In 2020, designs for 2022-23 were also approved subject to
revision. We are proposing one change from that 2022 design, bringing forward by one year
(from 2023 to 2022) the sampling of the central and western subareas of IPHC Regulatory Area
4B to reduce the risk of bias in estimates from that area. Thus, we propose that:
   •     In 2022 the lower-density western and central subareas of IPHC Regulatory Area 4B in
         sampled, followed by the higher-density eastern subarea in 2023-24
   •     The higher-density western subarea of IPHC Regulatory Area 4A be sampled in all three
         years, with the medium-density northern shelf edge subarea added in 2023 only
   •     The highest-density waters of IPHC Regulatory 2A in northern Washington and
         central/southern Oregon are proposed for sampling in each year of the 2022-24 period
   •     The near-zero density waters of the Salish Sea in IPHC Regulatory 2B are not proposed
         for sampling in 2022-24
Following this three-year period, it is expected that the remaining subareas will be included
during the subsequent 3-5 years. These include the southeastern subarea of IPHC Regulatory
4A, and lower-density waters of IPHC Regulatory 2A (see below).
The design proposals again include full sampling of the standard FISS grid in IPHC Regulatory
Area 4CDE. The Pacific halibut distribution in this area continues to be of particular interest, as

                                           Page 1 of 43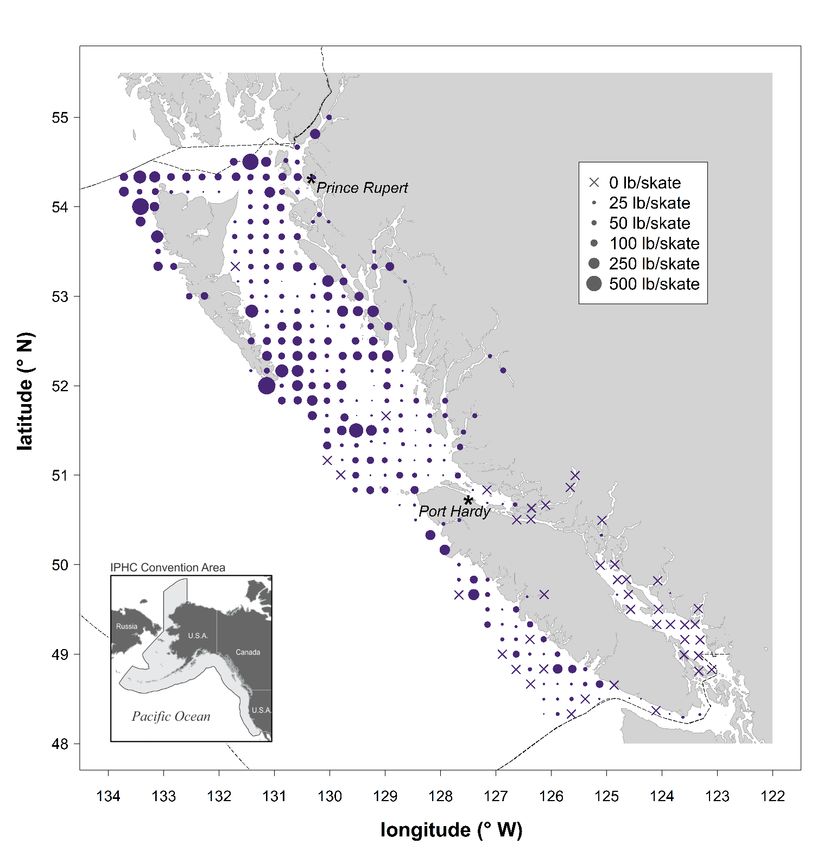
IPHC-2021-SRB19-05

it is a highly dynamic region with an apparently northward-shifting distribution of Pacific halibut,
and increasing uncertainty regarding connectivity with populations adjacent to and within
Russian waters.

RECOMMENDATION
That the Scientific Review Board:
       1) RECOMMEND that the Commission note the SRB endorsement of the proposed 2022
          design (Figure 1.1) and provisional endorsement of the proposed 2023-24 designs
          (Figures 1.2 and 1.3).

References
IPHC 2021. Report of the 18th Session of the IPHC Scientific Review Board (SRB) IPHC-2021-
            SRB18-R.
Webster, R. A. 2021. 2022-24 FISS design evaluation. IPHC-2021-SRB018-05 Rev_1.

                                           Page 2 of 43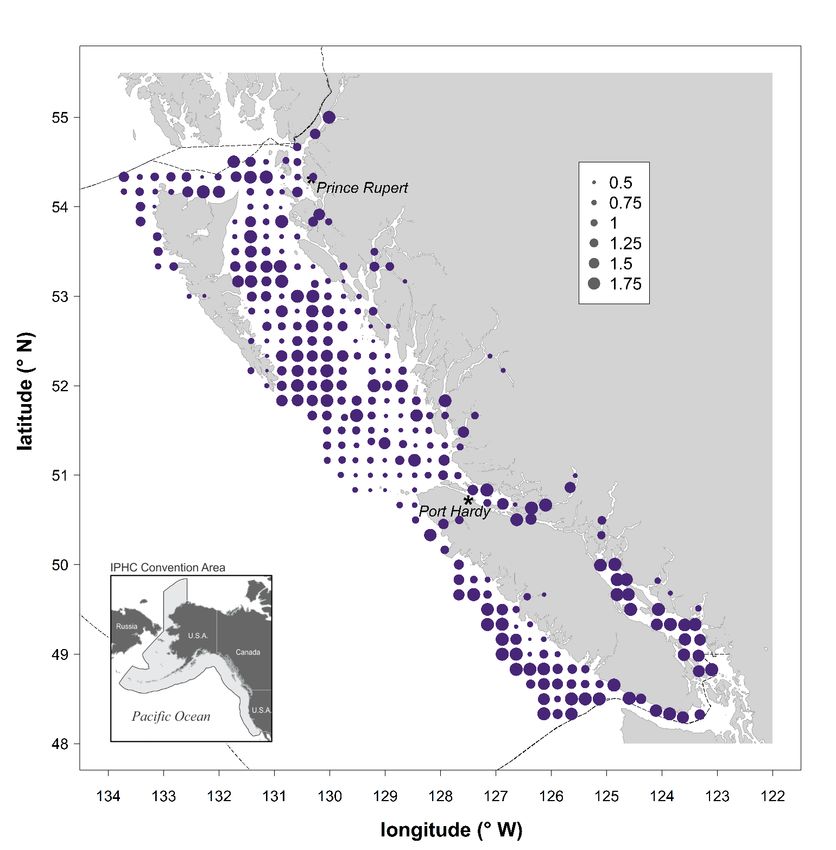
IPHC-2021-SRB019-05

Figure 1.1. Proposed minimum FISS design in 2022 (orange circles) based on randomized sampling in 2B-3B, and a subarea
design elsewhere. Purple circles are optional for meeting data quality criteria.

                                                     Page 3 of 43
IPHC-2021-SRB19-05
Figure 1.2. Proposed minimum FISS design in 2023 (orange circles) based on randomized sampling in 2B-3B, and a subarea
design elsewhere. Purple circles are optional for meeting data quality criteria.
Page 4 of 43IPHC-2021-SRB19-05
Figure 1.3. Proposed minimum FISS design in 2024 (orange circles) based on randomized sampling in 2B-3B, and a subarea
design elsewhere. Purple circles are optional for meeting data quality criteria.
Page 5 of 43IPHC-2021-SRB019-05
Part 2: Modelling of IPHC length-weight data
PURPOSE
To present results of fitting models to IPHC length-weight data from FISS and commercial
sampling, and make recommendations of revised length-net weight relationships for applications
to non-IPHC data sources.
BACKGROUND/INTRODUCTION
Historical length-weight curve
The IPHC’s standard length to net weight relationship was used in all commission work to
convert length to net weight of halibut until 2015, when individual weights were added to standard
commercial data collections. More recently, the IPHC’s Fishery Independent Setline Survey
(FISS) began collecting individual weights in 2017, and made such collections comprehensive
in 2019. The parameters of this relationship were estimated in 1926 based on a relatively small
sample of Pacific halibut (454 fish) collected off Masset in IPHC Regulatory Area 2B. Using 1989
data, Clark (1992) re-estimated the relationship’s parameters and found good agreement with
the earlier curve, and no changes to the historical IPHC relationship were made. While it was
recognized that such a calculated relationship will not be consistently accurate when computing
total or mean weights from small numbers of Pacific halibut, it was assumed that predictions
should be accurate when data come from larger samples of fish (Clark 1992). However, when
Courcelles (2012) estimated the relationship from data collected in 2011, she found significant
differences between her estimated curve and that derived from the 1989 data, although
inference was limited to a relatively small part of Area 3A and to the time of the FISS. Reports
from staff working on the FISS, along with other anecdotal reports, suggested that the historical
length-net weight relationship has been overestimating the weight of Pacific halibut on average
in recent years.
Adjustments and conversion factors
Various adjustment and conversion factors have been used to account for Pacific halibut
measured at different stages of processing following capture (Table 2.1).
Page 6 of 43IPHC-2021-SRB19-05
Table 2.1 Definitions of types of weight measures used by the IPHC and multipliers used to
convert to net weight.
Weight Definition Multiplier to Notes
convert to net
weight
Round Head-on, not gutted, no ice 0.75
and slime
Gross (vessel weight) Head-on, gutted, with ice 0.8624 Assumes 10% head weight and
and slime 2% shrinkage, or 12% head, and
2% ice and slime
Dressed (vessel weight) Head-on, gutted, no ice 0.88 Assumes 10% head weight and
and slime 2% shrinkage, or 12% head only
Gross (dock weight) Head-on, gutted, with ice 0.882 or 0.88 Assumes 10% head weight and
and slime 2% ice and slime; deductions
either additive (10+2=12% in 2A
and 2B) or multiplicative (1-
0.9*0.98=0.118 or 11.8% in
Alaska)
Dressed (dock weight) Head-on, no ice and slime 0.9 Assumes 10% head weight
(washed)
Net Head-off, gutted, no ice 1
and slime (washed)
The historical relationship between fork length and net weight includes adjustments for the
weight of the head, and of ice and slime (I/S): gross landed weight (gutted, with head, ice and
slime) was assumed to include a proportion of 0.12 head weight and 0.02 ice and slime, which
combine to give a multiplier of 0.8624 to convert gross to net weight. Clark (1992) noted that
subsequent studies showed the head weighed less than 0.12 of gross weight, but that the
adjustment factor worked well anyway, possibly because of additional shrinkage of fish after
being weighed at sea (as they were in the 1926 study in which the relationship was estimated).
In practice, combined deductions of 0.12 in Areas 2A and 2B, and 0.118 in Alaska, were applied
to commercial landings to convert from gross to net weight. These both include the 0.02
deduction for ice and slime assumed in the IPHC length-net weight relationship, but use 0.1 as
the proportion for the head. This head deduction has been required as part of IPHC regulations
since 2008 (Leaman and Gilroy 2008, Gilroy et al. 2008). The way the two deductions are
combined differs among areas. In Areas 2A and 2B, these deductions are simply added
(0.1+0.02=0.12), while in Alaska, the corresponding multipliers (1 minus the deduction) are
multiplied, leading to a multiplier of 0.882, and a deduction of 0.118.
Estimating and comparing length-net weight curves
The commercial sampling program and the FISS weight sampling provide us with two
independent data sources to use in re-estimating length-net weight relationships. For estimating
the relationship between fork length and net weight, only head-on fish (with the same standard
head and I/S deductions assumed in the standard IPHC relationship, 0.10 and 0.02 respectively)
are used to ensure a consistent comparison due to the high spatial variability in the proportion
of the weight removed when cutting heads (see below). Function parameters are estimated by
Page 7 of 43IPHC-2021-SRB19-05
fitting linear models (on the log scale) using least squares. Let L be the fork length of a halibut
in centimetres, and W be its net weight in pounds. The standard IPHC length-net weight
relationship is
W 6.921× 10⁻⁶ L3.24
= (1)
More generally, the relationship between length and weight is assumed to have the following
form
W = α Lβ
While this can be fitted as a non-linear model, it is somewhat easier to linearise the equation by
taking logs of both sides, giving
log (W )= a + β log ( L )
where a = log(α ) . For the standard IPHC model, a = −11.88, or -12.57 if weights in kg are used
as we do in the analyses below. Now suppose we have N halibut in our sample, and each is
indexed by i, i = 1, …, N. Then the model we fit is
log (Wi ) =
a + β log ( Li ) + ε i (2)
where ε i ~ N ( 0, σ 2 ) .
For both FISS and commercial data, several observations appeared to be extreme outliers. Such
outliers were likely the result of errors (e.g., incorrect conversion to or from metric or imperial
units), and to avoid the most extreme values influencing the estimated relationships,
observations with measured weight more than twice or less than half the value predicted by the
historical length-weight curve were excluded from the statistical analyses. These amounted to
just 21 out of over 62,000 commercial samples from 2015-20, and 22 out of over 83,000 FISS
samples from 2019-20.
Commercial catch sampling
In 2015, collection of weight data by IPHC staff began on randomly sampled fish in commercial
landings. Sample weights were measured in all ports except Dutch Harbor and St Paul, which
were added the following year. In 2017, weighing of fish was expanded to include all Pacific
halibut selected for biological sampling (length measurement, fin clip for genetic analysis, and
otolith collection). The addition of recording fish weights to commercial sampling was motivated
by a desire for more accurate estimation of commercial landings, validation of adjustments for
head weights and the weight of ice and slime, and validation or revision of the IPHC historical
length-net weight relationship. Sample sizes by year and IPHC Regulatory Area are given in
Table 2.2.
Page 8 of 43IPHC-2021-SRB19-05
Table 2.2. Sample sizes of weighed commercial Pacific halibut by year and IPHC Regulatory Area.
Year 2A 2B 2C 3A 3B 4A 4B 4CDE
2015 32 801 1431 1538 1133 798 192 147
2016 303 1943 1673 1470 1492 1574 1466 1270
2017 1118 1376 1367 1453 1381 997 1816 1632
2018 2253 1421 1612 1676 808 925 1307 1494
2019 1731 1076 1573 1751 1751 1322 968 960
2020 1318 1694 1717 1608 1606 937 1264 905
Head weight
Head weight was estimated from a subset of Pacific halibut that were weighed twice, before and
after the head was cut in the plant. Data showed that head cuts were highly variable (Webster
and Erikson 2017), and the proportion of the fish removed varied greatly among ports and plants.
Because the head cut was so variable, the IPHC regulations were changed in 2018 (?) to require
all catch to be offloaded and weighed with the head on to ensure consistent treatment of fish
across ports and plants, and accurate accounting for the mortality in stock assessment and
management analyses. Following the regulation change, commercial sampling for head weight
was discontinued, and the 10% deduction for head is applied to all offloaded Pacific halibut as
a standard part of the conversion to net weight. (With the requirement to land fish head on, the
accuracy of that 10% adjustment became moot – it is simply part of the IPHC definition of net
weight.)
Ice and slime
It was hoped that commercial sampling would yield estimates of the weight of ice and slime
through the comparison of fish weight twice, before and after washing. Plant operations have
not allowed for the collecting of such data, and therefore it has not been possible to validate the
assumed 2% adjustment for ice and slime. In the absence of any updated information, that
adjustment remains in use. The Commission considers this adjustment to be applicable only in
the absence of any water used to remove ice from the unloaded fish prior to weighing. The ‘plug’
ice in the body cavity is assumed to be removed and not part of the 2% deduction for all fish.
Length-net weight curves
We estimated the length-net weight curve for each IPHC Regulatory Area and for each year
from 2016-20, allowing us to assess variation in estimated curves over time and space, as well
as make comparisons between estimated curves and the historical length-net weight
relationship. Variation in space over the five-year period (Figures 2.1 to 2.5) was generally much
greater than variation in time within each IPHC Regulatory Area (Figures 2.6 to 2.13). IPHC
Regulatory Areas 2A and 4CDE showed much greater temporal variation in estimated curves
(Figures 2.6 and 2.13) than other areas: timing and distribution of sampling is less consistent in
these Regulatory Areas than elsewhere, which makes inference on changes in the relationship
more difficult over short periods. Estimated curves for Regulatory Areas 2B (Figure 2.7) and 3B
(Figure 2.10) are close to the historical curve in all years, while those for Regulatory Areas 2C,
Page 9 of 43IPHC-2021-SRB19-05
3A, 4A and 4B and consistently below the historical curve, with the degree of difference varying
among areas.
FISS sampling
Wide-scale weighing of Pacific halibut on the IPHC FISS commenced in 2019 and continued
through 2020. In 2019, the intention was to record dressed weight of all legal-sized (O32) fish
using motion-compensated scales, with the exception of some larger fish, that were weighed
dockside. Due to technical issues, fish on some trips were unable to be weighed. Sample sizes
by year and area are given in Table 2.3.
Table 2.3. Sample sizes of weighed FISS Pacific halibut by year and IPHC Regulatory Area.
Year 2A 2B 2C 3A 3B 4A 4B 4CDE
2019 786 3889 10898 15460 4530 3758 495 1545
2020 0 8103 6392 24815 2642 0 0 0
A random subsample of sublegal (U32) fish had dressed weight recorded (those selected for
otolith collection), along with round weight, in order to estimate the relationship between round
and dressed weight for use in predicting weight of fish not selected for otolith sampling (and
therefore with no dressed weight). Predictions of net weight from round weight (coastwide data)
and from length (by IPHC Regulatory Area) were compared to determine which variable was the
most accurate predictor of net weight. The approach we took was to model the relationship
between the ratio of dressed to round weight and round weight, after applying the normalizing
arcsin-square root transformation. Thus for the ith fish, the model was
wdressed ,i
sin −1 =b +bw + ηi
wround ,i 0 1 round ,i
where ηi ~ N ( 0,τ 2 ) . The parameter estimates (for weights in kg) were b0 = 1.215 (SE=0.003)
and b1 = -0.007619 (SE=0.000610). Thus, we estimate that as round weight increases, the
corresponding dressed weight is a decreasing fraction of round weight, ranging from 88% for
fish at 0.5 kg to 84% for 8 kg fish (the approximate weight range of fish in the data).
The estimated relationship with round weight was found to produce more accurate predictions
(Figure 2.14), with much less variability from true net weight (scaled from dressed weight as per
Table 2.1) and no constraint forced on maximum predicted weight by a strict relationship with
length. This led to the recommendation that round weights of U32 Pacific halibut continue to be
measured during the FISS, but that measurement of dressed weight for a subsample of such
fish can be discontinued. From 2020 onwards, dressed weight (and hence net weight) is being
predicted for each U32 fish from the relationship estimated from the 2019 data.
There was general consistency across years for each of the four IPHC Regulatory Area sampled
in both 2019 and 2020 (Figures 2.15-2.18) in estimated length-net weight relationships, although
Page 10 of 43IPHC-2021-SRB19-05
differences for Regulatory Areas 2C and 3B (the latter having greatly reduced sampling in 2020)
were somewhat larger than Regulatory Areas 2B and 3A. As with length-net weight relationships
estimated from commercial sampling data, spatial variation in the estimated relationships among
areas was much greater than temporal variation within areas (Figures 2.19-2.20).
Estimating shrinkage
As noted above, there is the assumption of 2% shrinkage when converting weights made on
board a vessel to net weight. A subsample of Pacific halibut from FISS sampling was weighed
both on the vessels and later at the dock during the 2016 and 2017 FISS seasons, providing
data with which to estimate the shrinkage rate of fish. The data file recording at sea and dockside
weights for the same individuals includes measurements on 562 fish, although 12 only have a
single weight recorded. At sea weights were recorded as round weights, while dockside weights
were of head-on and washed fish (i.e., dockside dressed, Table 2.1). To estimate shrinkage,
round weights must first be converted into at-sea dressed weights, requiring multiplication of
round weights by 0.85 (0.75/0.88 from Table 2.1). Without data to validate this assumed
multiplier directly, we are in the problematic position of trying to estimate shrinkage based on
values that may themselves be in error due to inaccuracy of the multiplier. While we were able
to estimate a relationship between round weight and dressed weight for U32 fish above, the fish
weighed twice are O32 fish, and therefore the estimated relationship may not apply. Given the
assumed 0.85 multiplier, the average % shrinkage across all 550 fish with both weights is 1.9%
(SE=0.2%), and is therefore consistent with a shrinkage multiplier of 2% as assumed in Table
2.1. Future FISS sampling should include a selection of O32 Pacific halibut weighed twice,
before and after gutting, to validate the conversion from round weight to dressed at sea.
Commercial and FISS length-weight comparisons
The estimated length-net weight curves above can be used to predict net weight for Pacific
halibut with missing direct measurements from both commercial and FISS sampling. With two
independent sources of IPHC length-weight data since 2019, thought must be given to how (or
whether) to combine the two sources for estimating length-weight curves for use outside of the
IPHC when direct weight measurement is not available, i.e., for other survey data (e.g., NMFS
and DFO surveys), commercial observer data, and data from recreational catch sampling. While
the FISS data are typically collected in a spatially comprehensive manner within each IPHC
Regulatory Area, they are temporally restricted to the May-September summer period.
Conversely, commercial samples are collected throughout the fishing season, but may more
geographically limited due to the concentration of fishing effort in the most productive habitat
within each area. In this section we assess the likely importance of any differences in estimated
length-net weight curves that may be a result of such sampling differences when it comes to
calculating statistics such as mean weight of sampled fish.
For 2019 and 2020 data, we fitted two length-net weight models to the combined commercial
and FISS data for each IPHC Regulatory Area:
Model 1: Assume length-net weight relationships are the same for both data sources
Page 11 of 43IPHC-2021-SRB19-05
Model 2: Allows parameters for length-net weight relationships to differ between the data
sources
Table 2.4. Estimated model parameters (with standard errors) for Models 1 and 2 fitted to
combined FISS and commercial data (with weight in kg), by IPHC Regulatory Area and year. Note
that the historical length-net weight relationship has intercept of -12.57 and slope of 3.24.
Reg Year Model 1 Model 2
Area Intercept (SE) Slope (SE) FISS Commercial
Intercept (SE) Slope (SE) Intercept (SE) Slope (SE)
2A 2019 -13.51 (0.08) 3.42 (0.02) -13.16 (0.11) 3.35 (0.02) -13.43 (0.10) 3.40 (0.02)
2B 2019 -12.40 (0.03) 3.18 (0.01) -12.40 (0.04) 3.18 (0.01) -12.79 (0.09) 3.26 (0.02)
2020 -12.69 (0.03) 3.24 (0.01) -12.72 (0.03) 3.24 (0.01) -12.57 (0.08) 3.21 (0.02)
2C 2019 -12.44 (0.02) 3.18 (0.00) -12.46 (0.02) 3.19 (0.00) -12.20 (0.07) 3.13 (0.01)
2020 -12.56 (0.03) 3.21 (0.01) -12.63 (0.03) 3.23 (0.01) -12.33 (0.07) 3.16 (0.02)
3A 2019 -12.25 (0.02) 3.14 (0.00) -12.26 (0.02) 3.14 (0.00) -12.34 (0.07) 3.15 (0.02)
2020 -12.15 (0.02) 3.11 (0.00) -12.14 (0.02) 3.11 (0.00) -12.38 (0.07) 3.16 (0.02)
3B 2019 -12.78 (0.03) 3.26 (0.01) -12.75 (0.03) 3.26 (0.01) -13.05 (0.07) 3.32 (0.02)
2020 -12.59 (0.03) 3.21 (0.01) -12.51 (0.04) 3.20 (0.01) -13.16 (0.07) 3.34 (0.02)
4A 2019 -12.00 (0.03) 3.09 (0.01) -12.07 (0.03) 3.11 (0.01) -12.56 (0.08) 3.21 (0.02)
4B 2019 -12.13 (0.08) 3.10 (0.02) -11.80 (0.10) 3.04 (0.02) -12.72 (0.10) 3.23 (0.02)
4CDE 2019 -12.07 (0.04) 3.11 (0.01) -12.04 (0.05) 3.10 (0.01) -12.51 (0.08) 3.20 (0.02)
Model parameter estimates are given in Table 2.4. We compared the actual observed mean net
weight of fish mean to net weights predicted from each model for each source (FISS and
commercial), and to that predicted by the historical relationship. Only fish included in the
modelling were used in the comparison, i.e., only data from fish with directly measured weights
were included (some extreme outlying data were excluded). Results of the comparisons of mean
net weights are presented in Table 2.5. Figures comparing the FISS and commercial data and
estimated length-net weight curves for Model 2 are shown in Figures 2.21-2.32.
As might be expected, Model 2 produced estimated mean net weights closest to the observed
values, with differences all within 1% (Table 2.5). In cases where estimated length-net weight
curves differed between FISS and commercial data to some degree, this model accounts for
such differences. Model 1, while less accurate in estimating observed mean net weights than
Model 2, still performed well in almost all cases, with differences of less than 2% except for the
FISS mean in IPHC Regulatory Area 2A, the commercial mean in IPHC Regulatory 3A, and the
FISS mean in IPHC Regulatory Area 4B, all in 2019. We note that those three cases are ones
in which there were differences between the FISS and commercial length-net weight curves
when estimated separately (Figures 2.21, 2.24 and 2.27), but where one data source had much
larger sample sizes and so had greater influence on the estimates of a single length-net weight
curve in Model 1: for IPHC Regulatory Area 2A, 69% of the data came from commercial samples;
for 3A in 2019, 90% of the data came from FISS samples; and for 4B, 66% of the data came
from commercial samples.
Discussion
Analysis of the IPHC length-weight data has made it clear that currently there is a positive bias
in weights predicted from the historical length-net weight relationship in most IPHC Regulatory
Page 12 of 43IPHC-2021-SRB19-05
Areas, especially (in absolute terms) for the largest Pacific halibut. that the IPHC recommends
that this bias can best be eliminated by weighing individual fish directly. In the absence of
sampling capability, the bias can be reduced through the use of relationships estimated from
more contemporary IPHC FISS and commercial data. For IPHC data where there is no reliable
direct weight measurement, the weight of a fish can be predicted from the length-net weight
relationship estimated for its IPHC Regulatory Area and year of capture, and for its data source
(commercial or FISS sampling). This change has already been made to the prediction of net
weight for fish captured on the FISS with missing weight measurements.
For predicting weights for Pacific halibut sampled from non-IPHC data sources, Model 1 is of
more practical use than Model 2, as it would not require a choice of which IPHC source was
most likely to resemble the data source of interest (recreational, observer, etc). By combining
data from the more temporally comprehensive commercial samples with data from the spatially
extensive FISS, the resulting length-net weight represents an average that can be applied to a
wide range of data sources.
Spatial differences in estimated length-net weight curves imply that area-specific curves should
be used. On the other hand, the relative temporal stability of these curves suggests that curves
could be estimated from multiple years’ data, and only revised periodically. Following the 2021
FISS, three consecutive years of data from both IPHC sources will be available for core areas
(2B, 2C, 3A and 3B), and two years (2019 and 2021) for other areas, providing a combined data
set for estimation of curves for application to non-IPHC length data in 2021.
In fitting Model 1, we simply combined the data without weighting the two data sources, so each
fish, no matter its source, was given equal weight. This resulted in instances where the estimated
length-net weight equation was more influenced by data from one source than the other, typically
the FISS in the core areas, and sometimes the commercial samples elsewhere. Generally, this
did not matter much, as the two sources produced consistent estimated relationships most of
the time (Figures 2.21 to 2.32). It may be desirable, however, to weight the data sources equally
(i.e., down-weight data from the source with the larger sample size relative to the other source)
to produce a relationship that better represents an average of the FISS and commercial data
relationships, and thus one that is as widely applicable as possible for each IPHC Regulatory
Area.
Therefore, the IPHC intends to produce a revised length-net weight relationship based on Model
1 (combined fitting) and including all data from 2019-2021. This relationship should be used in
place of the historical relationships for the calculation of all non-IPHC mortality estimates where
individual weights cannot be collected for 2021 and until further notice. The Secretariat
anticipates re-evaluating the relationship as additional years of data are collected and updating
it accordingly.
Finally, we note that there remain two components to the estimation of weight from length that
are not directly estimable from recent FISS and commercial sample data: the conversion from
round to net weight (or round to dress weight), and the adjustment factors for ice and slime
(conversion from unwashed to wash). The former only has data available for U32 fish, while
Page 13 of 43IPHC-2021-SRB19-05
there are no data available to estimate the latter. We recommend that future FISS sampling
include a random sample of O32 fish weighed twice, before and after dressing, and that renewed
efforts should be made to weigh a sample of fish twice dockside, before and after washing.
RECOMMENDATIONS
That the Scientific Review Board:
1) NOTE paper IPHC-2021-SRB019-05.2 that presents methods for revised the length-
net weight relationships from FISS and commercial sampling data
2) RECOMMEND that the IPHC provide a revised length-net weight relationship for each
IPHC Regulatory Area based on modelling of combined FISS and commercial sample
data to be used for the calculation of all non-IPHC mortality estimates where individual
weights cannot be collected, for 2021 and until further notice.
References
Clark, W. G. 1992. Validation of the IPHC length-weight relationship for halibut. Int. Pac. Halibut
Comm. Report of Assessment and Research Activities 1991: 113–116.
Courcelles, D. 2012. Re-evaluation of the length-weight relationship of Pacific halibut
(Hippoglossus stenolepis). Int. Pac. Halibut Comm. Report of Assessment and Research
Activities 2011: 459-470.
Gilroy, H. L., Hutton, L. M. and MacTavish, K. A. 2009. 2008 commercial fishery and regulation
changes. Int. Pac. Halibut Comm. Report of Assessment and Research Activities 2008: 37-48.
Leaman, B. M. and Gilroy, H. L. 2008. IPHC staff regulatory proposals: 2008. Int. Pac. Halibut
Comm. Annual Meeting Handout: 105-110.
Webster, R. A. and Erikson, L. M. 2017. Analysis of length-weight data from commercial
sampling in 2016. Int. Pac. Halibut Comm. Report of Assessment and Research Activities 2016:
101-109.
Page 14 of 43IPHC-2021-SRB19-05
Table 2.5. Comparison of mean observed Pacific halibut net weight with mean nets weights
predicted from Models 1 and 2 (see text) and the historical length-net weight relationship.
Intensity of shading indicates magnitude of departures from observed mean, either negative
(blue) or positive (orange/brown).
Reg Calculation 2019 2020
Area method
FISS Commercial FISS Commercial
Mean diff from Mean diff from Mean diff from Mean diff from
(kg) Observed (kg) Observed (kg) Observed (kg) Observed
2A Observed 9.9 7.6
Model 1 9.6 −3.1% 7.7 +1.1%
Model 2 9.9 −0.3% 7.6 −0.4%
Historical 9.9 −0.8% 8.0 +4.9%
2B Observed 9.4 11.0 10.7 11.0
Model 1 9.3 −1.4% 11.1 +1.3% 10.6 −0.7% 11.1 +1.0%
Model 2 9.4 −0.7% 10.9 −0.3% 10.7 −0.3% 10.9 −0.5%
Historical 9.5 +0.8% 11.4 +3.6% 11.0 +2.3% 11.4 +4.0%
2C Observed 10.8 13.5 11.4 14.3
Model 1 10.8 −0.5% 13.5 −0.3% 11.3 −0.9% 14.4 +0.8%
Model 2 10.8 −0.5% 13.5 −0.5% 11.3 −0.5% 14.3 −0.4%
Historical 11.3 +4.3% 14.2 +4.9% 11.5 +0.5% 14.7 +2.4%
3A Observed 8.5 8.7 8.6 9.1
Model 1 8.5 −0.7% 8.9 +2.1% 8.6 −0.6% 9.2 +1.0%
Model 2 8.5 −0.4% 8.7 −0.5% 8.6 −0.5% 9.0 −0.5%
Historical 8.9 +3.8% 9.3 +6.8% 9.1 +5.5% 9.7 +7.4%
3B Observed 8.4 9.1 6.4 9.0
Model 1 8.3 −1.1% 9.2 +0.9% 6.3 −0.9% 9.0 −0.1%
Model 2 8.3 −0.5% 9.1 −0.3% 6.3 −0.5% 8.9 −0.3%
Historical 8.3 −1.0% 9.3 +1.0% 6.5 +2.1% 9.2 +3.3%
4A Observed 6.0 9.9
Model 1 5.9 −1.4% 10.0 +1.0%
Model 2 5.9 −0.4% 9.3 −0.5%
Historical 5.9 −0.6% 10.3 +4.2%
4B Observed 8.7 9.0
Model 1 8.3 −3.7% 9.0 +0.7%
Model 2 8.6 −1.0% 9.0 −0.3%
Historical 9.2 +3.9% 9.9 +10.7%
4CDE Observed 6.9 11.0
Model 1 6.8 −1.2% 11.0 −0.0%
Model 2 6.9 −0.6% 11.0 −0.4%
Historical 6.8 −1.7% 11.2 +1.1%
Page 15 of 43IPHC-2021-SRB19-05
Figure 2.1 Comparison of estimated length-net weight curves from commercial data by IPHC
Regulatory Area for 2016.
Figure 2.2 Comparison of estimated length-net weight curves from commercial data by IPHC
Regulatory Area for 2017.
Page 16 of 43IPHC-2021-SRB19-05
Figure 2.3 Comparison of estimated length-net weight curves from commercial data by IPHC
Regulatory Area for 2018.
Figure 2.4 Comparison of estimated length-net weight curves from commercial data by IPHC
Regulatory Area for 2019.
Page 17 of 43IPHC-2021-SRB19-05
Figure 2.5 Comparison of estimated length-net weight curves from commercial data by IPHC
Regulatory Area for 2020.
Page 18 of 43IPHC-2021-SRB19-05
Figure 2.6 Comparison of estimated length-net weight curves from commercial data by year for
IPHC Regulatory Area 2A.
Figure 2.7 Comparison of estimated length-net weight curves from commercial data by year for
IPHC Regulatory Area 2B.
Page 19 of 43IPHC-2021-SRB19-05
Figure 2.8 Comparison of estimated length-net weight curves from commercial data by year for
IPHC Regulatory Area 2C.
Figure 2.9 Comparison of estimated length-net weight curves from commercial data by year for
IPHC Regulatory Area 3A.
Page 20 of 43IPHC-2021-SRB19-05
Figure 2.10 Comparison of estimated length-net weight curves from commercial data by year for
IPHC Regulatory Area 3B.
Figure 2.11 Comparison of estimated length-net weight curves from commercial data by year for
IPHC Regulatory Area 4A.
Page 21 of 43IPHC-2021-SRB19-05
Figure 2.12 Comparison of estimated length-net weight curves from commercial data by year for
IPHC Regulatory Area 4B.
Figure 2.13 Comparison of estimated length-net weight curves from commercial data by year for
IPHC Regulatory Area 4CDE.
Page 22 of 43IPHC-2021-SRB19-05
Figure 2.14 Model prediction of net weight from estimated length-net weight relationship (by IPHC
Regulatory Area) and estimated coastwide relationship between net weight and round weight.
Page 23 of 43IPHC-2021-SRB19-05
Figure 2.15 Comparison of estimated length-net weight curves from FISS data by year for IPHC
Regulatory Area 2B.
Figure 2.16 Comparison of estimated length-net weight curves from FISS data by year for IPHC
Regulatory Area 2C.
Page 24 of 43IPHC-2021-SRB19-05
Figure 2.17 Comparison of estimated length-net weight curves from FISS data by year for IPHC
Regulatory Area 3A.
Figure 2.18 Comparison of estimated length-net weight curves from FISS data by year for IPHC
Regulatory Area 3B.
Page 25 of 43IPHC-2021-SRB19-05
Figure 2.19 Comparison of estimated length-net weight curves from FISS data by IPHC Regulatory
for 2019.
Figure 2.20 Comparison of estimated length-net weight curves from FISS data by IPHC Regulatory
for 2020.
Page 26 of 43IPHC-2021-SRB19-05
Figure 2.21 Comparison of estimated length-net weight curves from FISS and commercial data
for IPHC Regulatory Area 2A in 2019.
Figure 2.22 Comparison of estimated length-net weight curves from FISS and commercial data
for IPHC Regulatory Area 2B in 2019.
Page 27 of 43IPHC-2021-SRB19-05
Figure 2.23 Comparison of estimated length-net weight curves from FISS and commercial data
for IPHC Regulatory Area 2C in 2019.
Figure 2.24 Comparison of estimated length-net weight curves from FISS and commercial data
for IPHC Regulatory Area 3A in 2019.
Page 28 of 43IPHC-2021-SRB19-05
Figure 2.25 Comparison of estimated length-net weight curves from FISS and commercial data
for IPHC Regulatory Area 3B in 2019.
Figure 2.26 Comparison of estimated length-net weight curves from FISS and commercial data
for IPHC Regulatory Area 4A in 2019.
Page 29 of 43IPHC-2021-SRB19-05
Figure 2.27 Comparison of estimated length-net weight curves from FISS and commercial data
for IPHC Regulatory Area 4B in 2019.
Figure 2.28 Comparison of estimated length-net weight curves from FISS and commercial data
for IPHC Regulatory Area 4CDE in 2019.
Page 30 of 43IPHC-2021-SRB19-05
Figure 2.29 Comparison of estimated length-net weight curves from FISS and commercial data
for IPHC Regulatory Area 2B in 2020.
Figure 2.30 Comparison of estimated length-net weight curves from FISS and commercial data
for IPHC Regulatory Area 2C in 2020.
Page 31 of 43IPHC-2021-SRB19-05
Figure 2.31 Comparison of estimated length-net weight curves from FISS and commercial data
for IPHC Regulatory Area 3A in 2020.
Figure 2.32 Comparison of estimated length-net weight curves from FISS and commercial data
for IPHC Regulatory Area 3B in 2020.
Page 32 of 43IPHC-2021-SRB19-05
Part 3: Review of IPHC hook competition standardization
PURPOSE
To provide a review of the IPHC approach to standardizing WPUE and NPUE for competition
for baits on the Fishery-Independent Setline Survey (FISS). A short discussion of IPHC
experiments with hook timers is also provided.
BACKGROUND/INTRODUCTION
In 2007, the IPHC transitioned from IPHC Regulatory Area-specific stock assessments to a
coastwide stock assessment. At the same time, the IPHC began using the O32 WPUE index
(including all fish over 32 inches, 81 cm, in length; this corresponds to the current directed
commercial fishery minimum size limit for landings) from the FISS to estimate the distribution of
the stock among IPHC Regulatory Areas. In order to address concerns that such an index can
be affected by catchability differences among areas, Secretariat staff devised adjustments
intended to standardise the index for at least some contributors to catchability differences. The
most important of these, and one of only two standardisations still applied (along with an
adjustment for FISS timing), is the hook competition standardisation. Originally devised as an
average adjustment applied at the IPHC Regulatory Area level, with the introduction of the
space-time model for estimating WPUE and NPUE indices, this was updated to a station-specific
adjustment in 2016, as supported by the SRB (IPHC-2016-SRB09-R).
STANDARDIZATION FOR HOOK COMPETITION
Gear saturation is the process by which catch rates decrease disproportionately to abundance
as the sampling gear becomes fully occupied. Although it may be present for many types of
sampling gear, for longline gear, as deployed by the IPHC, gear saturation may be considered
via competition for the finite number of hooks deployed. The IPHC method for standardisation
for hook competition was developed by Clark (2008), and was based on the number of baits
removed on FISS sets, Bi, by predator species i. The Baranov catch equation was used to model
the Bi, the number of baits removed by predator i after a time period, T:
Fi
=Bi B0
Z
(1 − e− ZT )
Here Fi is the instantaneous rate of bait removal by predator i, B0 is the initial number of baited
hooks, and Z is the sum of the instantaneous rates applied by all bait takers. It follows that the
expected catch (C) of halibut (h), which is one of the bait predators, is given by
Fh
=Ch B0
Z
(1 − e− ZT ) (1)
For the FISS sets, soak time is assumed to be of sufficient length that catches of all species are
unaffected by the exact value of T. For simplicity, we therefore set T=1 in the above equations.
It is further assumed that empty hooks are due to bait taking by species other than halibut, and,
therefore, halibut do not escape once captured. In these equations, (1 − e − Z ) (with T=1) is the
expected fraction of baits removed by all takers during the active period. An estimate of Z is
Page 33 of 43IPHC-2021-SRB19-05
therefore given by log ( B0 B1 ) , where B1 is the number of baits remaining when the gear is
hauled.
The IPHC approach to standardising for hook competition is to treat Fh as the standardised index
for Pacific halibut at a given station, which is estimated by rearranging (1) and substituting in the
estimate of Z:
Ch B B0
Fh = log 0 (2)
B0 B1 B0 − B1
With Ch/B0 representing catch per unit effort, the remaining part of the right-hand side of (2) is
the hook competition adjustment factor. We note that the IPHC approach has the same
mathematical derivation as the method developed contemporaneously by Etienne et al. (2013).
In practice, we substitute WPUE or NPUE for Ch/B0 in (2), for which effort is measured by the
number of effective skates, rather than the count of baits set. As the adjustment factor has a
lower bound of 1, the result of the standardisation would be to increase average WPUE or NPUE,
with larger positive adjustments made when fewer baits are returned. To maintain the indices on
a scale familiar to stakeholders, all adjustment factors are divided by the same scalar, based on
the coastwide mean adjustment factor for 1998. Importantly, this approach implicitly accounts
for changes in predator density, not only among stations within a sampling year, but also across
years, such that a long-term change in the level of competition would be accounted for.
Pacific halibut represents the most common species captured, and therefore the largest
contribution to the hook competition correction. However, non-target species (commonly dogfish,
Pacific cod and others depending on the geographical area) are frequently encountered in
abundance at some FISS stations every year. Missing baits are attributed to hook competition,
except where they are lost during setting, in which case they are recorded as such, and the baits
deployed adjusted accordingly. Aggregating by area and year, generally 5-40% of baited hooks
are returned with baits, with lowest rates of return in IPHC Regulatory Area 2A (typically less
than 10%) and highest in IPHC Regulatory Area 4B (20-40% each year).
To avoid the adjustment going to infinity as the number of baits returned goes to zero, a small
amount (B0/100, for our 100-hook skates) is added to both the B0 and B1 when computing Z.
Note also that when zero Pacific halibut are captured, the multiplicative adjustment leaves the
value of WPUE or NPUE unchanged at zero.
As an example, Figures 3.1-3.3 demonstrate the effect of the standardisation on O32 WPUE
from IPHC Regulatory Area 2B in 2018. This was a year in which dogfish captures were higher
than normal in parts of the area, leading to lower bait returns and negatively impacting the
observed survey catch of Pacific halibut. Figure 3.1 shows the hook competition adjustment
factors for each station, while Figures 3.2 and 3.3 respectively plot O32 WPUE by station before
and after application of the hook competition standardisation (i.e., before and after multiplication
by the factors in Figure 3.1).
IPHC HOOK TIMER STUDIES
Historical work on hook timers (Kaimmer 2011, Parma et al. 1995) was intended to produce data
on the rate of bait capture by Pacific halibut and competing species. However, the timers in use
in those studies were not tripped most of the time, and it appears they were not sensitive to the
Page 34 of 43IPHC-2021-SRB19-05
capture of smaller fish or to smaller fish taking the bait without being captured (Parma et al.
1995).
The IPHC is currently collaborating on a study of standard and modified circle hooks that will
use hook timers to record the capture time of different species. Modern hook timers are expected
to be more sensitive than those used in historical studies, and it is therefore hoped that this study
will yield data that will help inform the calculation of the hook competition standardisation.
RECOMMENDATION
That the Scientific Review Board:
1) NOTE paper IPHC-2021-SRB019-05.3 that presents an overview of the IPHC
standardization for hook competition on FISS sets.
References
Clark, W.G. 2008. Effect of hook competition on survey CPUE. Int. Pac. Halibut Comm. Report
of Research and Assessment Activities 2007: 211-215.
Etienne M. P., Obradovich S. Yamanaka L. and McAllister M. 2013. Extracting abundance
indices from longline surveys: method to account for hook competition and unbaited hooks.
Preprint arXiv:1005.0892v3
IPHC 2016. Report of the 9th Session of the IPHC Scientific Review Board (SRB) IPHC-2016-
SRB09-R. 5 p.
Kaimmer, S. M. 2011. Special setline experiments 1985-1994 objectives, data formats, and
collections. IPHC Technical Report 53.
Parma, A. M., Kaimmer, S. M. and Sullivan, P. J. 1995. A progress report on the use of hook
timers and underwater observations to assess the effect of bait competition on CPUE. Int.
Pac. Halibut Comm. Report of Research and Assessment Activities 1994: 211-221.
Page 35 of 43IPHC-2021-SRB19-05
Figure 3.1. Hook competition adjustment factors for each station in IPHC Regulatory Area 2B in 2018. Larger circles
are due to greater competition for baits (fewer baits returned), while smaller circles are a result of lower levels of
competition.
Page 36 of 43IPHC-2021-SRB19-05
Figure 3.2. Raw O32 WPUE (lb/skate) for each station in IPHC Regulatory Area 2B in 2018.
Page 37 of 43IPHC-2021-SRB19-05
Figure 3.3. O32 WPUE (lb/skate) for each station standardized for hook competition in IPHC Regulatory Area 2B in 2018.
Page 38 of 43IPHC-2021-SRB19-05
Part 4: Accounting for the effects of whale depredation on the FISS
PURPOSE
To describe a simple approach for accounting for the effects of whale depredation on FISS catch
rates within the space-time model.
BACKGROUND/INTRODUCTION
The presence of sperm whales and orcas during the fishing and hauling of FISS sets can lead
to such sets being designated as ineffective for the use in analyses due to the potential impact
on recorded catch rates Pacific halibut of depredation by these marine mammals (IPHC-2021-
VSM01, page 18). The criteria for ineffectiveness, which were tightened in 2019, are as follows:
• Sperm whales: a sperm whale is spotted within 3 nmi of the boat while hauling gear
• Orcas: a set has more than 1 lips-only Pacific halibut or a set has other observations of
orca feeding on Pacific halibut
These criteria were designed to minimize the potential for including biased data in the annual
indices. Sperm whales have been found to depredate cryptically on the gear at large distances
from the vessel, while orcas generally leave clear evidence of depredation or are observed in
the act. Coastwide, relatively few sets are designated as ineffective due to sperm whale and
orca depredation each year: from 2010-2020, 1.4-3.0% of all sets fished included sperm whales
or orcas as a reason for ineffectiveness. However, the impacts can be greater for a given area
and year. For example, IPHC Regulatory Area 3A has had up to 6% of sets affected by whales
(mainly sperm whales), while IPHC Regulatory Area 4A is the area most affected by orca
encounters, with over 10% of sets affected in some years. In the latter case, the FISS expansion
year of 2014 has 12% of sets designated as ineffective with sperm whales or orcas given as a
reason. Given that several of those sets have only been fished once prior to 2021, the effect of
the loss of data on estimates of density indices may be disproportionate.
We propose a simple solution to allow data from sets affected by whale depredation to be
included in the estimation of WPUE and NPUE (weight and numbers per unit effort) indices of
density: include binary (0=no whale; 1=whale) covariates in the space-time model for sets with
whale depredation ineffectiveness codes. By estimating a parameter for the difference between
affected and unaffected sets, we can make use of valuable data that would otherwise be
excluded from analysis, while basing index estimation only on prediction at a zero value of the
covariate (i.e., no whale effects for the standardized indices).
IPHC REGULATORY AREA 4A
As noted above, IPHC Regulatory Area 4A is the area with the greatest proportion of sets
affected by whale interactions, almost all of which are interactions with orcas (139 orca sets from
1993-2020 and three sperm whale sets). We refitted the space-time model (see IPHC-2021-
SRB018-05 Rev_1, Appendix B for details) to the O32 WPUE 1993-2020 data series, including
sets with ineffectiveness codes for either orca or sperm whale interactions but omitting whale-
affected sets that also included another ineffectiveness reason (e.g., both orcas and gear
issues). As few sets with zero catch were ineffective due to whale interactions, we included the
Page 39 of 43IPHC-2021-SRB19-05
whale covariate in the non-zero model component (noting also that additional modelling showed
no evidence of an effect on the probability of zero WPUE, supporting this choice).
The value of the coefficient transforms to 0.51 (95% CI: 0.43 – 0.60) on the original scale, i.e.,
O32 WPUE on whale-affected sets is estimated to be 51% of that on unaffected sets on average.
Figure 4.1 compares the estimated O32 WPUE time series calculated from predictions at all
FISS stations in IPHC Regulatory Area 4A for a model that excludes all whale-affected sets
(“Excluded”) and the model fitted here, that includes those sets but adjusts for the effect of
whales by predicting with the whale covariate set to 0 (“Included (adjusted)”). The means of both
time series are very close across all years, but we see an improvement in precision (narrower
95% CIs) when the whale-affected sets are included.
Figure 4.1. Comparison of the estimated O32 WPUE time series from the space time model calculated from predictions
at all FISS station locations in IPHC Regulatory Area 4A for a model that excludes all whale-affected sets (“Excluded”,
blue line) and a model that includes those sets but adjusts for the effect of whales by predicting with the whale covariate
set to 0 (“Included (adjusted)”, red line). Shaded regions represent 95% posterior credible intervals.
Figure 4.2 compares the time series from the new model (“Included (adjusted)” – note the colour
change from Figure 4.1) with the time series estimated the last time most of the whale-affected
sets were included as “effective” sets (“Included (effective)”), prior to the tightening of the FISS
ineffectiveness criteria for whales in 2019. The time series is consistently lower when these sets
are included, a result of the lower average WPUE for these sets. This supports the tightening of
Page 40 of 43IPHC-2021-SRB19-05
the ineffectiveness criteria in 2019, as their inclusion without any adjustment leads to a likely
negative bias in the time series.
Figure 4.2. Comparison of the estimated O32 WPUE time series from the space time model calculated from predictions
at all FISS station locations in IPHC Regulatory Area 4A for a model that included most whale-affected sets (“Included
(effective)”, blue line) without adjustment, and a model that also includes those sets but adjusts for the effect of whales
by predicting with the whale covariate set to 0 (“Included (adjusted)”, red line). Shaded regions represent 95% posterior
credible intervals.
IPHC REGULATORY AREA 3A
Both sperm whales and orcas interact with FISS sets in IPHC Regulatory Area 3A, but with 116
sets affected by sperm whales over the 1993-2020 period vs 29 orca sets (and 18 with both),
the former species provides a large majority of recorded whale interactions. For this area, we
fitted a model with binary covariates for each species in the non-zero component of the model.
We also fitted a model that included a species interaction effect, but found no evidence for such
an interaction. The model estimates a much smaller effect of whale interactions than in IPHC
Regulatory Area 4A, with orca-affected estimated to have 84% (68-104%) of the O32 WPUE of
unaffected sets, and sperm whale-affected sets having 86% (75-99%) of the O32 WPUE of
unaffected sets. With a smaller proportion of affected sets in this area, and with a lower estimated
Page 41 of 43IPHC-2021-SRB19-05
effect of whale interactions, the effect on WPUE of including these sets in the modelling is
negligible (Figure 4.3).
Figure 4.3. Comparison of the estimated O32 WPUE time series from the space time model calculated from predictions
at all FISS station locations in IPHC Regulatory Area 3A for a model that excludes all whale-affected sets (“Excluded”,
blue line) and a model that includes those sets but adjusts for the effect of whales by predicting with the whale covariate
set to 0 (“Included (adjusted)”, red line). Shaded regions represent 95% posterior credible intervals.
DISCUSSION
Our examples show that including sets deemed ineffective due to whale interactions in the
space-time model while accounting for whale effects on catch rates can lead to improved
precision in estimates of the WPUE time series when whale effects are strong and those sets
are a relatively high proportion of all sets (IPHC Regulatory 4A), but have little to no effect on
estimates when whale impacts are weaker and affected sets are a smaller proportion of all sets
(IPHC Regulatory Area 3A). Our results also support the strengthening of ineffectiveness criteria
related to whale depredation in 2019. The similarity of the two times series in Figure 4.1, in
particular, implies that the space-time model has been producing accurate predictions at stations
Page 42 of 43IPHC-2021-SRB19-05
where data were previously missing because of sets that were considered ineffective due to
potential whale depredation.
We propose that in order to maximise the information used to produce estimates of density
indices from the space-time model, beginning in 2021, data from “ineffective” sperm whale and
orca-affected sets be included in the modelling with appropriate covariates to account for
difference in catch rates between affected and unaffected sets. In IPHC Regulatory Areas where
such interactions are rare, precise estimation of whale covariate parameters will not be possible,
and we can simply continue to omit such sets from the analyses with little loss of information.
RECOMMENDATIONS
That the Scientific Review Board:
1) NOTE paper IPHC-2021-SRB019-05.4 that presents an approach to accounting for
the effects of whale interactions on FISS catch rates through the space-time
modelling.
2) RECOMMEND that the Secretariat should apply such an approach going forwards.
References
IPHC 2021. International Pacific Halibut Commission Fishery-Independent Setline Survey
Sampling Manual (2021). IPHC-2021-VSM01.
Webster, R. A. 2021. 2022-24 FISS design evaluation. IPHC-2021-SRB018-05 Rev_1.
Page 43 of 43You can also read