Introduction to Radio Astronomy
←
→
Page content transcription
If your browser does not render page correctly, please read the page content below
Introduction to Radio Astronomy
What is Radio?
Radio is part of the Electromagnetic Spectrum (EM) along with Light.

The Electromagnetic Spectrum
Whenever an electric charge changes speed or direction it gives off an electromagnetic (EM) wave. How
fast the wave ‘wiggles’ determines what kind of EM radiation is created. EM can be placed in order from
lowest energy to highest energy as follows: Radio, Infrared, Visible Light, Ultraviolet, X-Rays, and
Gamma Rays. The chart below also shows Frequency and Wavelength as well as Energy. These three are
related through two equations: f=c/λ and E=hf (f=Frequency; c=speed of light (~300,000km/sec);
λ=wavelength; E=energy; h= Planck’s constant (~6.626 × 10⁻³⁴ Joules·sec)). The equations show that as
the energy increases, the wavelength decreases and the frequency increases.

       http://son.nasa.gov/tass/images/cont_emspec2.jpg

EM vs. Sound
What are the differences between these two?
  • Sound is longitudinal (travels with the wave direction) while light is transverse (travels
      perpendicular to the wave direction).
  • Sound travels at about 1,100 ft/sec while light travels at about 186,000 miles/sec.
  • Sound travels only in matter while light can travel through a vacuum.
  • Sound is vibrating matter while light is vibrating electrons.

The EM Spectrum and Objects You Can See With It
As the picture below shows, many objects are viewed better in different types of electromagnetic (EM)
radiation. Remember that the higher up in the picture you go, the more energetic the object has to be.
Therefore, cooler objects will be near the bottom while really ‘hot’ objects will be near the top.
Remember that all pictures that are not visible light are representations in false color (i.e.: made so we can
see them as if we could see that frequency of the electromagnetic spectrum).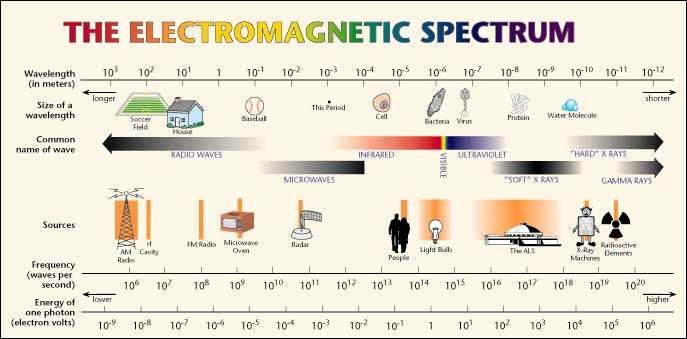
Hot Interstellar Gas                          Supernova     Gas Jets

Pulsars                       Black Hole

                                                                Solar Flare
                                 Gamma Rays
                                 And X-Rays

Solar Flare                           Ultraviolet               Hot Young Star

                             (All pictures from NASA)

Galaxies                                                        Sun
                                       Visible

                              Stars
Interstellar
Dust Clouds                            Infrared
                                                    Humans

                                      Microwave
                                      And Radio
Cosmic Background                                        Gas Jets
 Radiation (3K)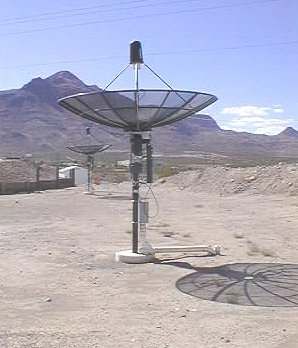
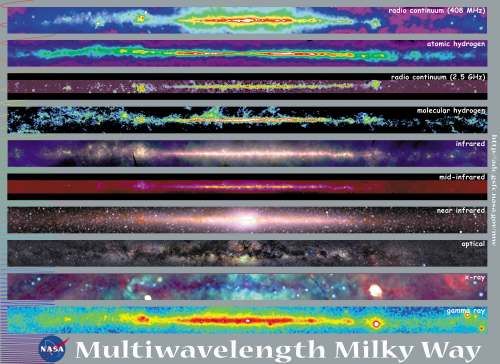
The pictures below are of the Milky Way galaxy – the galaxy we live in - and are a 360 degree
representation like opening the globe of the Earth into an oval as is often done in classroom wall charts of
the Earth. (All pictures below are from NASA)

The EM Spectrum - Radio
Radio signals
are able to
reach Earth
and so many
large radio
observatories
have been
built to look
at objects
through this large portion of the EM spectrum. The pictures above shows the Milky Way galaxy in a 360
degree map view in both visible light (left) and radio radiation (right - 408 MHz). Remember that radio
radiation allows us to look at objects that emit relatively low energy. This includes dust and gases in the
galaxy and solar system.

The EM Spectrum - Infrared
In terms of
energy and
frequency,
Infrared
radiation (IR) is
the next ‘band’
of radiation
above radio
frequencies. It is what we associate with heat (the lamps used to keep food warm at fast-food places).
These two pictures show the Milky Way galaxy in visible light (left) and Infrared (right). Infrared
radiation is used to view moderately warm objects. You can see the galaxy clearly in both pictures but
using the IR image we can now see the dust in the solar system. (The ‘S’ shaped pink curve in the right
picture). This allows astronomers to ‘see’ dust and gas that is invisible to our eyes and optical telescopes.

The EM Spectrum - Ultraviolet
Remember that visible light comes after IR and UV comes after visible light in terms
of energy. The picture to the right shows features on Jupiter in both visible light (top)
and ultraviolet (UV) (bottom). The auroras on Jupiter are only seen using the UV
pictures because they are created by highly energetic particles being drawn to the
poles by the magnetic field of Jupiter (or any planet with a magnetic field, including
Earth).
Ultraviolet radiation shows objects that are fairly
energetic. In the picture of the M74 galaxy (at the
right), we can see the distribution of energetic
particles and gases - things we cannot see as well in
visible light.
The EM Spectrum - X-Rays

These two pictures
show the Milky
Way galaxy in
visible light (left)
and X-Rays (right).
X-Ray radiation is
used to view very
hot objects. You can see the galaxy clearly in both pictures but using the X-Ray image we can now see
very energetic objects that are invisible to our eyes and optical telescopes. Note that not all of these
objects are within the plane of the galaxy (majority of mass is oriented horizontally in this view).

The EM Spectrum-Gamma Rays
These two pictures show
the Milky Way galaxy in
visible light (left) and
Gamma Rays (right).
Gamma Ray radiation is
used to image the most
energetic objects. You
can see the galaxy
clearly in both pictures
but using the Gamma Ray image we can now see the most energetic objects in our part of the universe
that are invisible to our eyes and optical telescopes. Note that not all of these objects are within the plane
of the galaxy.
Milky Way Galaxy at Different Wavelengths
Why Radio?
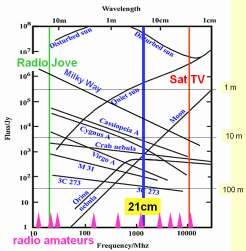
Wavelengths Available From Earth
As you can see from the picture to the right,
only light and radio are readily available
from Earth’s surface (a few wavelengths of
IR are as well). If you want to observe from
Earth’s surface, you need optical or radio
telescopes. Also note that radio offers at least
100 times more observable wavelengths than
optical.
What Causes Radio Emissions?
I. Thermal Radiation Picture from: ipac.jpl.nasa.gov/media_images/large_jpg/background/transgraph_colorized.jpg
All objects with a temperature emit radiation in proportion to their absolute temperature (more accurately
4
- proportional to T ). Thermal Radiation is the most basic form of EM radiation. There are three types of
thermal radiation observed:
• Blackbody
• Free-Free
• Spectral Line
Blackbody Radiation and Temperature
The radiation given off by any object is
related to its temperature. The lower the
temperature, the lower the energy or
frequency of radiation given off and vice
versa. A blackbody is a theoretical object that
completely absorbs all of the radiation that
hits it, and reflects nothing. The object reaches
a stable temperature and re-radiates energy in
a characteristic pattern (spectrum). The
spectrum peaks at a wavelength that depends
only on the object's Picture from: www.ecse.rpi.edu/~schubert/Light-Emitting-Diodes-dot- temperature.
org/chap18/F18-02%20Planck%20black%20body.jpg
Free-Free Thermal Radiation
Another form of thermal emission comes from gas which has been ionized.
Atoms in the gas become ionized when their electrons become stripped
from the atom. This results in charged particles moving around in the
ionized gas. As this happens, the electrons are accelerated by the charged
particles, and the plasma emits radiation continuously. This type of
radiation is called "free-free" emission or "bremsstrahlung".
Some sources of free-free emission in the radio region of the EM spectrum
include ionized gas near star-forming regions or Active Galactic Nuclei
(AGN).
Picture from: en.wikipedia.org/wiki/File:Bremsstrahlung.svgSpectral Line Thermal Radiation
Spectral line emission involves the transition of electrons in atoms from a higher energy state to lower
energy state. When this happens, a photon is emitted with the same energy as the energy difference
between the two levels. The emission of this photon at a certain discrete energy shows up as a distinct
"line" or wavelength in the EM spectrum.
Non-Thermal Radiation
Non-thermal emission does not have the characteristic curve
of blackbody radiation. It turns out to be the opposite, with
radiation increasing at longer wavelengths.
There are 2 basic types:
• Synchrotron (see picture at right for explanation)
• Maser
Picture from: http://abyss.uoregon.edu/~js/images/synchrotron.gif
Synchrotron radiation is caused by a charged particle
spiraling around a strong magnetic field line and emitting
radio signals. (A similar radiation is cyclotron radiation
which occurs when the field and particle values remain
constant – rare in astronomy). This occurs at Jupiter and many other objects in the sky such as galaxies
and black holes.
Masers are naturally occurring stimulated radiation at a single frequency associated with a particular
chemical such as water, hydroxide (OH) and many others. They are generated in much the same way that
lasers are. Atoms are forced into excited energy states and can amplify radiation at a specific frequency.
These atoms are placed in a chamber that creates feedback and produces coherent radiation (all one
frequency of radiation – like a laser). Objects that may have masers in them range from comets, planetary
atmospheres, stars, nebulae, supernova remnants and galaxies.
Noise and its Nature
There are several sources of noise in radio astronomy. First,
there is the noise associated with objects in space. Any object
will emit EM radiation at varying intensities and frequencies
therefore generating a random noise background level. Second,
there are man-made signals which bleed into our frequencies of
interest. Anyone who has attended the SARA Conference and
met Wes Sizemore knows about NRAO’s efforts to rid
themselves of interference from electric blankets, cell phones,
laptops, digital cameras and the like. Third are the electronic
noise sources brought about by quantum fluctuations within
chips and other electronics.
In many radio astronomy observation programs, the signal is
many times smaller than the background noise and the signal
must be detected using a variety of techniques (see chart on
right). These include using a larger antenna to gather more
signal, longer integration times (averaging of data), Chart from: astro.u-strasbg.fr/~koppen/Haystack/basics.html
extensive filtering and data processing strategies, cooling of electronics, etc.How Was Radio Astronomy Discovered? (Pictures in this section from the NRAO website)
Karl Jansky – 1905-1950
Karl Jansky joined the staff of the Bell Telephone Laboratories in Holmdel, NJ, in
1928. Jansky had the job of investigating the sources of static that might interfere with
radio voice transmissions at “short wavelengths” (wavelengths of about 10-20 meters).
These wavelengths were being considered for transatlantic radio telephones. After
recording signals from all directions for several months, Jansky identified three types of
static:
• nearby thunderstorms
• distant thunderstorms, and
• a faint steady hiss of unknown origin.
Jansky spent over a year investigating the third type of
static. It rose and fell once a day, leading Jansky to think
at first that he was seeing radiation from the Sun. The
signal repeated not every 24 hours, but every 23 hours
and 56 minutes (sidereal time – the motion of the stars).
This is characteristic of the fixed stars, and other objects
far from our solar system. He eventually figured out that
the radiation was coming from the Milky Way and was
strongest in the direction of the center of our Milky Way
galaxy, in the constellation of Sagittarius. The discovery was widely publicized, appearing in the New
York Times of May 5, 1933. Jansky wanted to follow-up on this discovery but Bell Labs did not.
Although fascinated by the discovery – no one investigated it for several years.
Grote Reber – 1911-2002
Grote Reber learned about Karl Jansky's discovery (1932) of radio waves from
the Milky Way Galaxy and wanted to follow up this discovery and learn more
about cosmic radio waves. Reber built a parabolic dish reflector in his
backyard in Wheaton, IL in 1937 because this shape focuses waves to the same
focus for all wavelengths. Reber spent long hours every night scanning the
skies with his radio telescope. He had to do the work at night because there
was too much interference from the sparks in automobile engines during the
daytime. After two failed attempts he finally succeeded with a receiver at 160
MHz (1.9 meters wavelength) to detect radio emissions from the Milky Way.
In the years from 1938 to 1943, Reber made the first surveys of radio waves
from the sky and published his results both in engineering and astronomy
journals, ensuring radio astronomy’s future.
For more on the history of radio astronomy check out the history section of the
NRAO’s website: www.nrao.edu/index.php/learn/radioastronomy/radioastronomyhistoryImaging: Radio vs. Optical
Optical Imaging
Images taken on modern optical telescopes use CCD cameras (digital
cameras) which use millions of dots (pixels) to represent the data.
Photodiodes collect light energy and convert these to voltages which are
downloaded by row and column to maintain their position information and
allow the re-construction of the image. Pixels are obvious in the image
below. One optical image contains millions of pixels – all Picture from: www.axis.com/edu/axis/images/ccd.gif
captured at the same time! They become more noticeable at higher
magnifications and lower resolutions. (See picture to left)
Below are some examples of digital astronomy images taken with a CCD
camera (note: all recent astrophotography have been done with CCD
cameras).
Picture from: photo.net/equipment/digital/basics/pixels.jpg
Solar Flare M 13 Globular Cluster
M 51 Galaxy Eagle Nebula
Pictures from www.noao.edu/image_galleryRadio Imaging
In contrast, radio telescopes can only collect one pixel at a time! Each radio image is a composite of many
data collections. Each image take hours, days, or even years! (One full sky image of an amateur’s back
yard sky could take years!). A big advantage of professional radio astronomy imaging is angular
resolution (the ability to separate two different objects). Professional radio telescopes (the VLBI – Very
Long Baseline Interferometry) can observe much smaller than a milliarcsecond (This is the angle a hair
makes at 10 miles!) whereas, optical telescopes can resolve only to 5 milliarcseconds with the Keck
Telescope. Radio telescopes can resolve better because you can simulate much larger radio telescopes by
linking many radio telescopes together. Their effective size is based on the diameter of the farthest linked
telescopes! On the other hand, an amateur can only achieve expect to achieve at best a few degrees of
resolution due to our small antenna size. For example, a 10’ dish observing
at 1.42 GHz would have a resolution of about 4-5 degrees. Below left is an
example from an amateur radio telescope’s data showing a 24 hour drift
scan of detected voltages made up of thousands of pixels. (One pixel every
10 seconds – this time is called integration time). To make this chart, the
radio telescope is locked in position and the sky rotates by. As objects enter
the antenna’s view (beam), their energy (detected voltage) increases
compared with the background sky and peaks are recorded (See the twin
peaks of the Milky Way galaxy’s core ¾ of
the way through the chart). When enough
single charts have been collected they can
be combined to get a multiple chart. When
all charts are put together, they can be
assembled into an image (middle picture
below). The far right picture shows the
same data in image form using black (low
intensity) and red (high intensity).
Professional Radio Images
Radio Quasar 3C175
The Neutral Gas Disk of the Milky Way
Radio Galaxy 3C288
Galactic Center
Atomic Hydrogen in M81
Images from: www.nrao.edu/imagegallery/php/level1.php SaturnLocating radio objects in the sky (RA and DEC) To share information with others, a reference system must be adopted. The system used by astronomers is the celestial coordinate system. After years of teaching that the night sky is not a sphere that rotates around the earth, it is ironic that this is what we are going to envision for our coordinate system. Since both the surface of the earth and the celestial sphere are surfaces of spheres (or nearly so) we can define any point on those surfaces with two coordinates. In nearly the same way that we use Longitude and Latitude to find a point on the surface of the earth, we use Right Ascension (RA) and Declination (DEC) to find objects on the celestial sphere. Azimuth and Altitude If you were to go out tonight and try to show someone the 'Big Dipper' you'd probably point to the object and use Azimuth and Altitude. Azimuth is the angle around the horizontal from due north and running clockwise. It corresponds to the compass directions with 0 degrees representing due North, 90 degrees due East, 180 degrees due South, and 270 due West. Altitude is the height of the object, in degrees above the horizon. Altitude can range from 0 degrees (on the horizon) to 90 degrees (directly overhead). A good approximation of these to use at night is your hand at arm's length. Your whole hand (thumb through pinky) is about 10 degrees and each finger is about 2 degrees. Although Altitude and Azimuth are useful for observing at night and showing others constellations and other objects, Graphic used by permission from Dr. Jim McDonald it is not helpful for us. This is because none of us are at the exact same latitude and longitude and so my altitude and azimuth information for the 'Big Dipper' would be different for you. Also, as the object rises and sets, it changes position in the sky. (See picture above) Right Ascension and Declination As I mentioned above, Right Ascension (RA) and Declination (DEC) are similar to longitude and latitude. If you picture the earth's North Pole projected into the sky this would correspond to the Celestial North Pole. And if you project the earth's equator into the sky this would correspond to the Celestial Equator. The longitude lines on a celestial sphere are called Right Ascension. Right Ascension is measured on the celestial equator in an easterly direction. Instead of measuring in degrees though, it is measured in hours, minutes, and seconds. A full rotation corresponds to 24 hours, roughly the time it takes for the sphere to rotate once around. Each hour of right ascension is about 15 degrees on the celestial sphere. The Right Ascension of 0 hours occurs on the Vernal Equinox (first day of spring – equal day and night – 12 hours each). Declination corresponds to latitude and is measured in degrees above or below the celestial equator. An object above the celestial equator has a positive declination; an object below Graphic used by permission from Dr. Jim McDonald the celestial equator has a negative declination. Since this coordinate system is relative to fixed objects in the celestial sphere, the Right Ascension and Declination do not change and can be shared with anyone on the earth. (See picture above)
Practical Applications/Examples
Optical:
Now that we have a working knowledge of celestial coordinates, let's take a look at how to use them by
looking at a portion of an optical sky map and do a few examples. Use the chart below to answer the
following questions.
       Find the star name and the constellation for the following:
          Star #            RA             Dec             Star Name             Constellation
             1             6:43            -17
             2             7:43            +28
             3             5:53            +07
       Find the RA and Dec for the following stars:
          Star #            RA             Dec             Star Name             Constellation
             4                                               Castor                  Gemini
             5                                               Capella                 Auriga
             6                                                Rigel                  Orion

                                                                             The answers are as follows:
                                                                            Star #1 = Sirius, Canis Major
                                                                                Star #2 = Pollux, Gemini
                                                                             Star #3 = Betelgeuse, Orion
                                                                                      Star #4 = 7:30, +32
                                                                                      Star #5 = 5:14, +46
                                                                                      Star #6 = 5:13, -08
Radio:
Below is a map I made of my observations with some point sources from charts with their flux in
Janskys. Try the following examples:
#1) You find a large peak at 05:33:00 RA, +21:59:00 Dec - What object is it?
#2) You find a small peak at 16:49:00 RA, +15:02:00 Dec - What object is it?
#3) You find a large peak at 12:29:00 RA, +12:31:00 Dec - What object is it?
Answers to Radio Examples:
#1 Taurus A
#2 Hercules A
#3 Virgo ADeciding on a Project
Now you are better able to start deciding on a project. This will ultimately depend on several factors
including: your electronics “know-how”; the types of recordings you want to make; the expense; help you
may need; Mentors that are available and willing to work on your project and information on the SARA
website (www.radio-astronomy.org/).
Common Amateur Radio Projects (by Frequency)
The table below lists most of the radio projects I’ve ever heard of and will give you a good idea of the
types of projects that you can attempt. Projects will be discussed in a bit more detail following this table.
ITU Radio
Radio Projects Sources of Radio Signal
Bands
Earth-based phenomena associated with
Whistler Radios and VLF Radios
lightning, auroras, and solar activity.
SLF (30-300 Hz)
SID (Sudden Ionospheric
ULF (300-
Disturbance) Radios - (AAVSO
3000Hz) VLF (3- Ionosperic disturbances caused by the sun.
30KHz) LF (30- (American Association of Variable Some have investigated Gamma Ray Bursts
Star Observers) and Stanford/SARA
300KHz) with these radios as well.
are sources for these radios and plans
for them as well.)
Jupiter and Solar (18-30 MHZ)
Jupiter storms due to Io charged particles.
(Radio Jove is a source for these
HF (3-30 MHz) Solar storms - Flares et. al. Some Pulsar work
radios)
has been done in this band.
Pulsar Detection
VHF (30- Meteor detection - signal bounces off ionized
FM Meteor Detection
300MHz) meteor trails.
Galactic Sources - Supernova remnants,
Continuum/Drift Scan (usually at 406 Active star forming regions, etc.
MHz; 1420 MHz (Hydrogen gas Gamma Ray Bursts / SETI (Search for Extra
UHF (300-3000 spectral line); 1667 MHz (OH Terrestrial Intelligence - uses the "water
MHz) molecule spectral line). hole" (H and OH lines) as a search frequency
zone.
Doppler shift work - usually within regions of
Spectral Scans (1420 MHz)
our own galaxy (the Milky Way).
Extraterrestrial satellites. Cassini, Venus probe, Planck, etc.
Demonstration telescope and possible
Itty-Bitty radio Telescope (IBT)
SHF (3-30 GHz) research capabilities.
SETI (Search for Extra Terrestrial
Intelligence)ELF/Whistler Radio Astronomy (INSPIRE), etc. *(easy to make but requires special location to observe) Whistler radios (named for the whistle-like sound heard when radio signals from lightning bounce along magnetic field lines and disperse) detect the electromagnetic radiation (EM) from lightning and other effects on the Earth as they react with the atmosphere. Events such as lightning, aurora, solar flares, etc. produce EM. Sometimes these signals travel along magnetic field lines and the frequencies become dispersed producing whistlers. I use the program Spectrogram 12 by Spectrogram from data on Steve Mc Richard Horne www.visualizationsoftware.com/gram.html Greevy’s Web site – http://www- to view sonograms of my data and visualize sferics (clicking pw.physics.uiowa.edu/mcgreevy/ sound from lightning that is close by), tweeks (musical sounds like a musical saw created by lightning at a distance up to hundreds of miles away), whistlers (described above) and chorus (auroral radiation creates sounds like those of crickets and birds chirping). The best time to observe is pre-dawn in an area far from power lines. For more information be sure to check out the • SARA website: www.radio-astronomy.org • INSPIRE website: theinspireproject.org/ • QEX Magazine – March/April 2010 – available with permission on the SARA website VLF radio astronomy & Solar radio astronomy *(easy to make and use) Solar Flares are a tremendous explosive burst of light, material and energy from the sun. This energy can affect the ionosphere, changing the height of the D, E and F layers and affects communications, etc. The flare induced changes in the ionosphere can be detected using various radio frequencies. The AAVSO (American Association of Variable Star Observers) has chosen to use VLF. Within the VLF I chose to use the 24.0 KHz signal from Cutler, Maine. Check out the AAVSO site for all the relevant information and schematics: www.aavso.org/committees/solar/equipment.stm There are circuit boards available that make it much easier to build. Most parts are available from Radio Shack. The antenna is easy to make but consists of 125 turns of wire! This is an easy project, well within the skills of most members. There is also a great VLF radio available through SARA called SuperSID that allows you to observe several VLF stations. Check out the link below for more information. Radio Flares Detected flares are generally caused by X-Ray Flares on the Sun and have various flux levels (energy/particle flow levels) associated with them. The Charts In chart 1 a quiet day with no flares present is shown - note Chart 1 the peaks on both ends - called the “sunrise effect”. Chart 2 shows a day with several large flares. Flares usually appear as upward peaks - on my receiver they appear as downward troughs. These are M1.6 & M2.3 flares (respectively). Chart 3 shows a day with an amazing X 14.4 flare! Flares are classified as A, B, C, M and X in order of increased energy. The higher the letter and higher the number the more energetic the flare is. An X 14.4 is an amazing flare!
Chart 2                                                 Chart 3

For more information be sure to check out the
   • SARA website: www.radio-astronomy.org
   • AAVSO website: www.aavso.org/solar-sids
   • SuperSID website: solar-center.stanford.edu/SID/sidmonitor/
   • QEX Magazine – January/February 2010 – available with permission on the SARA website

Jovian radio astronomy (Radio Jove)/Decametric radio astronomy/Planetary radio astronomy
*(Radio Jove is fairly easy to make and use but requires a large antenna – you can use SW radio as well)
This project requires a large antenna size which can be a
determining factor. A receiver was set-up at the SARA
conference the last two years and it was fascinating to
listen to. The radio noise storms of interest can be heard
from about 18-30 MHz. Two types of storm noise can be
heard: L-bursts (long bursts) sound like waves crashing on
a shore while S-bursts (short bursts) sound like popcorn
popping. Sometimes these radios will detect lightning
noise which can sound like popping so be aware of the
weather in your area when interpreting your recordings.
Solar storms can also be detected with this radio and sound
like changes in static levels. There are several levels of activity you can
detect. Check out the sites below for more information.

For more information be sure to check out the
   • SARA website www.radio-astronomy.org
   • QEX Magazine – May/June 2010 – available with permission on the
      SARA website
For more information and to hear sound samples check out
   • Jim Sky’s website at www.radiosky.com/rjcentral.html
   • Radio Jove website at radiojove.gsfc.nasa.gov/
Meteor Detection by Radio *(You can use FM or SW radio for some detections so it’s fairly easy to use)
Radio signals bouncing off meteors is a popular ‘sport’
with ham operators. As meteors pass through the
atmosphere they ionize gas and radio signals can bounce
off the ionized trail and be detected. An FM antenna and
FM radio are often used to observe. You look up a radio
station that is a long way away from you (several hundred
miles) and can not be heard. You then point an antenna
toward the station direction on a meteor shower night and
record meteor signals on a sound recorder or other device.
Signals sound like stations fading in and then out again –
sometimes quite quickly.
For more information be sure to check out the Graphs from: members.bellatlantic.net/~vze2n9fe/meteor/meteor.htm
• SARA website www.radio-astronomy.org
• Spaceweather Radio Meteor website: spaceweather.com/glossary/forwardscatter.html
• Sky Scan Science Awareness Project website: www.skyscan.ca/radio_meteor_detection.htm
• A Student Project Using FM to Detect Meteors:
members.bellatlantic.net/~vze2n9fe/meteor/meteor.htmContinuum Radio Astronomy/Hydrogen Line (OH and Other Lines) Radio Astronomy/Spectral Scans
*(Requires specialized equipment – difficult to make – you can buy units from Radio Astronomy Supplies)
Common Project: Drift Scan/Total Power Radio-1420 Mhz.
Generalized radio telescope
Mapping http://www.ap.smu.ca/~lonc/radiotel.html
If you’ve ever taken a digital photo you know that you can take
millions of pixels with one shot. Unfortunately, radio
astronomy uses a one pixel per observation instrument and it
takes a long time to compile enough data for a picture. Many
people want to create a picture of the sky from their backyard.
A generalized radio telescope is shown at the right. The LNB
amplifies the detected signals and converts them to a lower
‘intermediate’ frequency (I.F.) to avoid loss in the cables (lower
frequencies travel with less loss through cables). The I.F.
amplifier then amplifies the lower frequency signal and passes
it to a diode detector which detects only the signal’s strength not all the oscillations of the signal itself.
The voltage offset allows us to adjust the signal’s position on our chart and the chart recorder tracks the
final signal detected. There are dealers who sell these instruments (see below links). A typical radio
telescope is shown below. After ten years of data collection there were enough charts (twelve of each
altitude) to create graphs of each altitude from 25-75 in five degree increments. They were averaged and
created the Excel graph of all eleven altitudes shown below. (The large peak is the Milky Way galaxy).
The data was then used in Mathematica to create a 3-d graph of the data and thus a final picture (see
picture below). Ten years to get one picture!
Excel Graphs
Final 3-D
Graph/Picture
My 1420 MHz Total Power Telescope – 10’
dish with horn leading to temperature
controlled LNA, IF Amp, detector (in cooler),
then leading to voltage amp (foam box), then to
A/D device and computer (in plastic bin).
Power supplies are on wooden stand.
For more information be sure to check out the
• SARA website: www.radio-astronomy.org
• Radio Astronomy Supplies website: www.radioastronomysupplies.com/
• QEX Magazine – July/August 2010 – available with permission on the SARA websiteArtificial satellite detection
*(You can use SW radio for some detections so it’s fairly easy to use – you need tracking information
from the web and may need specialized antennas for more distant or weak object detection)
Many ham radio operators and/or SARA members have tried this. Since
some satellites can be detected with standard SW radio equipment this
project should be within the reach of any ham or amateur radio person.
Internet tracking sites are available (see below).
For more information be sure to check out the
• SARA website www.radio-astronomy.org
• Space Tracking Notes website:
www.svengrahn.pp.se/trackind/trackin1.htm.
Spectrograph from: http://www.svengrahn.pp.se/trackind/Skylab/Skylab.html
Itty-Bitty radio Telescope (IBT)
*(In its simplest form (a satellite detector and dish antenna) it is quite simple to make and use – the more
advanced model described below can be obtained through the
SARA/NRAO Navigators program)
The IBT is built using a satellite TV dish antenna and a satellite finder
usually hooked to a meter to show signal strength. In 1998 SARA
member Chuck Forster started investigating using a satellite dish antenna
as a portable radio telescope since many were available. Unfortunately, a
back end could not be found and was difficult to design. Later that year
SARA member Kerry Smith was the first to realize that the Channel
Master satellite finder could be used as a back end after helping a friend
reposition his satellite dish with the meter. Kerry later modified the
Channel Master to support a DC analog output, a MAX 187 A/D output
to be used with Jim Sky’s SkyPipe software as well as amplifying the
oscillator to provide an audio output so signal strength could be heard as a
pitch change. This was a great step forward for educating students since
most can not see the meter movement clearly but none can miss the
change in pitch associated with a signal. Chuck named it the LBT (Little
Bitty Telescope) but later NRAO (the National Radio Astronomy
Observatory) Education Officer SueAnn Heatherly named it the IBT and
that name stuck. Kerry and SARA later teamed up with NRAO to create a An IBT showing the LNB on top
group called “Navigators” which is a team of people that bring the IBT to for easier aiming, the DSS dish, the
schools and other group meetings and show people what radio astronomy Channel Master (bottom left) with
is. A CD and DVD set was developed to provide IBT users with videos of amplified speaker, and the battery
IBT use as well a support material such as PowerPoint presentations, pack below.
lessons, and ideas on presenting to groups. A more advanced version of
the IBT is currently being developed which will be sensitive enough to use
for student research projects as well as education. It is hoped that it will be put into production soon and
they may be available to SARA members in a year or so.
For more information be sure to check out the
• SARA website www.radio-astronomy.org
• NRAO IBT website: www.gb.nrao.edu/epo/ambassadors/ibtmanualshort.pdf
• David Fields’ IBT website: www.roanestate.edu/obs/IBT%20TAO%20poster.pptAdvanced Radio Projects (Difficult projects – probably not for beginners)
Gamma Ray Bursts
Lately, Gamma Ray Bursts (GRBs) have been in the news. This high-
energy radiation comes from distant and mysterious cosmic explosions.
Scientists are not sure what causes these bursts, but they do know that
GRBs come from some of the most distant regions of the universe and
that they produce the most powerful explosions ever witnessed. This is a
more difficult project but SARA member Jim Van Prooyen has observed
several GRBs. Check out his article below.
For more information be sure to check out the Graph from: www.qsl.net/df3lp/projects/sid/
• SARA website www.radio-astronomy.org
• Jim Van Prooyen’s article:
www.radioastronomyresearch.com/radio_astronomy_articles/post-29-Gamma-Ray-Bursts.htm
• Another article about detecting GRBs: www.qsl.net/df3lp/projects/sid/
Pulsars
When a star supernovas, its core is often crushed into a
neutron star with tremendous magnetic fields (at least 1000
times Earth’s magnetic field) and spin. The spin sweeps
out a powerful beam of EM that can be detected from
Earth. Many of these objects are extremely accurate time
keepers and are used to check accurate clocks. Since these
objects spin at a rate of a second or less, the pulses are
swept past Earth at this rate. This makes detection by
amateurs a real challenge. First you must detect a very
small signal. Second, the pulsar’s period of rotation needs
to be detected and this can be done by amateur only after
setting the recording interval (integration time) to an even Graph from: www.radio-astronomy.org/pdf/pulsars.pdf
fraction of the period (i.e.: you must know the period of what you are trying to observe). With this timing
and many observations it is hoped that the pattern will emerge. One SARA member (Jim Van Prooyen) is
currently studying pulsars with a Radio Jove device.
For more information be sure to check out the
• SARA website www.radio-astronomy.org
• Jim Van Prooyen’s article: www.radio-astronomy.org/pdf/pulsars.pdfAdvanced Radio Projects (continued)
Interferometry
Combining two or more signals into a coherent signal you can study
is another real challenge. Both antennas must be pointing very
accurately and timing of the received data is critical. The receivers
must be phase-locked together. A phase-locked loop is a circuit that
uses a stable, generated frequency (usually using a stable crystal)
and a circuit that compares a tuning frequency to the generated
frequency. The difference between the two is used to adjust the
tuning frequency to essentially lock the phases of the two signals
together. This creates a lock between the two and a very stable
tuning system and allows the tuning between two radio telescopes to
be comparable. The advantage of interferometry is that you can
simulate a much larger antenna with smaller ones. This method is
being used by professionals because of the relatively inexpensive
smaller dishes available now and modern computing power and
software. This combination allows them to gather finely resolved
data (down to milli-arcseconds). Several SARA members are
currently experimenting with this including Bruce Randall who Picture from:www.nrao.edu/epo/
gave a talk on this topic at the SARA conference in 2010. amateur/amastropg2.jpg
For more information be sure to check out the
• SARA website www.radio-astronomy.org
• Amateur Interferometry Project: www.nrao.edu/epo/amateur/N2I2.pdf
• ERAC (European Radio Astronomy Club) Basics of Radio Interferometry PPT:
www.eracnet.org/workshop/doc/basics.pdf
First draft written by:
Jon WallaceYou can also read