INVESTING IN JAPAN November 2020 - White Paper
←
→
Page content transcription
If your browser does not render page correctly, please read the page content below

November 2020
White Paper

INVESTING IN JAPAN
Japan’s Relevance to the Global Economy
Japan is an established global economic leader across a wide variety of measures. It is the third largest economy in the
world, behind only the United States and China 1. Known for its economic diversity and sophistication, Japan has
consistently ranked as the most complex economy in the world by Harvard studies 2. It is home to leading companies in
both production and technological advancements across a variety of industries. In addition to being the fourth-largest
exporter in the world3, Japan also has a strong domestic economy powered by the third largest consumer market in the
world4. Across various measures, Japan is an economic power to be reckoned with.

Figure 1: Japan’s Economic Rankings: 10 Largest

 10 Largest by 2019 GDP                                 10 Largest by 2019 Exports of                               10 Largest by 2019 Household
 (US$ trillion)                                         Goods and Services (US$ trillion)                           Consumption (US$ trillion)
          US                                 $21.4            China                                   $2.6                United States                         $14.0
      China                         $14.7                        US                                   $2.5                          China                $5.4
      Japan               $5.1                             Germany                            $1.8                                  Japan          $2.8
  Germany             $3.9                                    Japan                 $0.9                                       Germany             $2.1
        India        $2.9                                        UK                 $0.9                               United Kingdom             $1.9
          UK         $2.8                                    France                 $0.9                                             India        $1.6
     France         $2.7                                Netherlands                $0.8                                           France          $1.5
        Italy       $2.0                                      Korea               $0.7                                                Italy       $1.3
       Brazil      $1.8                                 Hong Kong                 $0.6                                              Brazil        $1.2
    Canada         $1.7                                    Singapore              $0.6                                           Canada           $1.0

 Source: IMF as of 2019                                 Source: World Bank as of 2019                            Source: World Bank as of 2019

The Japanese equity market is no less significant. The Japan Exchange Group is the third largest exchange by market
capitalization and second largest by number of listed companies, with over 3,670 companies representing over $5.7
trillion in market capitalization. The market is considered one of the broadest and deepest opportunity sets in the world5
and offers high levels of liquidity to investors and traders. Japan is the second largest country in the MSCI World Index,
however, global asset allocators have long been underweight Japanese equities due to its significant underperformance
over the past several decades.

Figure 2: 10 Largest World Stock Exchanges by Market Capitalization
                                                                                  8. London Stock Exchange

                                 $2.0 T
                                                                        $3.2 T                                             3. Japan Exchange Group
                    9. TMX Group                                                                  4. Shanghai Stock Exchange
                                             $21.0 T
                                                                                  $4.3T                  $5.3 T            $5.7 T
                1. New York Stock Exchange
                                                                    6. Euronext
                                                                                             $2.2 T     $3.9 T
                                              $14.6 T                                                             $4.9 T
                                 2. NASDAQ
                                                                           9. Saudi Stock Exchange

                                                                                          7. Shenzhen Stock Exchange
                                                                                                                    5. Hong Kong Stock Exchange

 Source: World Federation of Exchanges as of August 2020

Japanese Equity Markets Explained
Formed in 2013 by the merger of the Tokyo Stock Exchange (TSE) and Osaka Securities Exchange, the Japan
Exchange Group operates multiple securities exchanges within Japan. While all stocks in Japan are listed with the
Japan Stock Exchange, there is a wide array of listings, each with its own set of criteria, including the number of
shareholders of the company, market capitalization, profitability and the number of years the company has been
established.
                                                                                                                                                                    1
Main Market6
The main market is where leading Japanese and foreign companies are listed. These listings are split into first and
second sections, which respectively focus on large and mid-sized companies. The second section is considered entry-
level, where mid-sized companies can list and later be upgraded to the first section upon meeting the required criteria.
The main market, especially the first section listings, is among the largest and most liquid in the world. Foreign investors
typically represent the largest part of trading volume among these companies.
Mothers7
Mothers (Market of the high-growth and emerging stocks) is a trading market for high-growth start-up companies aiming
to be upgraded to the main market. The aim of this market is to offer financing opportunities for less established
companies early in their growth phase. As such companies within this category are required to demonstrate high growth
potential but there are no restrictions in terms of size or business type. Given its nature, companies listing in this
category tend to have business models that revolve around technology. Individual retail investors typically represent
most of the trading volume among these companies.
JASDAQ8
Like Mothers, Jasdaq is a listing category with bias towards growth and smaller companies. However, the criteria for
Jasdaq listing tend to be easier to meet for companies that are still in early growth stages. The concept is that companies
within this listing category should offer reliability, innovation and regional or international reach. These listings are further
split into standard and growth sections: standard market is dedicated for growth companies of a certain size and
performance while growth market is dedicated to companies with stronger future growth potential and unique business
models. Individual retail investors typically represent most of the trading volume among these companies.
Figure 3: Listing Category Characteristics
Main Market JASDAQ
Mothers
1st Section 2nd Section Standard Growth
Market Cap. (USD B) 35,449 32 35 95 2.6
Number of Stocks 2175 480 327 662 37
Market Cap Range $19M to $215B $8M to $12B $15M to $9B $6M to $7B $10M to $322M
Main Sectors / & Industrials, Industrials, IT, healthcare, Consumer, Healthcare,
Industries consumer, IT, consumer, IT, consumer, industrials, IT, communications,
communications materials communication healthcare IT, consumer
Key participants by trading Foreigners Local Retail Local Retail Local Retail
volume
Number of Shareholders 2.200 or more 800 or more 200 or more 200 or more
Minimum Number of 3 Years of more 1 Year of more - -
Years of Business
Operation
Amount of Profits or Ordinary Profit: Total of ¥ 500 - Ordinary Profit: Total -
Market Capitalization Million or more in the last 2 fiscal of ¥ 100 Million or
years more in the last 2
Market Cap: ¥ 50 Billion or more fiscal years
Sales: ¥ 10 Billion or more Market Cap: ¥ 5
Billion or more
Source: Japan Stock Exchange as of September 2020
A plan to reform the Japanese exchange has long been discussed and more recently has started to take shape. The
current proposals aim to reduce the number of market listings to three: Prime, Standard and Growth. In addition, the
working group is looking to change criteria for each category, a response to critics who have hailed them as too
ambiguous. The determinants for inclusion into Japan’s equity indices is also under review. While it’s too early to know
if and how these reforms will occur, the potential for change should be on investors’ radars given the potential impact
to listings and index compositions.
2Japan: Opportunity for Active Managers
After the highs of the 1980s, Japan's strong economic growth ended abruptly in the early 1990s with the bursting of the
economic and financial bubble. What started as the “lost decade” extended to the “lost 20 years”, referring to the period
of economic stagnation that lasted from 1991 to 2010. The general view was that Japan was a low growth economy
with challenging demographics and lack of shareholder alignment. Despite stagnant economic growth in the 90’s and
2000’s, the Yen remained relatively strong as a safe-haven currency which made many export-oriented companies less
competitive.
Two decades of challenging performance and investor disregard has reduced Japan’s market visibility among global
allocators, however, it remains the largest country weight outside the US in the MSCI World Index. More importantly,
the lack of attention from global allocators has created inefficiencies and attractive opportunities for skilled active
managers.
Under-owned
After a frustrating and extended period of performance, global allocators have largely abandoned Japan. Foreign
investors have been net sellers of its equity market and remain underweight this market. Those that remain invested in
Japan have tended to prefer passive investments. As foreigners account for more than 60% of market turnover, the
effect of their outflows has helped to explain at least part of the market’s lackluster performance9. Meanwhile local retail
investor allocation to equities remain low. While US households typically have a 34% allocation to equities, Japanese
allocations are closer to 10%10.
Figure 4: Foreigners have been Sellers of Japanese Equities
¥5
¥-
-¥5
-¥10
-¥15
Cumulative Net Foreign Flows from TSE Section 1 Stocks (in ¥ trillion)
-¥20
Jan-15 Jan-16 Jan-17 Jan-18 Jan-19 Jan-20
Source: Japan Stock Exchange as of September 2020
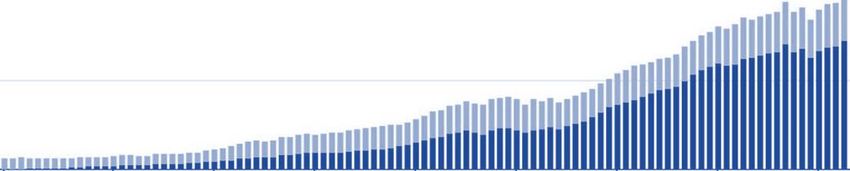
Without a significant presence of foreign and local retail investors, the Bank of Japan and Japanese Government Pension
Investment Fund (GPIF) have become increasingly relevant market participants as part of the Abenomics plan to revive
the stock market. As of March 2020, the GPIF’s target allocation to domestic equities was 25% of its ¥150 trillion
investment portfolio11. Meanwhile the Bank of Japan has spent the last 10 years ramping up its purchases of ETFs in an
attempt to stabilize the market and encourage investment. As of April 2019, the Bank of Japan is estimated to own
77% of the nation’s ETFs12. The importance of these market participants and their indiscriminate passive purchases
have at times led stocks to perform based on passive flows rather than stock specific fundamentals.
¥0 Figure 5: Bank of Japan Becomes a Significant Market Participant: Passive Investments in Japan
2010 2011 2012 2013 2014 2015 2016 2017 2018 2019
¥40
Bank
Bank of of Japan
Japan Holdings Rest
Holdings Rest of Market
of the the Market
¥20
¥0
2011 2012 2013 2014 2015 2016 2017 2018 2019
Source: Bloomberg
3Under-researched
Having transitioned from a dynamic market darling in the 1980s to a “fallen angel”, the financial service industry naturally
has shifted their attention away from Japan. The result is that on average, stocks in the MSCI Japan Index have less
than 65% of the sell-side coverage in comparison to the MSCI World ex-Japan Index, creating information asymmetry
that can be exploited by active managers. This information gap is even greater as investors move down the market
capitalization spectrum.
Figure 6: Sell Side Analyst Coverage by Market Capitalization: Japan vs Other Developed Markets
25
20.8
Average Number of
20
15.8
Analysts
15 13.8
9.8
10 8.2
4.8 5.5 4.8
5 1.9
1.1
0
Under US$ 0.5 B US$ 0.5-1 B US$ 1 -5 B US$ 5 -20 B Over US$ 20 B
MSCI Japan MSCI World ex Japan
Source: Sector Zen Letter as of September 2019. Nomura, MSCI and Bloomberg.
Deep and Diverse Market
Within the MSCI World Index, Japan is the country with the least concentration. As demonstrated in Figure 7, the top
10 stocks with in the MSCI Japan Index represent only 21% of the country index. Meanwhile other developed market
such as Germany and France, have their top 10 stocks representing over 50% of their respective indices. While most
global allocators use the MSCI Japan Index as their reference for Japan equity investments, there is an even larger and
diverse opportunity set beyond the index, as it only represents 9% of the listed stocks13.
Figure 7: Japan is the Least Concentrated Country in the MSCI World Index
100% 84%
76%
80%
53% 57% 55%
60% 50% 47%
44%
40% 26% 21%
20%
0%
US Japan UK France Switzerland Canada Germany Australia Netherlands Sweden
Weight of the Top 10 Stocks in their Each Country Index
* 10 largest countries in the MSCI World Index. Source: MSCI and Bloomberg as of September 30, 2020
Figure 8: A Large Opportunity Set Beyond the Index
Market Capitalization (US$ Billion) Constituents
The index represents 60% of the Stock Exchange in terms of The index represents 9% of the Stock Exchange in terms of
market capitalization number of constituents
4,000 3,663
8,000
6,077
6,000 3,000
3,535 2,000
4,000
2,000 1,000 320
0 0
MSCI Japan Tokyo Stock Exchange MSCI Japan Tokyo Stock Exchange
Source: MSCI and Japan Stock Exchange as of September 2020
4Transformative Moment with Low Valuations
Japan is at a transformational moment in its history. After two decades of economic struggle, Prime Minister Shinzo
Abe’s government enacted reforms in 2013 that have resulted in a fundamental shift in corporate governance and
economic outlook. The set of monetary and fiscal policies commonly known as Abenomics is comprised of three
“arrows” geared toward pulling Japan out of its deflationary slump, as detailed in Figure 9. The first two arrows are
designed to prop up the Japanese economy in the short term, while the third arrow is expected to support Japan's long
term growth and economic health.
Figure 9: Understanding the Abenomics
First Arrow Second Arrow Third Arrow
Aggressive Monetary Policy Fiscal Consolidation/ Flexibility Growth Strategy
▪ Double the monetary base ▪ Public works spending ▪ Regulatory reforms
▪ Target 2% inflation ▪ Government spending ▪ Liberalization efforts
▪ Open-ended asset purchases ▪ Tax incentives for companies ▪ Increasing the labor participation of
women
▪ Economic partnership
▪ Promotion of certain industries
Goal: Break the deflationary cycle. Spur Goal: Ignite economy. Improve consumer Goal: Growth Strategy that promotes
consumers to spend and make Japanese confidence and corporate profits private investment. Increase trade and
exports more competitive productivity
Source: Japan External Trade Organization
After a record term of over seven years as Japan’s prime minister, Abe stepped down due to health reasons in August
2020. At the time of his retirement, the first two arrows had already started showing signs of success while the third
arrow remains under way. The economy has accelerated, albeit still at a slow pace, and the labor market has improved
significantly with unemployment rate hitting a record low of 2.2% prior to the pandemic 14. Despite initial uncertainty
regarding the continuation of Abenomics after Abe, investors were reassured of Japan’s dedication to the program with
the election of Yoshihide Suga to prime minister. Suga has been Abe’s Chief Cabinet Secretary since 2012 and was a
key player in determining government policy.
With over seven years since its launch, the effects of Abenomics are taking shape and the economic revival underway
is a testament to the success of the first two arrows. While the third arrow is longer-term in nature and therefore still in
progress, its initial transformational effects are also already visible in Japan today. As early as 2014, the Abe
administration set corporate governance as one of the main agendas in its growth strategy. The goal was to improve
companies’ return on equity (ROE) and to lure foreign investors who have long avoided Japanese equities because of
weak corporate governance and low ROEs.
Figure 10: Improving Corporate Governance
Increasing Number of Independent Board Members* Increasing Number of Companies Subject to Shareholder
Proposals**
100% 60%
80% 50%
40%
60%
30%
40%
20%
20% 10%
0% 0%
2014
2017
2020
2015
2016
2018
2019
2014
2019
2010
2011
2012
2013
2015
2016
2017
2018
Ratio of 1st Section Companies with two or more Companies subject to shareholder proposals
Independent Directors
* Source: Tokyo Stock Exchange as of July 12, 2019 . https://www.jpx.co.jp/english/listing/others/ind-executive/index.html
** Source: Wall Street Journal and IR Japan as of June 2019. https://www.wsj.com/articles/ investors-new-weapon-in-japan-votes-to-embarrass-the-boss-11566295201
5Figure 10: Improving Corporate Governance (continued)
Increasing Share Buybacks*** Increasing Dividend Yield****
8 3
2.5
6
2
4 1.5
1
2
0.5
0 0
2005
2009
2012
2017
2019
2006
2007
2008
2010
2011
2013
2014
2015
2016
2018
2009
2012
2014
2017
2010
2011
2013
2015
2016
2018
2019
Announced Buybacks (Yen trillions)
Topix Dividend Yield
*** Source: Wall Street Journal and I-N Information Systems as of June 2019. https://www.wsj.com/articles/once-a-miser-japan-inc-is-opening-its-wallet-to-buy-back-
shares-11562752804
**** Source: Bloomberg as of December 2019.
By the end of 2019, it was clear that the shape and dynamic of company boards was changing. The relationship between
companies and with shareholders has improved, shareholder payouts are higher, and management has become more
receptive to activist shareholders. Dividend payout ratios have more than doubled since 2010, creating opportunities
for investors looking for income. Corporate profit margins are also higher and corporate ROEs have risen from low single
digit levels of the 1990s to closer to 10%, a level more similar to other developed markets15. However, these corporate
level improvements have not occurred in a uniform manner across companies. Large differences in corporate
governance adoption have created opportunities for active managers to differentiate between the leaders and laggards.
Figure 11: Japanese Equities Return on Equity Improve, Closing the Gap with other Developed Markets
20
Difference in ROE: S&P 500 vs MSCI Japan
Return on Equity (%)
15
10
5
0
Jan 1996 Jan 1999 Jan 2002 Jan 2005 Jan 2008 Jan 2011 Jan 2014 Jan 2017 Jan 2020
Source: Bloomberg as of September 30, 2020
Not only have the three arrows improved the landscape for investors, but it is also re-shaping the Japanese economy
and helping counter some of the country’s demographic challenges. First, in many cases these reforms are acting as a
catalyst for the further development of various industries. For example, labor reforms have generally resulted in greater
corporate investment in services. The government’s plans to promote the digital transformation of the country is also
expected to have ripple effects. These shifts are creating new opportunities for investors beyond the traditional
manufacturing and export-oriented companies.
In addition, many of the reforms within the Abenomics policy framework are aimed at addressing the demographic
challenges or at least leaving the economy in a better standing in terms of GDP growth to overcome these issues. Japan
is home to the world’s oldest population. Not only is the population ageing but it is also shrinking at an accelerated pace.
Labor reforms designed to increase labor participation rates have successfully enticed people to enter the workforce
who would have otherwise stayed at home to care for children or elderly. Meanwhile, Japanese companies are
developing solutions in various areas of technology, artificial intelligence and robotics to allow them to do more with
fewer workers.
6Figure 12: Overcoming Demographic Challenges
Annual Installations of Industrial Robots in 2019
Labor Force & Participation Rate: Japan
10 Largest Countries
7500 68% China
7000 66% Japan
6500 64% US
6000 62% Korea
5500 60% Germany
5000 58% Italy
France
4500 56%
Taiwan
4000 54%
Mexico
Sep-74
Sep-84
Sep-94
Sep-04
Sep-14
Jan-68
May-71
Jan-78
May-81
Jan-88
May-91
Jan-98
May-01
Jan-08
May-11
Jan-18
India
0 50 100 150
Labor Force (in 10 thousands of people) - 12 Month Average (LHS) Thousands of Units
Labor Force Participation Rate - 12 Month Average (RHS)
Source: Statistics Bureau of Japan, as of September 2020 Source: World Robotics 2020
Finally, after years of challenging performance, Japanese equity valuations remain well below other developed markets.
While P/E ratios in the United States are above historical average levels, Japan is well below both US levels and its own
average, offering attractive opportunities for investors. The promise of continued transformation, stricter corporate
governance and low valuations make Japanese equities an attractive opportunity for investors.
Figure 13: Japanese Valuations Remain Attractive - Shiller P/E Ratio in Japan vs United States
35
30
25
20
15
S&P 500 Index Average S&P 500 MSCI Japan Index Average MSCI Japan
10
Sep-08 Jun-09 Mar-10 Dec-10 Sep-11 Jun-12 Mar-13 Dec-13 Sep-14 Jun-15 Mar-16 Dec-16 Sep-17 Jun-18 Mar-19 Dec-19
Source: Bloomberg as of June 220. Averages are calculated from Jan 2005 – June 2020.
Conclusion
The Japanese economy and market continue to be one of the largest and most relevant in the world. After decades of
challenging performance, the country has embarked on a series of reforms designed to stimulate the economy and
promote confidence in its equity market. The effects of these changes are already under way.
While the story is attractive from a macro perspective, it is even more compelling from a bottom-up perspective. Japan’s
deep, diverse and liquid equity market offers many opportunities for active investment specialists across a wide range
of styles and biases. Structural changes to key industries have created opportunities for growth-oriented managers.
Activist managers, whether friendly or hostile, have found opportunities in the previously closed corporate environment.
Meanwhile, increased shareholder focus has increased dividends and opportunities for income-focused investors. Fast
improving corporate governance has also created opportunities for fundamental managers who are able to identify
changing management structures early. Finally, low analyst coverage among the smaller companies has left a large
area of the market under-researched and under-covered. In sum, experienced stock-pickers of various style biases
should have a fertile hunting ground for alpha-generation in the years to come. These on-the-ground local specialists
are often first to understand the nuances of the changing environment and its impact on their investment style and
universe. The importance of experience in finding trusted local partners is essential and will determine investors’ success
in taking advantage of the full array of opportunities that Japan offers.
7Important Notes & Disclosures
This presentation shall not constitute an offer to sell or the solicitation of any offer to buy which may only be made at the time a qualified investor
receives a final confidential private offering memorandum (the “Fund Documents”) describing an opportunity to invest with ABS (a “Fund”). In the
event of any inconsistency between this presentation and the Fund Documents, the Fund Documents will govern. This presentation being provided
to a prospective investor does not guarantee an investor’s qualification for an investment in the Fund or the Fund’s capacity for its investment. Such
criteria may only be determined upon completion of the Subscription Material for the Fund. Investments in any Fund will be suitable only for certain
financially sophisticated investors who have no need for immediate liquidity in their investment and can bear the risk of an investment in the Funds for
an extended period of time. There is no secondary market for interests or shares in the Funds and none is expected to develop. There are also
restrictions on transferring interests or shares and withdrawing or redeeming interests or shares from the Funds. The information herein is not
intended to provide, and should not be relied upon for, accounting, legal or tax advice or investment recommendations. You should make an
independent investigation of the investment described herein, including consulting your tax, legal, accounting, or other advisors about the matters
discussed herein. Information pertaining to our processes is subject to change at any time without notice.
Source: MSCI. The MSCI information may only be used for your internal use, may not be reproduced or redisseminated in any form and may not be
used as a basis for or a component of any financial instruments or products or indices. None of the MSCI information is intended to constitute
investment advice or a recommendation to make (or refrain from making) any kind of investment decision and may not be relied upon as such.
Historical data and analysis should not be taken as an indication or guarantee of any future performance analysis, forecast or prediction. The MSCI
information is provided on an “as if” basis and the user of this information assumes the entire risk of any use made of this information. MSCI, each of
its affiliates and each other person involved in or related to compiling, computing or creating any MSCI information (collectively, the “MSCI Parties”)
expressly disclaims all warranties (including, without limitation, any warranties of originality, accuracy, completeness, timeliness, non-infringement,
merchantability and fitness for a particular purpose) with respect to this information. Without limiting any of the foregoing, in no event shall any MSCI
Party have any liability for any direct, indirect, special, incidental, punitive, consequential (including, without limitation, lost profits) or any other
damages. (www.msci.com)
1
Source: IMF as of October 2020. GDP as measured in nominal US dollar terms.
2
Harvard Atlas of Economic Complexity as of 2018
3
World Bank as of 2019
4
World Bank as of 2018
5
Japan Stock Exchange as of September 2020
6
Japan Stock Exchange
7
Japan Stock Exchange
8
Japan Stock Exchange
9
Japan Stock Exchange
10
Bank of Japan as of March 2019
11
Japan Government Pension Investment Fund as of March 2020
12
Bloomberg as of March 2019
13
MSCI and Japan Stock Exchange as of September 2020
14
Japan Government
15
Bloomberg
8You can also read