INVESTOR PRESENTATION - 23rd Annual ICR Conference January 2021
←
→
Page content transcription
If your browser does not render page correctly, please read the page content below

INVESTOR
PRESENTATION
23rd Annual ICR Conference
January 2021

FORWARD-LOOKING STATEMENTS AND NON-GAAP
                         FINANCIAL MEASURES
Denny’s Corporation urges caution in considering its current trends and any outlook on earnings disclosed in this press release. In addition, certain matters
discussed in this release may constitute forward-looking statements. These forward-looking statements, which reflect management’s best judgment based on
factors currently known, are intended to speak only as of the date such statements are made and involve risks, uncertainties, and other factors that may
cause the actual performance of Denny’s Corporation, its subsidiaries, and underlying restaurants to be materially different from the performance indicated
or implied by such statements. Words such as “expect”, “anticipate”, “believe”, “intend”, “plan”, “hope”, “will”, and variations of such words and similar
expressions are intended to identify such forward-looking statements. Except as may be required by law, the Company expressly disclaims any obligation to
update these forward-looking statements to reflect events or circumstances after the date of this release or to reflect the occurrence of unanticipated events.
Factors that could cause actual performance to differ materially from the performance indicated by these forward-looking statements include, among
others: the rapidly evolving COVID-19 pandemic and related containment measures, including the potential for further operational disruption from
government mandates affecting restaurants; economic, public health, social and political conditions that impact consumer confidence and spending with
respect to social unrest and the COVID-19 pandemic; competitive pressures from within the restaurant industry; the level of success of the Company’s
operating initiatives and advertising and promotional efforts; adverse publicity; health concerns arising from food-related pandemics, outbreaks of flu
viruses or other diseases; changes in business strategy or development plans; terms and availability of capital; regional weather conditions; overall changes
in the general economy (including with regard to energy costs), particularly at the retail level; political environment (including acts of war and terrorism);
and other factors from time to time set forth in the Company’s SEC reports and other filings, including but not limited to the discussion in Management’s
Discussion and Analysis and the risks identified in Item 1A. Risk Factors contained in the Company’s Annual Report on Form 10-K for the year ended
December 25, 2019 (and in the Company’s subsequent Quarterly Reports on Form 10-Q and Current Reports on Form 8-K).

The presentation includes references to the Company’s non-GAAP financials measures. All such measures are designated by an asterisk (*). The Company
believes that, in addition to other financial measures, Adjusted EBITDA, Adjusted Free Cash Flow, Adjusted Net Income (Loss) and Adjusted Net Income
(Loss) Per Share are appropriate indicators to assist in the evaluation of its operating performance on a period-to-period basis. The Company also uses
Adjusted EBITDA and Adjusted Free Cash Flow internally as performance measures for planning purposes, including the preparation of annual operating
budgets, and for compensation purposes, including bonuses for certain employees. Adjusted EBITDA is also used to evaluate its ability to service debt
because the excluded charges do not have an impact on its prospective debt servicing capability and these adjustments are contemplated in its credit facility
for the computation of its debt covenant ratios. The Company defines Adjusted Free Cash Flow for a given period as Adjusted EBITDA less the cash portion
of interest expense net of interest income, capital expenditures, and cash taxes. Management believes that the presentation of Adjusted Free Cash Flow
provides useful information to investors because it represents a liquidity measure used to evaluate, among other things, operating effectiveness and is used
in decisions regarding the allocation of resources. However, Adjusted EBITDA, Adjusted Free Cash Flow, Adjusted Net Income (Loss) and Adjusted Net
Income (Loss) Per Share should be considered as a supplement to, not a substitute for, operating income, net income (loss) or other financial performance
measures prepared in accordance with U.S. generally accepted accounting principles. See Appendix for non-GAAP reconciliations.

                                                                                                                                                                  2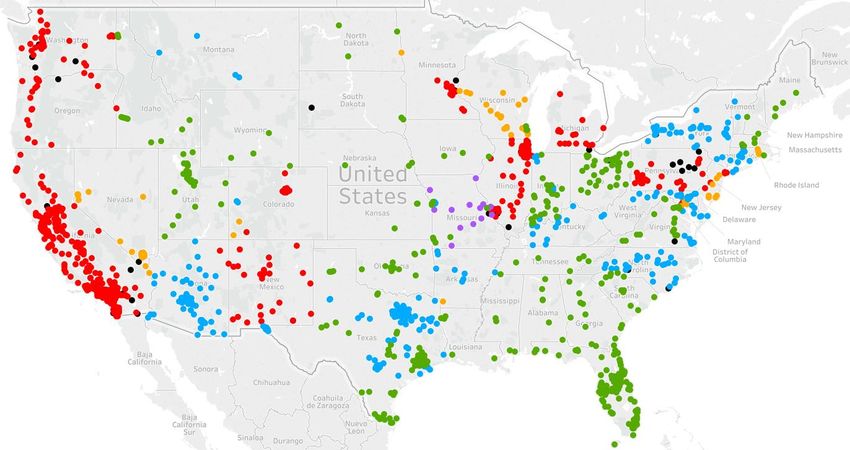
DENNY’S INVESTMENT HIGHLIGHTS

                CONSISTENT SAME-                                  •   Nine consecutive fiscal years of domestic system-wide same-store sales1
             S T O R E S A L E S 1 G RO W T H                         growth prior to the pandemic2
                       H I S T O RY                               •   Strong same-store sales1 performance relative to peers

               GLOBAL FOOTPRINT                               •       227 well diversified, experienced and energetic franchisees3
                WITH SEASONED                                 •       1,650 restaurants around the globe, including 1,504 domestic locations3
                 FRANCHISEES                                  •       146 international locations across 13 countries and U.S. territories3

               S T RO N G A D J U S T E D                     •       Generated nearly $417M in Adjusted Free Cash Flow* over the last 9 fiscal years2
             FREE CASH FLOW* AND                                         • Includes approximately $11M in real estate acquisitions2
             SHAREHOLDER RETURN                               •       Approximately $554M allocated to share repurchase program since November 20104

                DURABLE BUSINESS                              •       Recent transition to a more highly franchised model with reduced business risk
                 FOCUSED ON THE                               •       Proven revitalization strategies to continue propelling the brand forward
                     FUTURE                                   •       Record of consistent financial performance with market share opportunities post-pandemic
*     See Appendix for reconciliation of Net Income (Loss) to Adjusted EBITDA, Adjusted Net Income (Loss), Adjusted Net Income (Loss) Per Share (also called Adjusted Earnings per Share), and
     Adjusted Free Cash Flow.
1.   Same-store sales include sales at company restaurants and non-consolidated franchised and licensed restaurants that were open the same period in the prior year. Total operating
     revenue is limited to company restaurant sales and royalties, advertising revenue, fees and occupancy revenue from non-consolidated franchised and licensed restaurants. Accordingly,
     domestic franchise same-store sales and domestic system-wide same-store sales should be considered as a supplement to, not a substitute for, the Company’s results as reported under
     GAAP.
2.   Data as of December 25, 2019, the end of Fiscal Fourth Quarter 2019.
3.   Preliminary data as of December 30, 2020, the end of Fiscal Fourth Quarter 2020.
4.   Data as of February 27, 2020 (date the Company suspended share repurchases). The company raised nearly $70M through the issuance of 8M shares of Common Stock in July, 2020.

                                                                                                                                                                                            3
PRELIMINARY 2020
    RESULTS & COVID-19
    BUSINESS RESPONSE

4
2020 PRELIMINARY RESULTS
                                               Domestic System-Wide
                                                 Same-Store Sales1
                                                                                                                  Available Liquidity

                                         69%                                                                   ~$82M
                                        of 2019
                                                 New Unit Openings                                                          Portfolio

                                         20 New                                                            1,650
                                        Openings                                                         Restaurants
                                                                                                          Globally
1. Same-store sales include sales at company restaurants and non-consolidated franchised and licensed restaurants that were open the same period in the prior year. Total operating
   revenue is limited to company restaurant sales and royalties, advertising revenue, fees and occupancy revenue from non-consolidated franchised and licensed restaurants. Accordingly,   5
   domestic franchise same-store sales and domestic system-wide same-store sales should be considered as a supplement to, not a substitute for, our results as reported under GAAP.
CONSUMER FOCUS AREAS

Reassurance   Value         Comfort   Convenience

                                                    6
REASSURANCE

    We Remain Focused on the Safety and Well-being
     of Our Guests, Restaurant Teams, Franchisees,
              Employees and Suppliers

•    Enhanced training materials and communications
     distributed to entire system of restaurants
•    Reinforcing strict food safety procedures, handwashing
     and personal hygiene standards, and enhanced daily
     deep cleaning protocols
•    Remain in close contact with public health
     officials and government agencies to ensure
     all public health concerns are addressed

                                                              7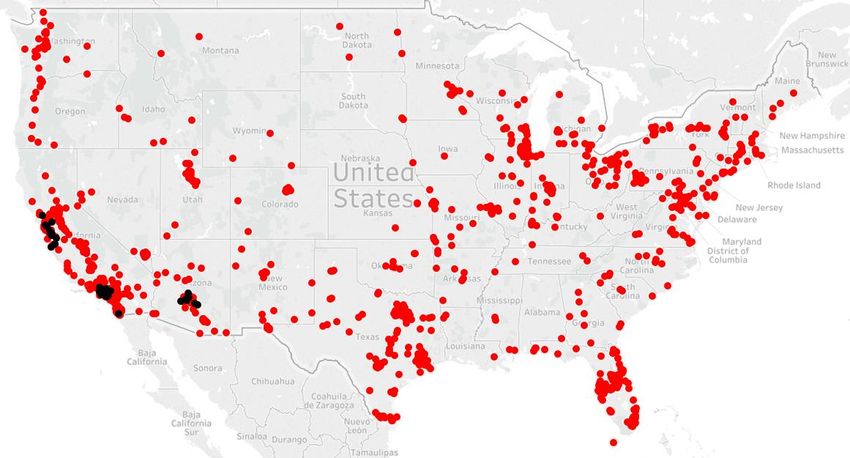
VALUE

              Utilizing Our Well-Known, Traffic-Driving Value Platforms to Provide an Array of Value
                                                 for All Customers

                       PRICE                                                           BUNDLED
               $2$4$6$8 Value                                                        Introduced 6 new
              menu affinity held                                                     family packs and
                 strong at 14%                                                         nearly tripled
             incidence1 even with                                                  Thanksgiving Turkey
              the introduction of                                                  & Dressing meal pack
                new platforms                                        Everyday         incidence vs PY
                                                                       Value
                 ABUNDANT                                              21%1        CONVENIENCE

                 Sold nearly                                                          Over 500,000
                 11,000,000                                                            transactions1
               Super Slams1, a                                                       through our free
              30% increase from                                                    delivery promotions
                     PY

1.   Preliminary data for the Fiscal Year Ended December 30, 2020.

                                                                                                          8
COMFORT

       Ensuring Denny’s is a Place Where Our Modern American Family Guests Receive
                  Feel-Good Comfort Food and are Welcomed and Valued

        Food                              Service                      Atmosphere

                              Reinforced the “Rules We Live By”
Introduced a new line of                                               Providing comfort
     melts and bowls                                                 indoors and outdoors

                                                                                            9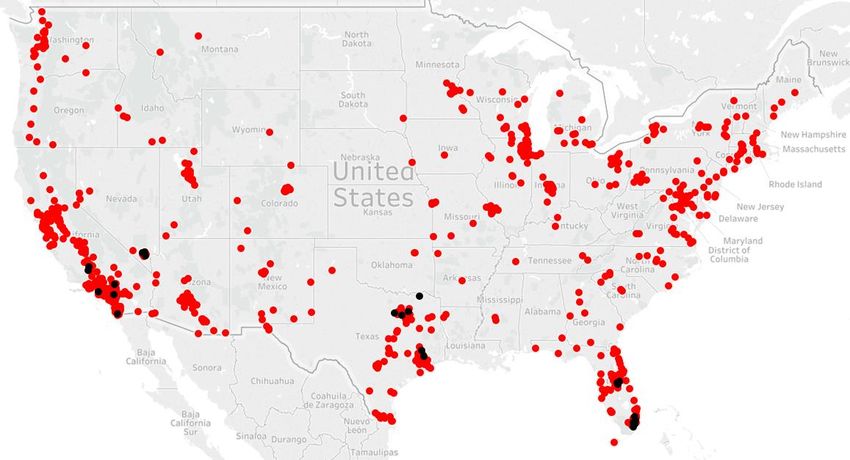
CONVENIENCE

Bringing Denny’s to Our Guests Wherever They Want, Whenever They Want, and Doing
 So With Integrated and Seamless Systems to Facilitate an Excellent Guest Experience

                                                                                       10
DENNY’S ON DEMAND®
Average Weekly Off-Premise Sales Have More Than Doubled 1st
From Pre-Pandemic Levels To Fiscal December 2020
Family Dining Chain to
Launch Mobile & Online
Average Domestic Restaurant Sales by Channel per Week Family Dining Chain
Ordering to
Nationally
Launch Mobile & Online
Ordering Nationally
Off-Premise Sales On-Premise Sales Total Sales >90%
$40.0
Domestic Restaurants Active
$35.0 $32.9 Delivery2
Domesticwith
$32.3
Restaurants
$30.0 $26.9 Active with Delivery2
$25.0 $23.6
$24.9 $24.6 ~60%
$21.2 $22.2 $21.8
$20.3
$20.0 Online Transactions from 18-
$28.9 $28.3
$22.2 $15.8 $17.6 $17.3 44 Year Old Guests3
$15.0 $12.2 $13.3 $13.9 $12.8
$12.6
$8.5 $2.6
$10.0
~62%
$5.0 $8.3 $9.6
$7.7 $7.9 $8.3 $7.8 $9.0 Incidence Rate of
$7.3 $7.3 Incidence Rate of Breakfast
$4.0 $4.0 $4.7 Breakfast Plates for Off-
$0.0 Plates for Off-Premise
Premise Orders3 3
Jan Feb Mar Apr May Jun Jul Aug Sep Oct Nov Dec 1 Orders
1. Preliminary data for the Fiscal Month Ended December 30, 2020.
2. Preliminary data as of December 30, 2020, the end of Fiscal Fourth Quarter 2020.
3. Preliminary data for the Fiscal Fourth Quarter Ended December 30, 2020.
11SALES TRENDS AND REOPENINGS
Domestic Same-Store Sales1
Open Dining Rooms Closed Dining Rooms Domestic System-Wide Same-Store Sales
(10%)
(24%) (24%) (23%)
(20%) (26%)
(29%)
(33%)
(30%) (36%) (26%)
(28%) (27%)
(40%) (47%) (35%) (33%)
(41%) (39%) (39%) (41%)
(50%) (42%)
(47%)
(60%) (65%) (55%)
(74%) (61%)
(70%)
(76%) (69%) (68%)
(80%) (76%)
Apr May Jun Jul Aug Sep Oct Nov Dec 2
Average Domestic Dining Rooms
Open Dining Rooms Closed Dining Rooms Temporary Closures
1,800
1,600 47 35 22 19 20 31
1,400 120
378 237 207 256
480 327 444 369
1,200 586
1,000
800
938 1,244 1,289
600 1,127 1,239
1,060 1,087 1,044
400 891
200
2 222
0
Apr May Jun Jul Aug Sep Oct Nov Dec 2
1. Same-store sales include sales at company restaurants and non-consolidated franchised and licensed restaurants that were open the same period in the prior year. Total operating revenue is
limited to company restaurant sales and royalties, advertising revenue, fees and occupancy revenue from non-consolidated franchised and licensed restaurants. Accordingly, domestic franchise
same-store sales and domestic system-wide same-store sales should be considered as a supplement to, not a substitute for, the Company’s results as reported under GAAP.
2. Preliminary data for the Fiscal Month Ended December 30, 2020.
12CAPACITY RESTRICTIONS
As of December 30, 2020, Near ly 60% of Our Domestic Restaur ants
Have Open Dining Rooms 1
Capacity Restrictions
Alaska
75% Capacity or Social Distancing 435 29%
50%-66% Capacity 346 23%
25%-33% Capacity 78 5%
Off-Premise Only 587 39%
No Restrictions 15 1%
Temporarily Closed 43 3%
1. Preliminary data as of December 30, 2020, the end of Fiscal Fourth Quarter 2020. Total 1,504 100%
13DOMESTIC FOOTPRINT
Total of 1,504 Restaur ant s in the U.S. 1 with Strongest Pr esence in
California, Arizona, Texas, and Florida
TOP 10 U.S. MARKETS1
DMA UNITS
Los Angeles 175
6
Phoenix 64
4
9 Houston 63
7
Dallas/Ft. Worth 52
25 Sacramento/Stockton 48
2
San Francisco/Oakland 40
Orlando/Daytona 40
San Diego 38
Chicago 35
Miami/Ft. Lauderdale 35
5
% of Domestic System 39%
1. Preliminary data as of December 30, 2020, the end of Fiscal Fourth Quarter 2020.
14INTERNATIONAL FOOTPRINT
International Presence of 146 Restaurants in 13 Countries and U.S. Territories has
Grown by ~68% Since Year End 20101
FOOTPRINT
COUNTRY UNITS
United States 1,504
Canada 78
Puerto Rico 15
Mexico 12
Philippines 10
Honduras Guatemala City New Zealand 7
Honduras 6
United Arab Emirates 6
Costa Rica 3
El Salvador 2
Guam 2
Guatemala 2
Ontario Philippines Indonesia 2
United Kingdom 1
1. Preliminary data as of December 30, 2020, the end of Fiscal Fourth Quarter 2020. TOTAL 1,650
15STRONG PARTNERSHIP WITH FRANCHISEES
Well Diversified, Experienced, and Ener getic Group of 227 Fr anchisees 1
Ownership of 1,585 Franchisee Restaurants 1
• 36 franchisees with more than 10 Number of Franchisees Total Franchised
Number of
restaurants each collectively compromise Franchised
Franchisees
as % of Franchised Units as %
approximately 65% of the franchise Units Total Units of Total
system. 1 79 35% 79 5%
2–5 81 36% 232 15%
• Strong support and energy at the 2019
Annual Denny’s Franchisee Association 6–10 31 14% 245 15%
Convention for returns on quality
11–15 14 6% 169 11%
investments in food, service, and
atmosphere. 16–30 10 4% 211 13%
>30 12 5% 649 41%
Total 227 100% 1,585 100%
1. Preliminary data as of December 30, 2020, the end of Fiscal Fourth Quarter 2020.
16COVID-19 BUSINESS RESPONSE
• Provided over $15M of royalty, advertising and rent relief, including approximately $7M
of abatements
Franchisee • Deferred remodels and new store development commitments
• Secured relief from key vendors and primary third-party franchise lenders
Suppor t • Approximately 99% of domestic franchise restaurants received funding under the first
round of the Paycheck Protection Program with enhanced benefits expected in round two
• Eliminated non-essential spending and placed holds on corporate and field open positions
Cost Savings •
•
Significantly reduced restaurant level staffing across the company portfolio
Reduced compensation for Board of Directors and multiple levels of management
Initiatives • Corporate furloughs and reduction in workforce
• Recognized approximately $1.3M in tax credits related to the CARES Act1
• Raised net proceeds of $69.6M through the issuance and sale of 8.0M shares of common
stock
Capital • Secured amendments to credit facility2, temporarily waiving financial covenants with certain
restrictions, followed by more favorable financial covenant levels through Q3 ‘21
Allocation • Suspended share repurchases in February 2020 and are precluded from repurchasing
shares through receipt of the Q3 ’21 compliance certificate
1. Data as of September 23, 2020, the end of Fiscal Third Quarter 2020.
2. Secured Second Amendment to the credit facility on May 13, 2020 and a Third Amendment to the credit facility on December 15, 2020. For further details, see our Current Reports on
Form 8-K filed with the SEC.
17A RESILIENT AND DURABLE
BRAND FOCUSED ON THE
FUTURE
18EXECUTION OF BRAND REVITALIZATION STRATEGY
DRIVING RESULTS
“Become the
Deliver a Consistently Grow Drive World’s Largest,
Differentiated Operate the Global Profitable Most Admired
and Relevant Great Franchise Growth for All
Brand Restaurants Stakeholders and
Beloved Family
of Local
Restaurants”
Enabled Through Close Collaboration with
Technology and Training + Franchise Partners
19DELIVERING A DIFFERENTIATED AND RELEVANT BRAND &
CONSISTENTLY OPERATE GREAT RESTAURANTS
Menu Optimization Delight & Make it Right
Product Innovation The Rules We Live By
Everyday Value Pride Review Program
Everyday Occasion
Unpretentious
Warm & Inviting
20FOCUS ON A MENU WITH QUALITY ITEMS AT OPTIMAL
PRICES THAT DRIVE PROFIT TO THE BOTTOM LINE
Approximately 80% of Core Menu Entrées Changed or Improved Since Our Revitalization Began
Current Core Menu is Approximately 25% Smaller than Our Pre-Pandemic Menu
21FOCUS ON CONSISTENTLY OPERATING GREAT
RESTAURANTS LEADING TO SUSTAINED IMPROVEMENT
• Investments in training talent, tools,
and strategies, such as Ignite E-Learning
and our latest Delight & Make It Right
service programs, driving improvements in
service scores
• Denny’s Pride Review Program used to
evaluate and share best practices
• Close collaboration with franchisees to drive
improvements in speed of service and margins
22Heritage 2.0
Heritage
Legacy Denny’s REMODELS KEY TO REVITALIZING LEGACY BRAND
23WELL-ESTABLISHED PIPELINE WITH OPPORTUNITIES
Market Share Opportunities Through Potential Industry Rationalization Will Only
Bolster the 78 Commitments Secured from Our Recent Refranchising Initiative
2019 U.S. Full-Service Restaurant
• Secured 78 domestic development Industry
IndustrySales 1 1
($B)
Sales
commitments through the sale of 113
company owned restaurants during 2018
and 2019
• Considerable experience converting existing
spaces into new Denny’s restaurants
29%
• With 71% of the full-service segment sales 71%
maintained by small chains and
independents, as potential industry
rationalization occurs, market share
opportunities will emerge
Small Chains & Independents Top 500 Chains
1. Technomic Top 500 Chain Restaurant Report 2020
24VIRTUAL BRANDS PROVIDE ADDITIONAL MARKET SHARE
OPPORTUNITIES
Over ½ of Domestic
Locations Signed Up
With Rolling Launch
Starting in February
2021
Array of Denny’s
Favorites Along With
New Signature
Creations!
25VIRTUAL BRANDS PROVIDE ADDITIONAL MARKET SHARE
OPPORTUNITIES
• Door Dash Exclusive Test
• 23 Test Locations
• Over ½ of Domestic
Locations Will Go Live
in Spring 2021
26STRONG COLLABORATION WITH FRANCHISEES
Denny’s Franchisee Marketing Brand Advisory Operations Brand Advisory
Association Council Council
Annual Convention Menu Innovation Training Initiatives
Steering Committee Meetings Media Support Pride Reviews
Joint Board Meetings Product Testing Operations Support
Supply Chain Oversight Development Brand Technology Brand Advisory
Committee Advisory Council Council
Purchase Product for System Successful Heritage Remodels Customer Facing Technology
Outperformed PPI by Avg of ~1ppt Prototype Development Denny’s On Demand
Each Year Over the Last Decade Lease & Asset Management Common POS Platform
27HISTORICAL PERFORMANCE 28
TOTAL SYSTEM SALES1 AND ADJUSTED EBITDA* GROWTH

                                 Total System Sales1 Have Grown by Over $550 Million Since 2011

                           Total System Sales1                                                                                    Adjusted EBITDA*
      $3.00                                                                                     $110.0
                                                                                 $2.93                                                                          $105.3
                                                                         $2.89                  $105.0                                                     $103.3
      $2.90                                                  $2.85                                                                                    $100.2
                                                        $2.79                                   $100.0
      $2.80                                                                                                                                                           $96.8
                                               $2.73
                                                                                                  $95.0
      $2.70
                                       $2.64                                                                                                  $88.8

                                                                                            $Ms
$Bs

                                                                                                  $90.0
      $2.60
                              $2.51                                                               $85.0                               $83.1
                      $2.48                                                                                 $81.7
      $2.50                                                                                                         $78.6 $78.0
                                                                                                  $80.0
      $2.40 $2.36
                                                                                                  $75.0
      $2.30                                                                                       $70.0

      $2.20                                                                                       $65.0
              2011 2012 2013 2014 2015 2016 2017 2018 2019                                                  2011 2012 2013 2014 2015 2016 2017 2018 2019
 1. Total system sales is a non-GAAP measure representing the sum of sales generated at all        * See Appendix for reconciliation of Net Income (Loss) to Adjusted EBITDA, Adjusted Net
    Denny’s locations worldwide, including franchise and licensed restaurants which are non-         Income (Loss), Adjusted Net Income (Loss) Per Share (also called Adjusted Earnings per
    consolidated entities. Total operating revenue is limited to company restaurant sales and        Share), and Adjusted Free Cash Flow.
    royalties, advertising revenue, fees and occupancy revenue from non-consolidated
    franchised and licensed restaurants. Accordingly, total system sales should be considered
    as a supplement to, not a substitute for, our results as reported under GAAP.

                                                                                                                                                                                          29
FRANCHISED AND COMPANY RESTAURANT SALES
History of Steady Growth in Franchised and Company Average Unit Volumes
Refranchising Strategy Benefited AUVs at Both Franchised and Company Restaurants in 2019
Franchised Restaurant AUVs Company Restaurant AUVs
$3.0
$3.0
$2.8
$2.8
$2.6
$2.6 $2.5
$2.4
$2.4 $2.2 $2.3 $2.3 $2.3
$2.2 $2.2 $2.1
$2.0 $1.9 $2.0
$2.0 $1.8
$1.8
$Ms
$Ms
$1.6 $1.6 $1.7 $1.8
$1.6 $1.4 $1.5 $1.6 $1.6
$1.4 $1.4 $1.6
$1.4 $1.4
$1.2 $1.2
$1.0 $1.0
$0.8 $0.8
$0.6 $0.6
$0.4 $0.4
$0.2 $0.2
$0.0 $0.0
2011 2012 2013 2014 2015 2016 2017 2018 2019 2011 2012 2013 2014 2015 2016 2017 2018 2019
30FRANCHISE AND COMPANY MARGINS
Total Operating Margin1 Grew Over 19% From 2011 Through 2019
Highly Franchised Business Has Historically Provided Stable Operating Margins 1
Franchise and Company Restaurant
Operating Margins1
$175.0 $164.0 $165.1 $167.2 $162.7
$153.6
$155.0 $139.5 $138.8
$136.4 $133.0
$135.0
$115.0 $98.8 $99.5 $104.0
$Ms
$94.9 $114.7
$95.0 $82.6 $88.0 $92.9
$88.2
$75.0
$55.0 $65.2 $65.6 $63.2
$53.8 $58.7
$51.5 $44.8 $45.9 $48.0
$35.0
2011 2012 2013 2014 2015 2016 2017 2018 2019
Company Restaurant Operating Margin Franchise Operating Margin Total Operating Margin
1. The Company believes that, in addition to GAAP measures, certain other non-GAAP financial measures are appropriate indicators to assist in the evaluation of restaurant-level operating
efficiency and performance of ongoing restaurant-level operations. Total Operating Margin is the total of Company Restaurant Operating Margin and Franchise Operating Margin. We
define Company Restaurant Operating Margin as company restaurant sales less costs of company restaurant sales (which include product costs, company restaurant level payroll and benefits,
occupancy costs, and other operating costs including utilities, repairs and maintenance, marketing and other expenses) and present it as a percent of company restaurant sales. We define
Franchise Operating Margin as franchise and license revenue (which includes franchise royalties and other non-food and beverage revenue streams such as initial franchise fees, advertising
revenue and occupancy revenue) less costs of franchise and license revenue and present it as a percent of franchise and license revenue.
31DOMESTIC SYSTEM-WIDE SAME-STORE SALES1
Nine Consecutive Fiscal Years of Positive Domestic System-Wide Same-Store Sales1 Growth From
2011 Through 2019
5.8%
6.0%
4.0% 2.8%
2.0%
2.0% 1.3% 0.9% 1.1%
0.7% 0.5% 0.8%
0.0%
(2.0%)
(20.0%)
(4.0%)
(22.0%)
(6.0%)
(24.0%) (31.4%)
(8.0%)
(26.0%)
(10.0%)
(28.0%)
(12.0%)
(30.0%)
(14.0%)
2
2011 2012 2013 2014 2015 2016 2017 2018 2019 2020
1. Same-store sales include sales at company restaurants and non-consolidated franchised and licensed restaurants that were open the same period in the prior year. Total
operating revenue is limited to company restaurant sales and royalties, advertising revenue, fees and occupancy revenue from non-consolidated franchised and licensed
restaurants. Accordingly, domestic franchise same-store sales and domestic system-wide same-store sales should be considered as a supplement to, not a substitute for, our results
as reported under GAAP.
2. Preliminary data for the Fiscal Year Ended December 30, 2020.
32GLOBAL DEVELOPMENT
Growth Initiatives Enabled Approximately 400 New Restaurant Openings Since 2011 With 95%
Opened by Franchisees1
70 System Openings
61
60 5
50
50 46 45
40 5 14 39
38 8
40
6 7
6 30 30
30
56
9 20
14
20 41
34 37 36
32 32 8
10 21
16
12
0
2011 2012 2013 2014 2015 2016 2017 2018 2019 2020
Domestic Openings International Openings System Openings
1. Preliminary data as of December 30, 2020, the end of Fiscal Fourth Quarter 2020.
33ADJUSTED NET INCOME PER SHARE*
Growth in Adjusted Net Income Per Share* Between 2011 and 2019 Driven by Successful
Revitalization Initiatives and Share Repurchase Program
$0.80 $0.77 $60.0
$0.68
$0.70
$50.0
$0.58
$0.60 $0.55
Adjusted Net Income*
Adjusted Net Income
$0.43 $40.0
$0.50
($ Millions)
per Share*
$0.37
$0.40 $0.31 $30.0
$0.26
$0.30 $47.9
$0.20 $42.3 $44.6
$40.7 $20.0
$36.7
$0.20 $32.9
$29.3
$25.2
$19.5 $10.0
$0.10
$0.00 $0.0
2011 2012 2013 2014 2015 2016 2017 2018 2019
Adjusted Net Income* Adjusted Net Income Per Share*
* See Appendix for reconciliation of Net Income (Loss) to Adjusted EBITDA, Adjusted Net Income (Loss), Adjusted Net Income (Loss) Per Share (also called
Adjusted Earnings per Share), and Adjusted Free Cash Flow.
34ADJUSTED FREE CASH FLOW*
Nearly $417 Million in Adjusted Free Cash Flow* Generated Over Last 9 Fiscal Years
Adjusted Free Cash Flow* Impacted by ~$11 Million of Real Estate Acquisitions in 2019
$120
$103 $105
$100
$97
$100
$89
$82 $83 $31 $32
$79 $78 $34 $25
$80
$ Millions
$16 $16 $22 $33 $3
$21 $6
$1 $3
$60 $2 $4 $20 $24
$17 $3 $11 $15
$12 $8 $5
$9
$8 $52 $51
$40 $48 $49 $49 $50
$45 $18
$42
$20 Cash capital expenditures include real $30
estate acquisitions through like-kind
exchange transactions ~$11
$0
2011 2012 2013 2014 2015 2016 2017 2018 2019
Real Estate Acquisitions Cash Interest Cash Taxes Cash Capital Adjusted EBITDA* Adjusted Free Cash Flow*
* See Appendix for reconciliation of Net Income (Loss) to Adjusted EBITDA, Adjusted Net Income (Loss), Adjusted Net Income (Loss) Per Share (also called Adjusted Earnings per Share), and
Adjusted Free Cash Flow.
35SOLID BALANCE SHEET WITH FLEXIBILITY
Disciplined Focus on Debt Leverage with Total Available Liquidity of Approximately $82 Million 1
After Considering Liquidity Covenants
Paid down revolver $20.0M
$600.0 during Q4 ’20 resulting in 4.00
an outstanding balance of
$210.0M1 3.50
Total Debt / Adjusted EBITDA*
$500.0
Total Debt ($ Millions)
3.00
$400.0 Waived 2.50
$30.6 for 2020
$300.0 $30.2 2.00
$23.1 $16.5 $15.8
$27.1
$22.5 $20.7 1.50
$200.0 $20.1 $20.1 $18.8
1.00
$240.2 $259.0 $286.5 $240.0 $230.0
$100.0 $198.1 $170.0 $195.0 $218.5
$153.0 $140.0 0.50
$0.0 0.00
2
2010 2011 2012 2013 2014 2015 2016 2017 2018 2019 2020
3
Finance Leases Credit Facility Total Debt / Adjusted EBITDA*
1. Preliminary data as of December 30, 2020, the end of Fiscal Fourth Quarter 2020.
2. Data as of September 23, 2020, the end of Fiscal Third Quarter 2020. Total Debt / Adjusted EBITDA* leverage ratio is waived starting in Q2 ’20 through Q1’ 21.
3. On December 15, 2020, we entered into a third amendment to our credit agreement which reduced the revolver commitment to $375M with an additional stepdown to $350M
on the first day of Q3 ’21. The amendment also temporarily waives certain financial covenants through Q1 ’21; provides favorable covenant measurements and restricts capital
expenditures through Q3 ’21; prohibits the Company from paying dividends and making stock repurchases and other general investments, and adds a $70M monthly minimum
liquidity covenant, defined as the sum of unrestricted cash and revolver availability, through receipt of the Q3 ’21 compliance certificate; and increases the interest rate to
LIBOR plus 3.00% through receipt of the Q4 ’21 compliance certificate.
* See Appendix for reconciliation of Net Income (Loss) to Adjusted EBITDA, Adjusted Net Income (Loss), Adjusted Net Income (Loss) Per Share (also called Adjusted Earnings per
Share), and Adjusted Free Cash Flow. 36HISTORY OF CONSISTENTLY RETURNING EXCESS
CAPITAL TO SHAREHOLDERS
Approximately $554 Million Allocated Towards Share Repurchases Since We Started to Return
Excess Capital to Shareholders in late 20101
SHARE REPURCHASES ($ Millions)
• Allocated $34.2 million toward share
repurchases during 2020 before suspending
ASR Total Share Repurchases
share repurchases as of February 27, 2020
$105.8
• Paid an average of $10.26 per share to $96.2
repurchase approximately 54 million shares Average
Price of $82.9
resulting in a 44% net reduction in our share
count since late 2010 $10.26
$68.0
$58.7
• We entered into amendments to our credit
agreement on May 13, 2020 and
December 15, 2020, which, among other $36.0 $34.2
things, temporarily prohibit us from paying $21.6 $22.2
$24.7
$50
dividends and making stock repurchases
$3.9 $25 $25
Q4 2011 2012 2013 2014 2015 2016 2017 2018 2019 2020
2010
1. Data as of February 27, 2020 (date the Company suspended share repurchases).
37STOCK PRICE PERFORMANCE
Between 2010 and January 8, 2021, Denny’s Stock Price Rose 307% Compared to the S&P Small
Cap 600 Restaurants Index of 371% and S&P Small Cap 600 Index of 186%
Announcement
COVID-19
Pandemic
Refranchising
600%
DENN Up 307%
500% S&P Small Cap 600 Restaurants Index Up 371%
S&P Small Cap 600 Index Up 186%
400%
300%
2011 The
200% Beginning of
Denny’s Brand
Revitalization
100%
0%
Dec-10
Dec-11
Dec-12
Dec-13
Dec-14
Dec-15
Dec-16
Dec-17
Dec-18
Dec-19
Dec-20
Mar-11
Mar-12
Mar-13
Mar-14
Mar-15
Mar-16
Mar-17
Mar-18
Mar-19
Mar-20
Sep-11
Sep-12
Sep-13
Sep-14
Sep-15
Sep-16
Sep-17
Sep-18
Sep-19
Sep-20
Jun-11
Jun-12
Jun-13
Jun-14
Jun-15
Jun-16
Jun-17
Jun-18
Jun-19
Jun-20
(100%)
38DENNY’S INVESTMENT HIGHLIGHTS
• Consistent same-store sales1 growth through brand revitalization
strategies to enhance food, service, and atmosphere
• Global footprint with seasoned franchisees supported by a strong
domestic presence and pipeline of development commitments
• Strong Adjusted Free Cash Flow* and shareholder return supported
by solid balance sheet with flexibility to support brand investments and a focus
on highly accretive and shareholder friendly allocations of Adjusted Free Cash
Flow*
• Durable business focused on the future with a lower risk, highly-
franchised business model supported by proven revitalization strategies, a
sustained record of consistent financial performance and well-fortified balance
sheet
1. Same-store sales include sales at company restaurants and non-consolidated franchised and licensed restaurants that were open the same period in the prior year. Total operating revenue is limited to
company restaurant sales and royalties, advertising revenue, fees and occupancy revenue from non-consolidated franchised and licensed restaurants. Accordingly, domestic franchise same-store sales
and domestic system-wide same-store sales should be considered as a supplement to, not a substitute for, our results as reported under GAAP.
*See Appendix for reconciliation of Net Income (Loss) to Adjusted EBITDA, Adjusted Net Income (Loss), Adjusted Net Income (Loss) Per Share (also called Adjusted Earnings per Share), and Adjusted Free
Cash Flow.
39APPENDIX 40
EXPERIENCED AND COMMITTED LEADERSHIP TEAM
John C. Miller, Chief Executive Officer joined Denny’s in 2011 with over 30 years experience in restaurant operations and management.
Prior to joining Denny’s, served as President of Taco Bueno and spent 17 years with Brinker International where positions held included
President of Romano’s Macaroni Grill and President of Brinker’s Mexican Concepts.

         F. Mark Wolfinger, President joined Denny’s in 2005 as Chief Financial Officer. Previous roles include Chief Financial Officer of Danka Business
         Systems and senior financial positions with Hollywood Entertainment, Metromedia Restaurant Group (operators of Bennigans, Ponderosa
         Steakhouse, and Steak & Ale), and the Grand Metropolitan.

Christopher D. Bode, Senior Vice President, Chief Operating Officer. Prior to joining Denny’s in 2011, served as Chief Operating Officer of
QSR Management, LLC (a franchisee of Dunkin’ Donuts) and Vice President of Development & Construction of Dunkin’ Brands, Inc. Before joining
the restaurant industry, served as a United States Navy Communications Specialist.

         John W. Dillon, Executive Vice President, Chief Brand Officer. Prior to joining Denny’s in 2007, held multiple marketing leadership positions with
         various organizations, including 10 years with YUM! Brands/Pizza Hut, and was Vice President of Marketing for the National Basketball
         Association’s Houston Rockets.

Stephen C. Dunn, Senior Vice President, Chief Global Development Officer. Prior to joining Denny’s in 2004, held executive-level positions with
Church's Chicken, El Pollo Loco, Mr. Gatti's, and TCBY. Earned the distinction of Certified Franchise Executive by the International Franchise
Association Educational Foundation. Served as an Infantry Officer in the United States Army.

          Michael L. Furlow, Senior Vice President, Chief Information Officer. Prior to joining Denny’s in 2017, served as Chief Information Officer and
          Senior Vice President of IT at Red Robin Gourmet Burgers and CEC Entertainment, Inc. (an operator and franchisor of Chuck E. Cheese’s and
          Peter Piper Pizza).

Gail S. Myers, Senior Vice President, General Counsel. Prior to joining Denny’s in 2020, served as Executive Vice President, General Counsel,
Secretary and Chief Compliance Officer for American Tire Distributors, Inc., Senior Vice President, Deputy General Counsel and Chief
Compliance Counsel at U.S. Foods and Senior Vice President, General Counsel and Secretary at Snyder's-Lance, Inc.

         Robert P. Verostek, Senior Vice President, Chief Financial Officer. Joined Denny’s in 1999 and served in numerous leadership positions across
         the Finance and Accounting teams. Named Vice President of Financial Planning and Analysis in 2012 and Chief Financial Officer is 2020. Prior
         experience includes various accounting roles for Insignia Financial Group.

                                                                                                                                                              41
RECONCILIATION OF NET INCOME (LOSS) TO
$ Millions (except per share amounts)
NON-GAAP FINANCIAL MEASURES 2011 2012 2013 20141 2015 2016 2017 2018 2019
2020 Q3
YTD 1,2
Net Income (Loss) $112.3 $22.3 $24.6 $32.7 $36.0 $19.4 $39.6 $43.7 $117.4 ($7.5)
Provision for (Benefit from) Income Taxes3 (84.0) 12.8 11.5 16.0 17.8 16.5 17.2 8.6 31.8 (1.9)
Operating (Gains) Losses and Other Charges, Net 2.1 0.5 7.1 1.3 2.4 26.9 4.3 2.6 (91.2) 2.3
Other Nonoperating Expense (Income), Net 2.6 7.9 1.1 (0.6) 0.1 (1.1) (1.7) 0.6 (2.8) 3.9
Share‐Based Compensation 4.2 3.5 4.9 5.8 6.6 7.6 8.5 6.0 6.7 2.0
Deferred Compensation Plan Valuation Adjustments4 (0.1) 0.7 1.1 0.5 0.0 0.9 1.6 (1.0) 2.6 0.0
Interest Expense, Net 20.0 13.4 10.3 9.2 9.3 12.2 15.6 20.7 18.5 13.3
Depreciation and Amortization 28.0 22.3 21.5 21.2 21.5 22.2 23.7 27.0 19.8 12.3
Cash Payments for Restructuring Charges & Exit Costs (2.7) (3.8) (2.8) (2.0) (1.5) (1.8) (1.7) (1.1) (2.6) (2.4)
Cash Payments for Share‐Based Compensation (0.8) (1.0) (1.2) (1.1) (3.4) (2.5) (3.9) (1.9) (3.6) (3.2)
Adjusted EBITDA4 $81.7 $78.6 $78.0 $83.1 $88.8 $100.2 $103.3 $105.3 $96.8 $18.7
Adjusted EBITDA Margin % 15.2% 16.1% 16.9% 17.6% 18.1% 19.8% 19.5% 16.7% 17.9% 9.0%
Cash Interest Expense, Net7 (17.0) (11.6) (9.1) (8.1) (8.3) (11.2) (14.6) (19.6) (17.6) (13.1)
Cash Paid for Income Taxes, Net (1.1) (2.0) (2.8) (3.8) (5.4) (3.0) (6.4) (3.3) (24.1) (0.5)
Cash Paid for Capital Expenditures (16.1) (15.6) (20.8) (22.1) (32.8) (34.0) (31.2) (32.4) (25.3) (5.5)
Adjusted Free Cash Flow4 $47.5 $49.4 $45.3 $49.1 $42.3 $51.9 $51.2 $50.0 $29.8 ($0.5)
Net Income (Loss) $112.3 $22.3 $24.6 $32.7 $36.0 $19.4 $39.6 $43.7 $117.4 ($7.5)
Pension Settlement Loss 0.0 0.0 0.0 0.0 0.0 24.3 0.0 0.0 0.0 0.0
(Gains) Losses on Interest Rate Swap Derivatives 0.0 0.0 0.0 0.0 0.0 0.0 0.0 0.0 0.0 4.2
(Gains) Losses on Sales of Assets and Other, Net (3.2) (7.1) (0.1) (0.1) (0.1) 0.0 3.5 (0.5) (93.6) (2.3)
Impairment Charges 4.1 3.7 5.7 0.4 0.9 1.1 0.3 1.6 0.0 2.5
Early Extinguishment of Debt 1.4 7.9 1.2 0.0 0.3 0.0 0.0 0.0 0.0 0.0
Tax Reform 0.0 0.0 0.0 0.0 0.0 0.0 (1.6) 0.0 0.0 0.0
Tax Effect5 (0.8) (1.6) (2.2) (0.1) (0.4) (2.5) (1.2) (0.2) 24.1 (1.1)
Adjusted Provision for Income Taxes6 (94.3) 0.0 0.0 0.0 0.0 0.0 0.0 0.0 0.0 0.0
Adjusted Net Income (Loss) $19.5 $25.2 $29.3 $32.9 $36.7 $42.3 $40.7 $44.6 $47.9 ($4.2)
Diluted Net Income (Loss) Per Share $1.15 $0.23 $0.26 $0.37 $0.42 $0.25 $0.56 $0.67 $1.90 ($0.13)
Adjustments Per Share ($0.95) $0.03 $0.05 $0.00 $0.01 $0.30 $0.02 $0.01 ($1.13) $0.06
Adjusted Net Income (Loss) Per Share $0.20 $0.26 $0.31 $0.37 $0.43 $0.55 $0.58 $0.68 $0.77 ($0.07)
Diluted Weighted Average Shares Outstanding (000’s) 99,588 96,754 92,903 88,355 84,729 77,206 70,403 65,562 61,833 59,350
1. Full year includes 53 operating weeks.
2. Data for the three fiscal quarters ended September 23, 2020.
3. In 2011, we recorded an $89 million net deferred tax benefit from the release of a substantial portion of the valuation allowance on certain deferred tax assets. This release was primarily based on our improved historical and projected pre-tax income.
4. Beginning in 2018, historical presentations of Adjusted EBITDA and Adjusted Free Cash Flow have been restated to exclude the impact of market valuation changes in the Company’s non-qualified deferred compensation plan liabilities.
5. Tax adjustments for full year 2013, 2014, 2015, 2017 and 2018 use full year effective tax rates of 31.9%, 32.9%, 33.0%, 30.3% and 16.4%, respectively. Tax adjustments for full year 2011 and 2012 are calculated using the full year 2012 effective rate of
36.4%. The tax adjustment for the loss on pension termination in 2016 is calculated using an effective tax rate of 8.8%., with all remaining adjustments calculated using an effective tax rate of 30.9%. Tax adjustments for the gains on sales of assets and other, net in
2019 are calculated using an effective rate of 25.7%. For the three quarters ended September 23, 2020, the tax adjustments are calculated using an effective tax rate of 25.7%.
6. The Adjusted provision for income taxes based on effective income tax rate of 36.4% for full year ended Dec. 27, 2012 and excludes impact of net deferred tax benefit.
7. Includes cash interest expense, net and cash payments of approximately $1.1 million for dedesignated interest rate swap derivatives for year-to-date period ended September 23, 2020.
42RECONCILIATION OF OPERATING INCOME TO
NON-GAAP FINANCIAL MEASURES
The Company believes that, in addition to GAAP measures, certain other non-GAAP financial measures are appropriate indicators to assist in the evaluation of restaurant-level operating efficiency and
performance of ongoing restaurant-level operations. The Company uses Total Operating Margin, Company Restaurant Operating Margin and Franchise Operating Margin internally as performance measures
for planning purposes, including the preparation of annual operating budgets, and these three non-GAAP measures are used to evaluate operating effectiveness.
The Company defines Total Operating Margin as operating income (loss) excluding the following three items: general and administrative expenses, depreciation and amortization, and operating (gains), losses
and other charges, net. Total Operating Margin is presented as a percent of total operating revenue. The Company excludes general and administrative expenses, which include primarily non-restaurant-level
costs associated with support of company and franchised restaurants and other activities at their corporate office. The Company excludes depreciation and amortization expense, substantially all of which is
related to company restaurant-level assets, because such expenses represent historical sunk costs which do not reflect current cash outlays for the restaurants. The Company excludes special items, included within
operating (gains), losses and other charges, net, to provide investors with a clearer perspective of its ongoing operating performance and a more relevant comparison to prior period results.
Total Operating Margin is the total of Company Restaurant Operating Margin and Franchise Operating Margin. The Company defines Company Restaurant Operating Margin as company restaurant sales less
costs of company restaurant sales (which include product costs, company restaurant level payroll and benefits, occupancy costs, and other operating costs including utilities, repairs and maintenance, marketing
and other expenses) and present it as a percent of company restaurant sales. The Company defines Franchise Operating Margin as franchise and license revenue (which includes franchise royalties and other
non-food and beverage revenue streams such as initial franchise fees, advertising revenue and occupancy revenue) less costs of franchise and license revenue and present it as a percent of franchise and license
revenue.
These non-GAAP financial measures provide a meaningful comparison between periods and enable investors to focus on the performance of restaurant-level operations by excluding revenues and costs
unrelated to food and beverage sales in addition to corporate general and administrative expense, depreciation and amortization, and operating (gains), losses and other charges, net. However, each of these
non-GAAP financial measures should be considered as a supplement to, not a substitute for, operating income, net income (loss) or other financial performance measures prepared in accordance with U.S.
generally accepted accounting principles. Total Operating Margin, Company Restaurant Operating Margin and Franchise Operating Margin do not accrue directly to the benefit of shareholders because of the
aforementioned excluded items, and are not indicative of the overall results for the Company.
2020 Q3
2011 2012 2013 20141 2015 2016 2017 2018 2019
$ Millions YTD 1,2
Operating Income $51.0 $56.4 $47.5 $57.3 $63.2 $47.0 $70.7 $73.6 $165.0 $7.8
General and Administrative Expenses 55.4 60.3 56.8 58.9 66.6 68.0 66.4 63.8 69.0 34.6
Depreciation and Amortization 28.0 22.3 21.5 21.2 21.5 22.2 23.7 27.0 19.8 12.3
Operating (Gains) Losses and Other Charges, Net 2.1 0.5 7.1 1.3 2.4 26.9 4.3 2.6 (91.2) 2.3
Total Operating Margin $136.4 $139.5 $132.9 $138.7 $153.6 $164.0 $165.2 $167.1 $162.7 $56.9
Total Operating Margin Consists Of:
Company Restaurant Operating Margin 53.8 51.5 44.8 45.9 58.7 65.2 65.6 63.2 48.0 2.2
Franchise Operating Margin 82.6 88.0 88.2 92.9 94.9 98.8 99.5 104.0 114.7 54.7
Total Operating Margin $136.4 $139.5 $132.9 $138.7 $153.6 $164.0 $165.2 $167.1 $162.7 $56.9
1. Full year includes 53 operating weeks.
2. Data for the three fiscal quarters ended September 23, 2020.
43You can also read