Investor Presentation - Craig-Hallum Institutional Investor Conference June 2, 2021 - cloudfront.net
←
→
Page content transcription
If your browser does not render page correctly, please read the page content below
Investor
Presentation
Craig-Hallum Institutional
Investor Conference

June 2, 2021
Cautionary Note on Forward-Looking Statements

This disclaimer applies to this document and the verbal or written comments of any person presenting it. This document, taken
                 together with any such verbal or written comments, is referred to herein as the “Presentation.”

This presentation contains forward-looking statements, within the meaning of the Private Securities Litigation Reform Act of 1995, which are subject
to known and unknown risks, uncertainties and other important factors that may cause actual results to be materially different.

Forward-looking statements discuss the Company's current expectations and projections relating to its financial position, results of operations,
plans, objectives, future performance and business. You can identify forward-looking statements by the fact that they do not relate strictly to
historical or current facts. These statements may include words such as "aim," "anticipate," "believe," "estimate," "expect," "forecast," "outlook,"
"potential," "project," "projection," "plan," "intend," "seek," "may," "could," "would," "will," "should," "can," "can have," "likely," the negatives thereof
and other similar expressions.

All statements other than statements of historical fact included in this presentation are forward-looking statements, including, but not limited to, as
any such non-historical statement may relate to the timing of new venue openings, financial outlook for fiscal 2021 and beyond, operating
performance, construction start dates and milestones, sales and trends in Drive Shak Inc.’s (the "Company's") operations and the growth prospects
of our various business lines.

Forward-looking statements represent management’s view and are estimated based on current and projected future operating performance of
our locations, comparable companies in our industry and a variety of other assumptions, many of which are beyond our control and many of
which could prove incorrect or change over time. As a result, actual results may vary materially from expectations expressed in forward-looking
statements. For a discussion of some of the risks and important factors that could cause actual results to differ materially from forward-looking
statements, see the sections entitled “Risk Factors” and “Management’s Discussion and Analysis of Financial Condition and Results of Operations”
in the Company’s periodic reports filed with the SEC, which are available on the Company’s website (www.http://ir.driveshack.com).

Forward-looking statements speak only as of May 7, 2021. We make no undertaking to update or revise any forward-looking statements
contained herein to reflect any change in expectations with regard thereto or change in events, conditions or circumstances on which any
statement is based.

This Presentation includes forward-looking financial measures that are not recognized under generally accepted accounting principles (“GAAP”)
and does not speak to historical financial results but represents an estimate of future results The Company has not reconciled the non-GAAP
forward-looking statements expectations set forth in this presentation, as items that impact such expectations are out of the Company’s control
and/or cannot be reasonably predicted. Accordingly, a reconciliation is not available without unreasonable effort.

                                                                                                                                                                1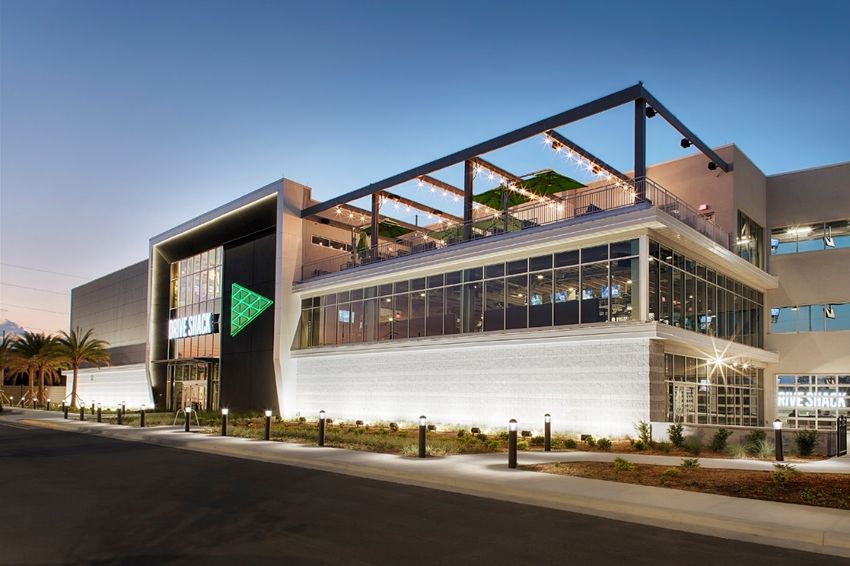
1. Executive Summary
Our Mission
Our Transformation
A New Type of Leisure
Our Courses and Venues
Strategic Partnership
2. Our Business
American Golf Corp.
Drive Shack
Puttery
3. Historical Financials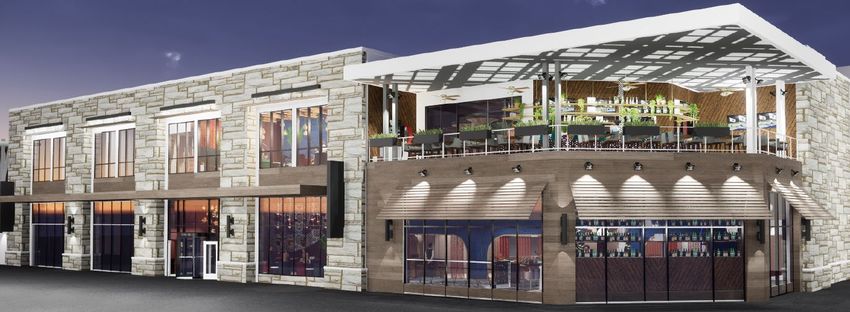
Executive Summary

                   Drive Shack Inc.

Drive Shack Inc. is                Our Mission
a publicly traded leisure
and entertainment                  To become the largest
company focused on                 venue-based
bringing people together           competitive socializing
through technology driven          and entertainment
competitive socializing            platform in the country
experiences.

                                                             3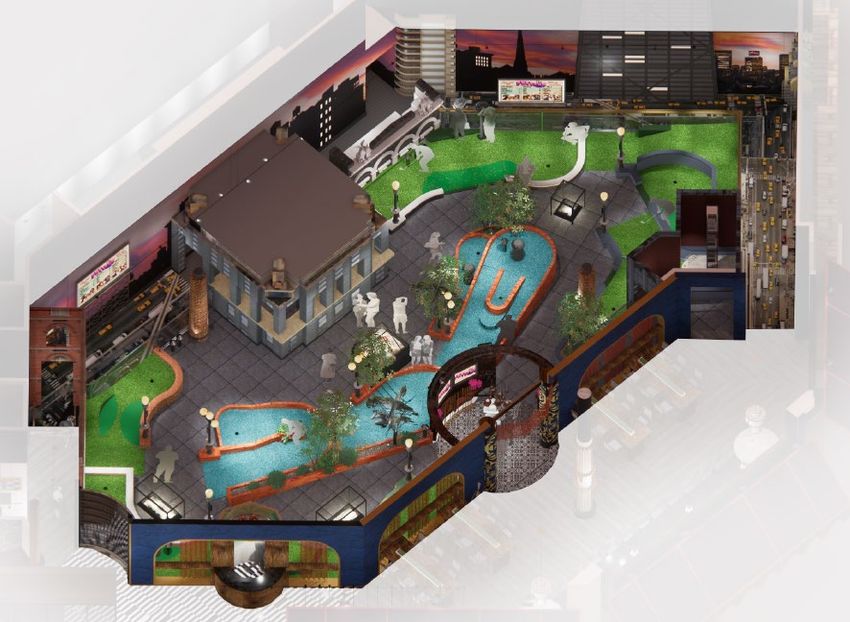
Executive Summary
Our Transformation
We transformed from a traditional golf business
into an entertainment operating company
Entertainment golf
Drive Shack Venues
Opened first Drive Shack in Orlando – April 2018
Traditional golf roots Used as our beta site to test enhancements for next
Transformed
generation of venues
Traditional
American Golf Co. Golf Business
into an Opened 3 Gen 2.0 venues across 2H 2019 – Raleigh,
As a traditional golf company, Richmond and West Palm Beach
Entertainment
we own, lease, and manage courses
Operating These venues significantly outperformed expectations
Sold majority of owned course Company in 2019, beating revenue plan by +14%
portfolio, continue to lease and
manage courses
Puttery Venues
Developing a new experience – “Puttery” (tech-enhanced
putting)
Expect to open or nearly complete 7 venues by YE 2021
4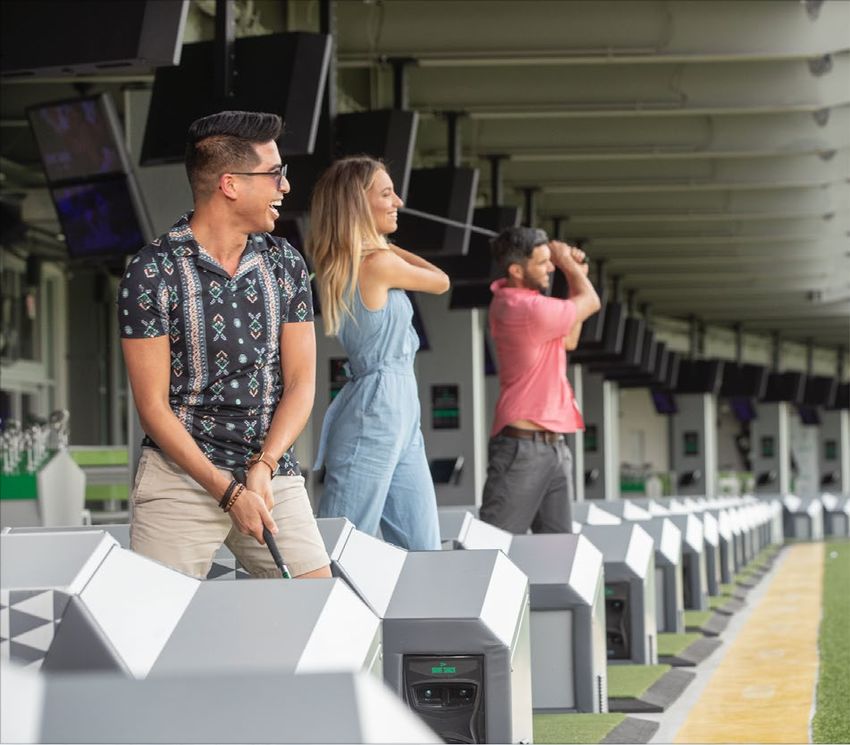
Executive Summary
We Provide a New Type of Leisure
Our Portfolio Of Entertainment Venues Directly Addresses Consumers’ Changing Preferences
Consumers are choosing to spend more Drive Shack combines 3 experiences
on experiences:(1) under one roof:
1 Entertainment
Guests interact, play and socialize
78%
of millennials would rather spend
money on an experience vs. buying in a sophisticated, fun setting
something(2)
2 Sports
Anchored on driving range and putting
featuring robust gaming platform
3 Food & Beverage
of consumers prefer to dine at
70%
Elevated Food & Beverage with focus
entertainment formats vs. typical
on “sharable” options
casual restaurants for group
occasions(3)
= Competitive Socializing
1)
2)
Source: Pew Research Center (April 2018); Forbes (June 2014).
Source: USA Today (June 2017). 5
3) Source: Technomic Research (2019)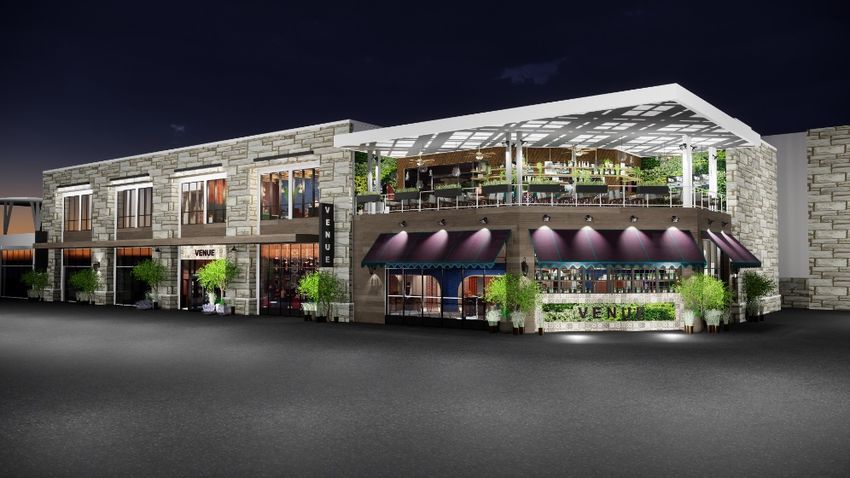
Executive Summary
                                           Our Courses and Venues                                                                   (1)

   AGC             OWNED                                     LEASED                                      MANAGED
  GOLF            1 Course                                 33 Courses                                    22 Courses
COURSES

                       CURRENT VENUES                                                                                        COMMITTED VENUES
                         Orlando, FL                              Raleigh, NC                                         New Orleans, LA         Manhattan, NY
  DRIVE                  Opened Q2
                         (Beta Site)
                                                                  Opened Q3                                           On Hold (2)             (Randall's Island)
                                                                  Richmond, VA
 SHACK                                                            Opened Q3
 VENUES                                                           West Palm, FL
                                                                  Opened Q4

               2018                                    2019                                                2021                           2022+
 PUTTERY
                                                                                                                      Dallas, TX              Robust Pipeline in 24
 VENUES                                                                                                               Charlotte, NC           Prioritized Markets for
                                                                                                                      Washington DC           Opening in 2022+
                                                                                                                      +4 Additional Targets

           1) As of 5/10/2021.
           2) Drive Shack is committed to 1 lease in New Orleans. The venue’s development status remains “on hold”.
                                                                                                                                                                        6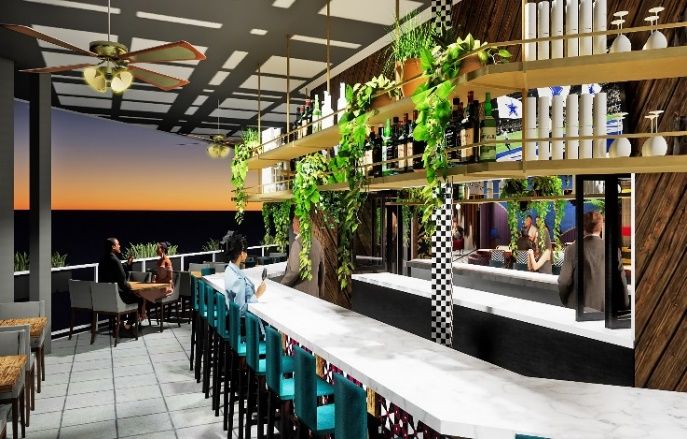
Executive Summary
Strategic Partnership
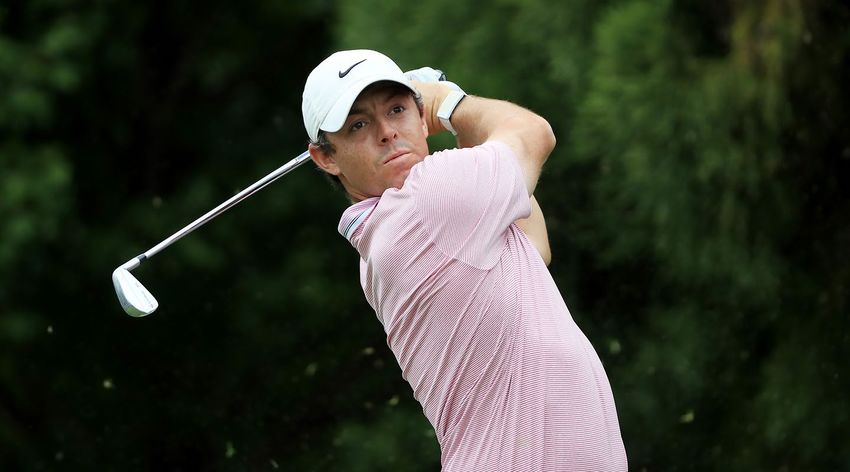
Announced strategic partnership with PGA player, Rory McIlroy, for Puttery collaboration
Rory is a member of both the European and PGA Tours
He has spent 106 weeks as #1 in the Official World Golf Ranking
He is a two-time FedEx Cup winner and was the PGA 2019 Player of the Year
4 28 157
MAJORS WON CAREER WINS
TOP 10 FINISHES
“I am thrilled to partner with the Drive Shack team on
their new entertainment golf experience. Once Covid
is under control, the ability to combine high-tech
mini-golf with a high-quality food & beverage menu
will make Puttery a great experience for any social
gathering. I am personally making a financial
investment in the growth of future Puttery venues
across the country and can’t wait to debut our first
Puttery in Dallas this summer.”
- Rory McIlroy
71. Executive Summary
Our Mission
Our Transformation
A New Type of Leisure
Our Courses and Venues
Strategic Partnership
2. Our Business
American Golf Corp.
Drive Shack
Puttery
3. Historical FinancialsOur Business
American Golf Corp.
One of the largest operators of golf properties in the U.S.
1 • AGC operates 56 traditional courses(1)
nationwide serving over 3 million
1
5 visitors per year
1
• Municipality partnerships account for
44
~85% of AGC’s leased properties;
most relationships have lasted 3+
decades
1
1 • Able to leverage these strong
1 relationships as we build out
1 entertainment venues
AGC courses • AGC serves as a consistent and
stable business
1) As of May 10, 2021.
9Our Business
Strong Demand Continues for Traditional Golf (1)
American Golf’s exceptional results highlight the unwavering demand for traditional golf, reinforcing
it as a top leisure activity in the current environment
Public Courses Private Courses
+46%
Revenue from
+33%
Daily fee rounds
+30%
Member sales
+29%
(2)
Total rounds
green & cart fees Q1 2021 vs. Q1 2020 Q1 2021 vs. Q1 2020 Q1 2021 vs. Q1 2020
Q1 2021 vs. Q1 2020 641K
$20.5M
506K
$16.7M 455K 113K
180
$14.3M 98K 97K
88K
342K
296K 118
$9.8M 68K
$9.5M 107
91
74
Q1-20 Q2-20 Q3-20 Q4-20 Q1-21 Q1-20 Q2-20 Q3-20 Q4-20 Q1-21 Q1-20 Q2-20 Q3-20 Q4-20 Q1-21 Q1-20 Q2-20 Q3-20 Q4-20 Q1-21
Revenue from green/cart fees Daily Fee Rounds Member sales Total rounds
1) Comparisons are based on our 30 public and 5 private owned and leased properties as of 3/31/2021.
10
2) Member sales represent Full Golf memberships only.Our Business
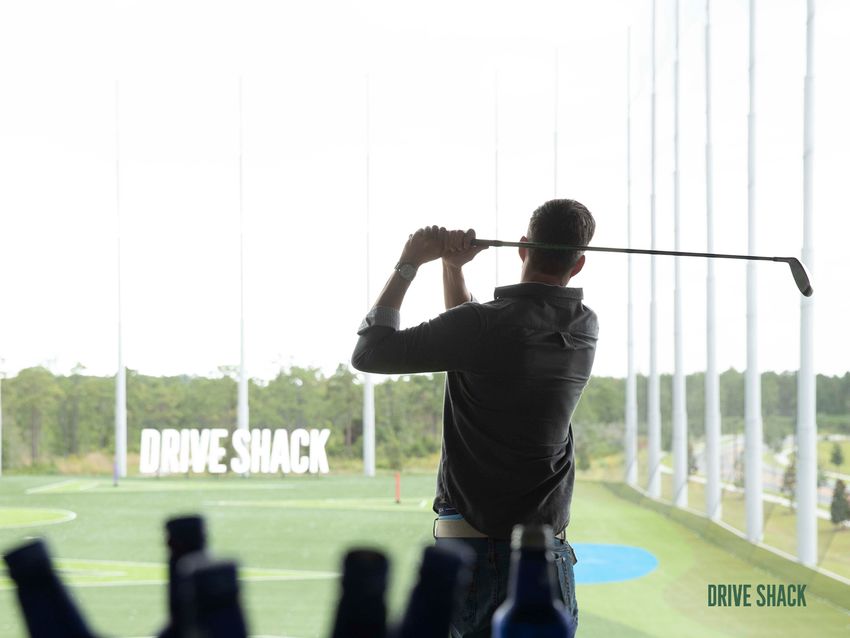
Drive Shack: The New Way to Golf
Our Venues Are Designed To Solve Issues Preventing Growth Across The Traditional Golf Industry
More affordable Indoor/outdoor Less time All skill level
no equipment all-weather required players can play
purchase required games
Higher growth trajectory
The shift to Lower cyclicality
entertainment Increased margins
golf from
Improved capital efficiency
traditional golf
Enhanced shareholder value
provides us with: creation
11Our Business
Drive Shack Venues– Q1 2021 Results
Total Revenue of $8.2M – Walk-in revenue of $7.4M | Events revenue of $0.8M
Total venue revenue averaged 81% of Q1 2020 levels
Total venue walk-in revenue averaged 96% of Q1 2020 levels
Drive Shack Venues: Revenue by Quarter
($ in 000's)
Walk-In Event
$3,560 $3,541
$3,310
$2,751
$2,591
$2,375
$2,192 $2,111
$1,860 $1,877
$1,679
$1,515
$1,175 $1,202
$1,022
$550
$63 $144
$0 $0
Q1-20 Q2-20 Q3-20 Q4-20 Q1-21 Q1-20 Q2-20 Q3-20 Q4-20 Q1-21 Q1-20 Q2-20 Q3-20 Q4-20 Q1-21 Q1-20 Q2-20 Q3-20 Q4-20 Q1-21
West Palm Richmond Raleigh Orlando
12Our Business
Puttery – Our Newest Format
Using state-of-the-art putting, Puttery combines
competitive socializing, F&B and technology to
create one remarkable experience, featuring:
An adult-focused, modern spin on the classic game
of mini golf, using innovative auto-scoring technology
A high energy atmosphere anchored by multiple
bars, lounges and rotating DJs
Dallas/The Colony Puttery
In summer 2021, we will debut our first 2 Puttery venues
in Dallas and Charlotte
Dallas construction continues, including buildout on
the four golf courses, kitchen and bars
Charlotte permitting was approved; construction
has commenced
Executed Washington DC/Penn Quarter lease in March;
design process is underway
Drive Shack Venues We expect to open or nearly complete 4 additional
Puttery locations in 2021 and 10 venues in 2022
Based on management’s current views and estimates. See “Disclaimers” at the beginning of this Presentation for more information on forward-looking statements.
13Our Business
Attractive Unit Economics – Puttery (1)
The Puttery presents the best path forward for near-term growth
Our goal is to build 17 Puttery venues by the end of 2022
Target Puttery venue EBITDA is $2 to $3 million and DS venue EBITDA is $4 to $6 million
Illustrative Venue-Level Economics(1)
DS Venues Puttery Venues
$ in millions
72 to 90+ Bays Indoor, Mini Golf
Size (sq. ft.) 50K - 60K+ 15K - 20K
Development Time 18 - 24 mo. 6 - 9 mo.
Development Cost(2) $25 - $40 $7 - $11
Total Revenue $15 - $25 $7 - $11
Site-level EBITDA $4 - $6 $2 - $3
As we continue to open
Development Yields 10 – 20% 25 – 40% Puttery venues, yields may
be even higher
1) Represents illustrative economics of Puttery and Drive Shack venues, including Total Revenue and Site-level EBITDA, without restrictions or impact due to COVID-19.
2) Development cost target is inclusive of all construction costs, soft costs, and pre-opening expenses. 14
Based on management’s current views and estimates. See “Disclaimers” at the beginning of this Presentation for more information on forward-looking statements.Our Business
Increased Growth Potential
Puttery Renderings
Started with large format Drive Shack venues in
major metropolitan markets
Freestanding 60,000 sq. ft. open-air venue built on
~12 acres
Launching small format Puttery venues for dense
urban markets where a Drive Shack does not fit
Tenant in 15,000 – 20,000 sq. ft. existing indoor space
Puttery expands venue potential by hundreds of
markets due to:
Vast availability of real estate at potential discount
Shorter development timelines
Less capital risk
Higher development yields
Drive Shack Venues
15
Based on management’s current views and estimates. See “Disclaimers” at the beginning of this Presentation for more information on forward-looking statements.Our Business
Portfolio of High-Quality Locations with Growing Pipeline
Dallas and Charlotte opening summer 2021
Washington DC and 4 additional locations to open or be near complete by end of 2021
Expect to open 10 additional Puttery venues in 2022
Pursuing pipeline of Puttery sites in prioritized and future markets to complement our portfolio of DS venues
Believe current market allows for numerous Puttery locations across the U.S.
MANHATTAN, NY
WASHINGTON D.C.
RICHMOND, VA
RALEIGH, NC
CHARLOTTE, NC
ORLANDO, FL
Drive Shack
(Open venues in black) WEST PALM BEACH, FL
NEW ORLEANS, LA
Puttery (On Hold)
DALLAS, TX
Prioritized & Future Markets
Based on management’s current views and estimates. See “Disclaimers” at the beginning of this Presentation for more information on forward-looking statements.
16OUR GOALS ARE SIMPLE…
1 5
Drive Shack
$4 - $6M
EBITDA per venue
= ~$21M
Total DS EBITDA
5 DS Venues(1)
by 2022
2 17
Puttery
$2.5 - $3M
EBITDA per venue
= ~$48M
Total Puttery EBITDA
17 Puttery’s
by 2022
1) Drive Shack is committed to 1 lease in New Orleans. The venue’s development status remains “on hold” and is therefore excluded from future venue counts.
Based on management’s current views and estimates. See “Disclaimers” at the beginning of this Presentation for more information on forward-looking statements 17
There can be no assurance that we will achieve Run Rate EBITDA and Enterprise Valuation projections and actual results may differ materially1. Executive Summary
Our Mission
Our Transformation
A New Type of Leisure
Our Courses and Venues
Strategic Partnership
2. Our Business
American Golf Corp.
Drive Shack
Puttery
3. Historical FinancialsHistorical Financials
American Golf Historical Performance
Closed nearly every traditional golf course by end of Q1 2020 due to COVID
By June, all AGC properties had reopened and were met with significant demand
Delivering strong results despite limitations on large group gatherings; event revenue remain challenging
AGC Revenue: Q1 – Q4 (2018 – 2020)
Non-Event ($ in M’s)
Event
$18 $15
$11
$8 $13
$0 $13
$10 $0
$6 $5
$71 $71
$58 $57 $0 $60 $60
$55 $53
$46 $46 $49
$30
2018 2019 2020 2018 2019 2020 2018 2019 2020 2018 2019 2020
Q1 Q2 Q3 Q4
The 2020 vs. 2019 decrease is primarily driven by course closures (Q2) and events (Q2/Q3)
The 2019 vs. 2018 decrease is largely due to fewer golf courses owned or operated in 2019(1)
1) Began 2018 with 75 courses, ended 2019 with 59 courses.
19First Quarter 2021 Financial Results
Three Months Ended
March 31,
$ in millions, except per share data
2021 2020 $ Variance % Variance
Drive Shack Revenue $8.2 $10.1 ($1.9) (19%)
American Golf Revenue $52.9 $51.0 $1.9 4%
Total Company Revenue $61.1 $61.1 Flat Flat
Operating Loss ($7.9) ($14.8) $6.9 47%
Net Loss ($10.9) ($17.4) $6.5 37%
Adjusted EBITDA(1) $2.7 ($4.7) $7.4 158%
Net Loss Applicable to Common Stock,
($0.15) ($0.28) $0.13 46%
per share(2)
1) Adjusted EBITDA is a Non-GAAP financial metric. See Adjusted EBITDA Non-GAAP Reconciliation on page 20. 20
2) Amounts shown are for both Basic and Diluted per share results for the periods ended March 31, 2021 and March 31, 2020.Consolidated Statement of Operations (Unaudited)
($ in thousands, except per share data) Three Months Ended March 31,
2021 2020
Revenues
Golf operations $53,161 $48,625
Sales of food and beverages 7,930 12,510
Total revenues $61,091 $61,135
Operating costs
Operating expenses 48,870 54,367
Cost of sales – food and beverages 2,104 3,655
General and administrative expense 7,982 9,818
Depreciation and amortization 6,245 6,794
Pre-opening costs 556 552
Loss on lease terminations and impairment 3,209 792
Total operating costs $68,966 $75,978
Operating Loss ($7,875) ($14,843)
Other income (expenses)
Interest and investment income $153 $130
Interest expense, net (2,626) (2,745)
Other income (loss), net (61) 367
Total other income (expenses) ($2,534) ($2,248)
Loss before income tax ($10,409) ($17,091)
Income tax expense 495 271
Net loss ($10,904) ($17,362)
Preferred dividends ($1,395) ($1,395)
Net Loss Applicable to Common Stockholders ($12,299) ($18,757)
Per WA Basic Share ($0.15) ($0.28)
21Consolidated Balance Sheet (Condensed)
($ in thousands) As of 3/31/2021 As of 12/31/2020
Assets (Unaudited)
Current Assets:
Cash and cash equivalents $85,936 $47,786
Restricted cash 2,852 2,252
Accounts receivable, net 5,143 4,446
Real estate securities, available-for-sale 3,271 3,223
Other current assets 17,754 14,410
Total Current Assets $114,956 $72,117
Restricted cash, noncurrent 795 795
Property and equipment, net of accumulated depreciation 167,663 169,425
Operating lease right-of-use assets 195,280 192,828
Intangibles, net of accumulated amortization 14,574 15,124
Other assets 6,593 6,765
Total Assets $499,861 $457,054
Liabilities
Current Liabilities:
Obligations under finance leases $6,180 $6,470
Membership deposit liabilities 14,748 14,692
Accounts payable and accrued expenses 26,308 29,596
Deferred revenue 20,079 23,010
Other current liabilities 27,504 28,217
Total Current Liabilities $94,819 $101,985
Credit facilities and obligations under finance leases - noncurrent 11,653 12,751
Operating lease liabilities - noncurrent 173,528 167,837
Junior subordinated notes payable 51,180 51,182
Membership deposit liabilities, noncurrent 101,853 99,862
Deferred revenue, noncurrent 10,983 9,953
Other liabilities 3,463 3,447
Total Liabilities $447,479 $447,017
Stockholders' Equity
Preferred Stock $61,583 $61,583
Common Equity (9,201) (51,546)
Total Stockholders' Equity $52,382 $10,037
Total Liabilities & Stockholders' Equity $499,861 $457,054
22Adjusted EBITDA Non-GAAP Reconciliation
Three Months Ended
March 31,
($ in thousands) 2021 2020
(unaudited) (unaudited)
Net Loss ($10,904) ($17,362)
Income tax expense 495 271
Other (income) loss, net 61 (367)
Net interest expense 2,473 2,615
Operating Loss ($7,875) ($14,843)
Depreciation and amortization 6,245 6,794
Loss on lease terminations and impairment 3,209 792
Pre-opening costs 556 552
Other items(1) 596 2,008
Adjusted EBITDA $2,731 ($4,697)
(1)For the three months ended March 31, 2021 and 2020, other items include (i)corporate severance of $130 and $693, respectively; (ii) transactional G&A of $196 and $1,178, respectively; 23
and (iii) employee stock-based compensation of $270 and $137, respectively.You can also read