SingTel Investor Day: Optus Overview and Strategy - Paul O'Sullivan Chief Executive, Optus

Page created by Christina Mueller
 
CONTINUE READING
SingTel Investor Day: Optus Overview and Strategy - Paul O'Sullivan Chief Executive, Optus
SingTel Investor Day:
Optus Overview and Strategy
Paul O’Sullivan
Chief Executive, Optus
11 July 2011
SingTel Investor Day: Optus Overview and Strategy - Paul O'Sullivan Chief Executive, Optus
2
Forward looking statements - important note
The following presentation may contain forward looking statements by the management of SingTel Group
relating to financial trends for future periods, compared to the results for previous periods.

Some of the statements contained in this presentation that are not historical facts are statements of future
expectations with respect to the financial conditions, results of operations and businesses, and related plans
and objectives. Forward looking information is based on management's current views and assumptions
including, but not limited to, prevailing economic and market conditions. These statements involve known and
unknown risks and uncertainties that could cause actual results, performance or events to differ materially
from those in the statements as originally made. Such statements are not, and should not be construed
as a representation as to future performance of SingTel Group. In particular, such targets should not
be regarded as a forecast or projection of future performance of SingTel Group. It should be noted that the
actual performance of SingTel Group may vary significantly from such targets.
SingTel Investor Day: Optus Overview and Strategy - Paul O'Sullivan Chief Executive, Optus
Video: Queensland Disaster Rescue

3
SingTel Investor Day: Optus Overview and Strategy - Paul O'Sullivan Chief Executive, Optus
4

Today
1 Optus overview

2 FY11 performance

3 Future opportunities and strategy
SingTel Investor Day: Optus Overview and Strategy - Paul O'Sullivan Chief Executive, Optus
5

Today
1 Optus overview

2 FY11 performance

3 Future opportunities and strategy
SingTel Investor Day: Optus Overview and Strategy - Paul O'Sullivan Chief Executive, Optus
6
Optus: integral part of an extensive group

                                Optus’ contribution to                                                                                                        Optus’ contribution to
                                proportionate revenue1,2                                                                                                      proportionate EBITDA1,3

                                                                 Others                                                                                                              Others

                                                                   1%                                                                                                                 1%

                                                                                   35%                                                                     Optus        30%
                                Optus            41%         SingTel                           Regional
                                                                                                                                                                                 SingTel            Regional
                                                              Group                                                                                                               Group       45%
                                                                                               Mobile                                                                                               Mobile

                                                                                                                                                                               24%
                                                                    23%
                                                                                                                                                                   Singapore
                                                                 Singapore

1. Proportionate information is provided as supplementary data only – to show relative contribution from Singapore, Australia and other regional markets
2. Consolidated revenue plus proportionate share of associates revenue – 12 months to Mar 2011
3. Consolidated EBITDA plus proportionate share of associates EBITDA – 12 months to Mar 2011
SingTel Investor Day: Optus Overview and Strategy - Paul O'Sullivan Chief Executive, Optus
7
We’re a large company and growing
Customers                                                                           REVENUE (A$Bn)               EBITDA (A$Bn)
•   9.1m mobile customers                                                    CAGR                       CAGR
                                                                                       +8%                         +12%
•   1m on-net telephony customers
•   960k on-net fixed broadband customers
•   Key Business customers include ANZ, Tabcorp, DIAC and ATO
•   Key Wholesale Partners include M2, Amaysim & Dodo
                                                                             2002                2011     2002                   2011
Customer Experience
• Over 260 Optus branded stores and over 9,000 retail outlets distributing      NET PROFIT (A$M)          FREE CASH FLOW (A$M)
  prepaid products and services
• Approximately 2.5m My Account registrations (online)
• Approximately 1,000 staff in our national sales and telemarketing
  operations in Consumer & SMB
• Over 5,000 Consumer & SMB call centre staff

Our people                                                                   2002                2011     2002                   2011
• 10,090 employees
• Employee Engagement score 2% above Global Telco norm
SingTel Investor Day: Optus Overview and Strategy - Paul O'Sullivan Chief Executive, Optus
8
Optus: three major businesses
                                Mobile                                                                       OB/OWS (fixed)                Consumer & SMB (fixed)
                      A$6.0bn                                                                                 A$2.0bn                           A$1.3bn
     • 9.1m Optus subscribers                                                           • Full service provider to business and       • HFC network covers 1.4m homes
         – 4.8m Postpaid                                                                  government, and wholesale services to
                                                                                                                                      • Optus ULL service covers up to 2.9m
                                                                                          service providers
         – 4.3m Prepaid                                                                                                                 premises
                                                                                        • Approximately 18,000 major buildings
         – Includes 1.3m WBB subs                                                                                                     • Over 1m on-net telephony customers
                                                                                          connected
     • 31.9% subs share2; 30.7% revenue                                                                                               •   960k on-net broadband customers
                                                                                        • Australia‟s #1 satellite owner / operator
       share3
     • Data 40% of service revenue; non-
       SMS data 18% of service revenue

              26% EBITDA MARGIN                                                                      27% EBITDA MARGIN4                     17% EBITDA MARGIN
1.    Figures are for 12 months to 31 Mar 11, unless otherwise stated
2.    As at 31 December 2010 (JP Morgan)
3.    Service revenue for 12 months to 31 December 2010 (JP Morgan)
4.    EBITDA margin excluding impact of the reversal of outpayment provision no longer required (including impact: 28%)
SingTel Investor Day: Optus Overview and Strategy - Paul O'Sullivan Chief Executive, Optus
9
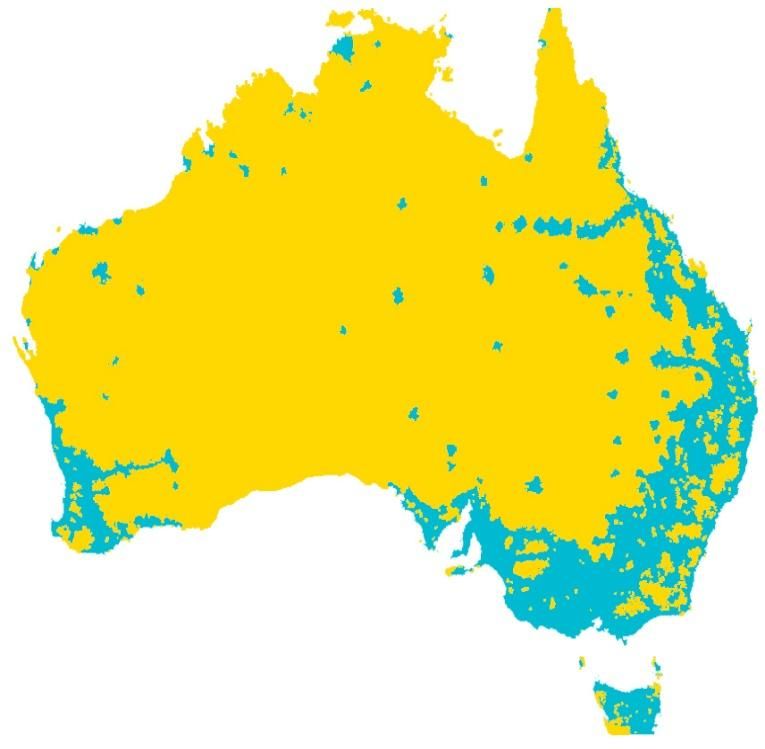
Our network: over A$16BN invested since 1992
Fibre/Coaxial Cable                                                     Satellite
•   Inter-city (from Perth to Cairns – OVER 10,000KMs)                  • 5 currently in orbit delivering Pay TV to over 2M households
•   Intra-city – OVER 12,000KMs                                         • Currently constructing Optus 10, to launch in 2013
•   Hybrid Fibre Coaxial – OVER 26,000KMs                               • 6 satellite earth stations
•   Ownership in – 7 international cables                               Source: Optus Network Information: FY11

ULL
                                                                                                          Darwin
• Over 1,200 DSLAM racks in 418 exchanges                                                                                                     Cairns
                                                                                                                                                                             B3 Satellite

• Over 70% of exchanges in metro areas                                                                                                                                       C1 Satellite

• Delivers fixed voice and ADSL2+ broadband                                            Port Hedland
                                                                                                                                    Mt Isa                                   D1 Satellite
    to residential and business customers
                                                                                                                                                                             D2 Satellite
Mobile                                                                                                                                                       Brisbane
                                                                                                                                                                             D3 Satellite
• Over 9,000 base stations, incl approx 5,000 3G base stations                  SEAMEWE 3

• 3G network delivers 7.2Mbps data speed capability to 80% population               Perth
                                                                                                                                                                  Southern Cross
                                                                                                                                      Canberra
• Fibre backhaul to 80% of metro base stations                                                                           Adelaide
                                                                                                                                                       Sydney

Facilities                                                                  LOCAL FIBRE RING           EARTH STATION                             Melbourne
                                                                            SWITCHING                  INTERNATIONAL FIBRE OPTIC

• 17 exchanges                                                              INFRASTRUCTURE
                                                                            MOBILE COVERAGE
                                                                                                       CABLE
                                                                                                       LEASED CAPACITY
                                                                                                                                     Hobart

• 1 dedicated hosting and data centre                                       OPTUS FIBRE OPTIC CABLE
SingTel Investor Day: Optus Overview and Strategy - Paul O'Sullivan Chief Executive, Optus
10
Growing cash flows and strong financial position
                   CAGR
                                                                                       S&P Rating
                                13%                                          1,206

                                        967             1,015                        AAA
                        903
        742
                                                                                     AA

                                                                                     A+

                                                                                      A
        2007            2008            2009             2010                2011
  Note: All numbers are in A$m and are for FY ended 31 March                          A-

                                                                                     BBB+
  • Net Debt A$1.4bn1                             • Committed medium term bank
  • Access to international                         facilities
                                                                                     BBB
    debt capital markets                              - Total facilities A$1.2bn2
       - US$500m 10 yr notes                          - Maturing 2014
                                                                                     BBB-
       - HK$ 1bn 10 yr notes
                                                      1: As at 31 Mar 2011
       - €700m 10 yr notes                            2. As at 1 July 2011
                                                                                     BB-
11
Optus’ brand positioning: Anything is possible

                 RATIONAL                        EMOTIONAL
12

Today
1 Optus overview

2 FY11 performance

3 Future opportunities and strategy
13
Optus: recapping what we said last year

         FY08-FY09                                   FY2010                                   FY2011
        Begin Transformation                         Acceleration                        We said we would…

 • Business stabilisation                 • Increase mobile growth momentum        • Focus on maintaining mobile
 • Re-start mobile growth                   to drive revenue share gains             momentum
 • Targeted investments:                  • Deliver initial customer experience    • Drive to leadership in customer
    - Reitz, 96% 3G, D3                     differentiation and realise benefits     experience and relevance
 • Begin transformation                   • Transform fixed market structure       • Exploit the NBN
                                            via NBN advocacy
    -   Customer experience
    -   Corporate business
    -   Fixed on-net focus; resale exit
    -   G9 advocacy
OCTOBER 2009                                     14
FY11: mobile was a year of two halves, with increasedConsumer
                                                      competition in 2H
                                                              Mobile service revenue share (%)
                                                                                                  8.12      7.81               7.67
                          -0.6%             -0.1%                      +0.6%             0.0%                          +0.1%             +0.1%

                    42.4%         41.8%             41.7%      30.1%           30.7%            30.7%          27.4%           27.5%                7.44
                                                                                                                                                 27.6%

                    2H CY09       1H CY10           2H CY10    2H CY09         1H CY10          2H CY10       2H CY09          1H CY10           2H CY10

 Source: JPMorgan
15
Optus CE is stable while customer expectations are increasing
                                                                                                                                                      ~5% improvement in satisfaction
                                                                                                            Optus ‘Yes’ Meter results stable
                                                                                                                                                      with how we are servicing our
                                                                                                                                                      customers‟ enquiries in SMB &
         We operate in an environment                                                                                                                 Consumer
                                                                                                                                                      ~5% improvement in satisfaction with
         of heightened awareness:
                                                                                                                                                      how we are servicing our customers‟
         • Changing customer expectations                                                                                                             enquiries in SMB & Consumer
         • Increased regulator advocacy

                                                                                                                                                      ~8% overall improvement in satisfaction
         Building on our CE tradition...                                                                                                              on how we bill our customers in SMB

                                      SingTel Optus Lean                                                                                              ~8% increase in OWS customers‟
                                      • 40 projects completed                                                                                         satisfaction in how we are resolving
                                      • 51 projects in flight                                                                                         their service difficulties
                                      • 1,953 people trained
                                                                                                                                                      ~7% improvement in satisfaction
                                                                                                                                                      with how we connect and provision
                                                                                                               Mar-10                     Mar-11      our products for our OB Customers

Note: The „yes‟ Meter is independent “unsponsored” research undertaken to assess how Optus rates in Customer Experience relative to our competitors
16
Optus plays a key role as the NBN becomes a reality

     Structural   Equivalence
     separation    of access

     Cost-based   Strong ACCC
       pricing     oversight
17
Overall Optus exceeded market guidance in FY11

  FY11 GUIDANCE                                     FY11 OUTCOMES
  Revenue to grow at mid single-digit level         Revenue A$9,284m         Up 4%

  EBITDA to grow at mid single-digit level          EBITDA A$2,334m          Up 8%

  Capital expenditure to be approx. A$1.2 billion      A$1,018m        Capex: Revenue 11%

  Free cash flow to be above A$1.0 billion             A$1,206m              Up 19%
Video: Optus achievements

18
19

Today
1 Optus overview

2 FY11 performance

3 Future opportunities and strategy
20
A number of key trends continue to shape
the Australian Telco landscape
                                     Technology Technology step change driving
                                                bandwidth and faster speeds

                     Economy
          A two tier economy                       Customer Focus
                  is emerging                      Moving from Ear to Eye

                        Regulation             Competitors
Continuing shift towards NBN world             Traditional more aggressive.
                                               New entrants building links.
21
Technology continues to evolve rapidly
                           Mobile network bandwidth                                                                                                         Fixed network bandwidth
                                                                                                                                 1,000,000                                                                  1 Gbit/s
                                                  Industry
                                                  as at today
                                                                                                                                  100,000                                                          100 Mbit/s
   Mobile network                                                       100 / 40Mbps   Actual Customer
   development                                                                         Experience#                                 10,000                                              10 Mbit/s
                                                                                                                                                                                                           100Mbps possible

                                                                                                           Downstream Bit Rate
                                                    50 / 20Mbps
                                                                                                                                                                                                           before 2020 for 93%
                                                                                                                                     1,000                                      1500                       Aust population via
                                    42 / 11Mbps                                                                                                                               512
                                                                        > 15 Mbps                                                                                                                          NBN. Optus‟ HFC
                                                                                                                                                                           256                             network      already
                   21 / 5Mbps                                                                                                         100
                                                    10-12 Mbps                                                                                                                                             provides close to
   7.2 / 2.0Mbps
                                                                                                                                                                    56
                                        8 Mbps                                                                                                              28 33                                          these speeds in
                     5 Mbps                                                            Latency # (Delay)                                                     14.4                                          Melbourne, Sydney
     3 Mbps                                                                                                                            10           9.6
                                                                                                                                                                                                           & Brisbane.
                                                                                                                                         1          2.4
       HSPA                     HSPA+                             LTE                                                                        1980    1990           2000            2010           2020          2030
22
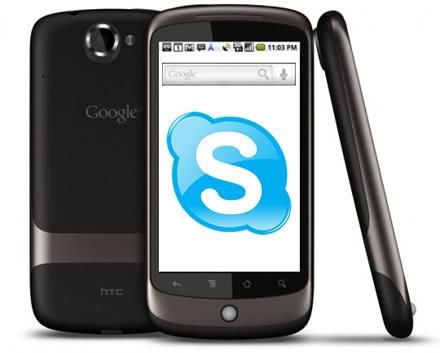
Mobile customers are connecting over a wide range of ‘smart’ devices...

                                                                                                         Tablets are providing greater HD video
Smartphones a key acquisition driver                                  Mobile broadband net adds (‘000)   capability
Australia Smartphone Shipments % Total Handset Shipments                                                 Australia Tablet Shipments (M)

                                                                                                                                                         1.3
                                                                                                                                                  1.0
                                                           90%                        1,356   1,415
                                            85%
                                                                                                                                           0.8
                79%           83%                                                                                           0.7
  57%                                                                     951

                                                                                                             0.3

  2010          2011         2012          2013            2014          2008         2009    2010          2010            2011           2012   2013   2014

 Source: IDC                                                      Source: JP Morgan                                Source: Goldman Sachs
23
 ...and are shifting their use of the mobile device from ‘ear to eye’

                                                                        Functions used on mobile phones – 2010 vs 2009
                                                                                                                                             2009
                                    86%
                                                                  78%
                                                                                                                                             2010
                          71%                           70%

                                                                                 52%            *
                                                                                              50%              49%
                                                                                                                                 39%
                                                                                                        36%
                                                                        29%                                                                  28%
                                                                                                                         20%
                                                                                                                                       15%   14%

                                                                                                                               7%

                                SMS                         Photos            Internet      Games             MMS              Email     GPS Nav.

                                          41%

Source: Nielsen, The Australian Online Consumer Report, February 2011
* „Games is a new category introduced in 2010
24
Aggressive competition from incumbent operator
                         Telstra EBITDA margin – six months                                                                                              Mobile net adds („000)

                                                                                                                                                  Six months                            Quarter
                                                        44.3%                                                                                                    919
                           43.1%
                                                                                     37.3%
                                                                                                                     Telstra
                                                                                                                     Optus

                         Dec-09                       June-10                       Dec-10                                                  445
                                                                                                                                                                                       364
                                                                                                                                                                        276
                                                                                                                                175
                                                                                                                                                                                                  103
     Telstra FY11 “Strategic Opex Investments” announced Sep 2010
                                                                                                                                       Jun-10                      Dec-10                Mar-11
DVC/COGS
       New
   Products
                                                                                                                 Mobile Service Revenue and YoY growth - six months (A$m)
      Labour                     Spend on                                                                                                                3,250                3,421
                                                                                                                               3,211
Project New                    DVC/COGS was                                                            ~$40m
                               $500m at 1H11                                                                                   +4.7%                     +7.1%                +6.5%
         Other                                                                                           ~$50m

          Total                                                                                          $1bn             Dec-09                         Jun-10               Dec-10

Source: Telstra disclosures. Note: Guidance of flattish revenue and high single digit EBITDA decline
25
VHA leading on price but limited pull-through on customer growth
                                                                                         Mobile net adds (‘000)
     Aggressive “Infinite” plans                                                   Six months                                         Quarter
                                                                 539
                                                                                                                                                    Postpaid
                                                                                                                                                    Prepaid
                                                                 395
                                                                                                      142                                           Mobile

                                                                 144                                  188
                                                                                                      -46
                                                                                                                                           -150 *
                                                                Jun-10                               Dec-10                                Mar-11

     • $35-$100 price points (prepaid / postpaid)            Mobile Service Revenue and YoY growth - six months (A$m)

     • Unlimited calls, TXT and social network access                                                                                     2,261
                                                                   2,043                              2,142
     • 250MB-4GB of data offered                                    N/A                              +9.3%                                +10.7%

     • Various handsets available

                                                                   Dec-09                             Jun-10                              Dec-10

                                                        Source: Carrier‟s disclosures, JP Morgan
Source: Vodafone Hutchison Australia Pty Ltd website    * Hutchison Whampoa FY10 results announcements (VHA customers at 28 March 2011)
26
Competitive low-end postpaid offers fuel growth in postpaid,
but prepaid growth moderates

                     Market Subscriber Growth - Postpaid (‘000)                            Market Subscriber Growth – Prepaid (‘000)

                            +6%            +5%            +7%            +7%                 +6%        +3%            0%            +2%

                                                 14,697         15,658         16,744                                                      11,244
                   13,164         13,806                                                10,127     10,698     10,973        11,002

                   Dec-08         Jun-09         Dec-09         Jun-10         Dec-10
                                                                                        Dec-08     Jun-09     Dec-09        Jun-10         Dec-10

Source: JPMorgan
27
Strong take-up for digital services as smartphone penetration increases

                                               Growth in Optus Browsing Revenue (excl WBB)

                                                                +62%

                                                         FY10          FY11
28
Progress on regulatory issues, with some yet to be determined

               MOBILE                                             FIXED
           Negotiations with Government on                Parliament passes key legislation for structural
           renewal of existing spectrum licences          separation of Telstra and NBN Co governance

           Late 2012 confirmed for wireless               ACCC‟s draft final determination on ULL /
           spectrum auctions (700 MHz, 2.5 GHz)           PSTN access pricing

   To be determined:                               To be determined:
   • ACCC review of mobile termination rates       • ACCC approval for Telstra Structural Separation
   • ACCC review of transmission                       Undertaking and Optus / NBN HFC agreement
       pricing for backhaul                        • ACCC to review NBN Co‟s proposed access pricing
   • ACMA “Reconnecting the Customer” Inquiry      • ACCC decision pending on Foxtel/
                                                       Austar merger
29
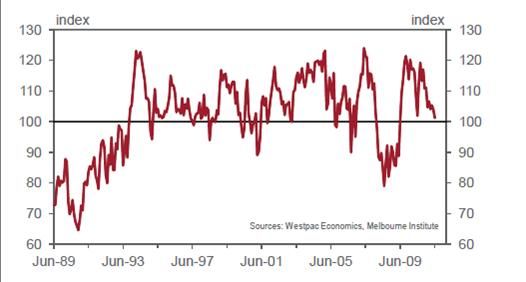
Australia - two speed economy is emerging and consumer sentiment is soft

     Australian GDP (Forecast)                     Consumer sentiment

                      4.25%      3.75%    3.75%
       2.70%

        2010          2011f      2012f    2013f

     Interest Rates

                                                      “Growth in household consumption and borrowing,
         4.25%        4.50%      4.75%    4.75%       however, remains relatively subdued, as households
                                                      continue to save a higher share of income than was the
                                                      case over the past two decades...The volume of retail
        Apr-10        May-10     Nov-10   Jun-11      sales was flat in the March quarter...”
                                                      RBA Statement on Monetary Policy, May 2011
Source: RBA
30
  The Australian telco market continues to be driven by mobile growth,
  although there are some headwinds
  Australian Telco Market (A$m)

                                               • Economy
                                                   – Consumer confidence
         Mobile              +8.5%             • Competition
                                                   – Aggressive pricing from
                                                      other telcos
                                                   – Prepaid market softness
           Fixed    16,724   -4%     16,020        – New entrants to the
                                                      market

                    CY09              CY10

Source: JP Morgan
31
  Value shift from fixed to mobile expected to continue

     Pre NBN market EBITDA (FY10)                             Future
      Others
                                                        VHA   Mobile continues to be a key source of growth:
       Optus
                                                               Strong device take-up
                                                               Strong ongoing demand expected for data services

     Telstra                                                  However, fixed market still very important:
                                                               Increased market opportunity with NBN
                                                               Emerging value of convergence to customers
                                                               NBN expected to have substantial fixed market
                                       Fixed   Mobile              share in medium to long term

Source: Carrier results, Optus analysis.
32
Focus on building mobile market share while exploiting the NBN

                  FY11-FY12                  FY2012+
                 Drive to leadership     Exploit NBN and IP
              in Customer Experience     to cement leadership
                and leverage digital        via wireless-led
                capabilities to drive         convergence
                lower cost structure
33
In FY12 we will focus on:

                  MOBILE                          FIXED
         • Break-out in Customer       • Build scale in lead-up to NBN
           Experience                  • Relevant and personalised
         • Device leadership             digital services
         • Relevant and personalised   • Leverage ICT and Cloud
           digital services              capability for corporates
         • Leverage distribution       • Prepare for NBN
         • Network investment
34
We will continue to invest in growth with a lower cost structure

                       CROSS
                                                             LOWER
    FUNCTIONAL
     COST-OUT
                     BUSINESS
                     SYNERGIES
                                       RE-TOOLING             COST
                                                           STRUCTURE
       FY12                                         FY16
35
Guidance in FY12

                    FY12 GUIDANCE
                   Revenue to grow at low single digit level

                   EBITDA to grow at low single-digit level

                   Capital expenditure to be at around A$1.2 billion

                   Free cash flow to be above A$1.0 billion
Brand Video – Smart Safe TVC

36
SingTel Investor Day:
Optus Overview and Strategy
Paul O’Sullivan
Chief Executive, Optus
11 July 2011
You can also read