INVESTOR PRESENTATION - FEBRUARY 2021 - Investor Relations | Sun Communities

Page created by Allen Shaw
 
CONTINUE READING
INVESTOR PRESENTATION - FEBRUARY 2021 - Investor Relations | Sun Communities
JELLYSTONE PARK™ AT LARKSPUR – LARKSPUR, CO

                                 INVESTOR PRESENTATION
                                              FEBRUARY 2021
INVESTOR PRESENTATION - FEBRUARY 2021 - Investor Relations | Sun Communities
FORWARD-LOOKING STATEMENTS
This presentation has been prepared for informational purposes only from information supplied by Sun Communities, Inc., referred to herein as “we,” “our,” “Sun,” and “the
Company,” and from third-party sources indicated herein. Such third-party information has not been independently verified. Sun makes no representation or warranty,
expressed or implied, as to the accuracy or completeness of such information.
This presentation contains various “forward-looking statements” within the meaning of the United States Securities Act of 1933, as amended, and the United States
Securities Exchange Act of 1934, as amended, and we intend that such forward-looking statements will be subject to the safe harbors created thereby. For this purpose,
any statements contained in this presentation that relate to expectations, beliefs, projections, future plans and strategies, trends or prospective events or developments and
similar expressions concerning matters that are not historical facts are deemed to be forward-looking statements. Words such as “forecasts,” “intends,” “intend,” “intended,”
“goal,” “estimate,” “estimates,” “expects,” “expect,” “expected,” “project,” “projected,” “projections,” “plans,” “predicts,” “potential,” “seeks,” “anticipates,” “anticipated,”
“should,” “could,” “may,” “will,” “designed to,” “foreseeable future,” “believe,” “believes,” “scheduled,” “guidance,” “target” and similar expressions are intended to identify
forward-looking statements, although not all forward looking statements contain these words. These forward-looking statements reflect our current views with respect to
future events and financial performance, but involve known and unknown risks and uncertainties, both general and specific to the matters discussed in this presentation.
These risks and uncertainties may cause our actual results to be materially different from any future results expressed or implied by such forward-looking statements. In
addition to the risks disclosed under “Risk Factors” contained in our Annual Report on Form 10-K for the year ended December 31, 2020, and our other filings with the
Securities and Exchange Commission from time to time, such risks and uncertainties include but are not limited to:
   outbreaks of disease, including the COVID-19 pandemic, and related stay-at-home orders, quarantine policies and restrictions on travel, trade and business operations;
   changes in general economic conditions, the real estate industry, and the markets within which we operate;
   difficulties in our ability to evaluate, finance, complete and integrate acquisitions, developments and expansions successfully;
   our liquidity and refinancing demands;
   our ability to obtain or refinance maturing debt;
   our ability to maintain compliance with covenants contained in our debt facilities;
   availability of capital;
   changes in foreign currency exchange rates, including between the U.S. dollar and each of the Canadian dollar and the Australian dollar;
   our ability to maintain rental rates and occupancy levels;
   our ability to maintain effective internal control over financial reporting and disclosure controls and procedures;
   increases in interest rates and operating costs, including insurance premiums and real property taxes;
   risks related to natural disasters such as hurricanes, earthquakes, floods and wildfires;
   general volatility of the capital markets and the market price of shares of our capital stock;
   our ability to maintain our status as a REIT;
   changes in real estate and zoning laws and regulations;
   legislative or regulatory changes, including changes to laws governing the taxation of REITs;
   litigation, judgments or settlements;
   competitive market forces;
   the ability of purchasers of manufactured homes and boats to obtain financing; and
   the level of repossessions by manufactured home and boat lenders.
Readers are cautioned not to place undue reliance on these forward-looking statements, which speak only as of the date the statement was made. We undertake no
obligation to publicly update or revise any forward-looking statements included in this presentation, whether as a result of new information, future events, changes in our
expectations or otherwise, except as required by law. Although we believe that the expectations reflected in the forward-looking statements are reasonable, we cannot
guarantee future results, levels of activity, performance or achievements. All written and oral forward-looking statements attributable to us or persons acting on our behalf
are qualified in their entirety by these cautionary statements.

                                                                                                                                                                                    2
INVESTOR PRESENTATION - FEBRUARY 2021 - Investor Relations | Sun Communities
COMPANY HIGHLIGHTS
   Leading owner and operator of manufactured housing
  (“MH”) communities, recreational vehicle (“RV”) resorts,
                       and marinas

                 Favorable demand drivers combined
                       with supply constraints

             Consistent organic growth enhanced with
               embedded expansion opportunities

                                                                                                                                                     PALM CREEK RESORT & RESIDENCES – CASA GRANDE, AZ

               Industry consolidator with proven value
                      creation from acquisitions

  Cycle-tested growth driven by attractive value proposition
             to residents, members, and guests

            Focus on exceptional service supported by
                     culture of accountability

     Proven executive management team with over 100                                                                     EAST FORK CROSSING – BATAVIA, OH
          combined years of industry experience                                                                                                                                       CAPE HARBOUR – CAPE CORAL, FL

     Source: Company information. Refer to Sun Communities, Inc. Form 10-K and Supplemental for the year ended December 31, 2020 as well as Press Releases and SEC Filings after December 31, 2020 for additional information.   3
INVESTOR PRESENTATION - FEBRUARY 2021 - Investor Relations | Sun Communities
SUN COMMUNITIES, INC. OVERVIEW (NYSE: SUI)
 Current Portfolio
 as of December 31, 2020

                                                                                                                                                           552 properties across
                                                                                                                                                               39 states and
                                                                                                                                                             Ontario, Canada

                                                                                                                                                              Indicative Annual Rental Revenue(2)

                                                                                                                                                                                                 RV
                                                                                                                                                                                                 26%

                                                                                                                                                                                                              Marinas
                                                                                                                                                                                                               17%
                                                                                                                                                                          Manufactured
 Property Count                                                              Hybrid MH & RV                                                                                 Housing
                                                                                                                          (1)
                                                                                                                                                                             57%
   MH Communities                                          RV Resorts                       Marinas(1)
   276                                                      136                          34 106

        Source: Company information. Refer to Sun Communities, Inc. Form 10-K and Supplemental for the year ended December 31, 2020 as well as Press Releases and SEC Filings after December 31, 2020 for additional information. Refer to
        information regarding non-GAAP financial measures in the attached Appendix.
        (1)   Does not include five marinas managed for third parties.
        (2)   Company estimates based on full year audited statements regarding MH and RV and internal statements for marina storage revenue.                                                                                                4
INVESTOR PRESENTATION - FEBRUARY 2021 - Investor Relations | Sun Communities
2020 BUSINESS UPDATE
                                                                                                                                    MAJESTIC OAKS – ZEPHYRHILLS, FL
                  PORTFOLIO PERFORMANCE

         3.8% Weighted average monthly rental rate increase
            96.6% MH Occupancy and 2,505 RPS Gains

         Over 300 Expansion site deliveries in 8 properties
 MH & RV rent collections were over                      96% and 97%, respectively(1)

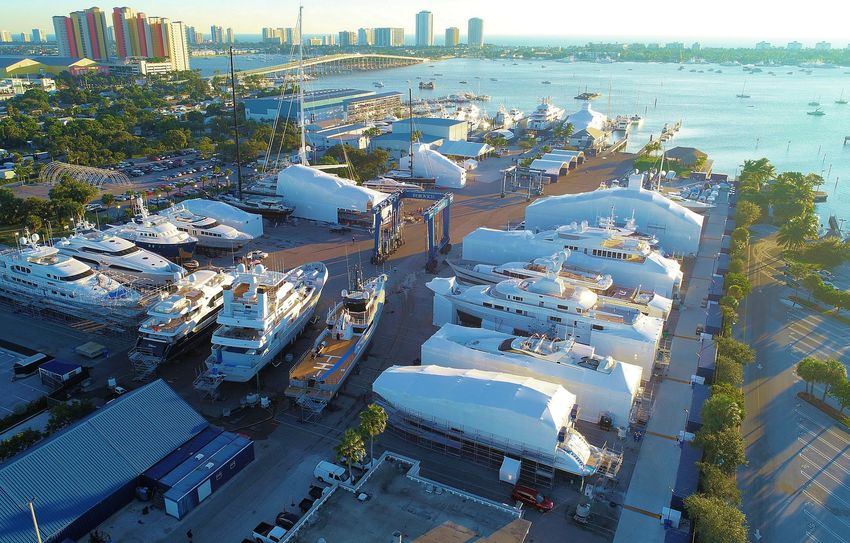
                             EXTERNAL GROWTH                                                                                        WEST PALM BEACH – WEST PALM BEACH, FL

  ~$3bn investments in 24 MH and RV properties and 106 marinas
         ~45,800 sites, slips and dry storage spaces added
                                        through acquisitions

     Over 1,000 ground-up and redevelopment site deliveries
         Closed two equity offerings totaling                           over $1.9bn

       Source: Company information. Refer to Sun Communities, Inc. Form 10-K and Supplemental for the year ended December 31, 2020 as well as Press Releases and SEC Filings after December 31, 2020 for additional information. Refer to
       information regarding non-GAAP financial measures in the attached Appendix.
       1) MH and annual RV rent collections adjust for the impact of COVID-19 related hardship deferrals and prepaid rent balances.                                                                                                         5
INVESTOR PRESENTATION - FEBRUARY 2021 - Investor Relations | Sun Communities
2021 FINANCIAL AND OPERATING GUIDANCE(1)
Earnings and Core FFO                                                                                                                Additional Information – MH & RV Portfolio
                                                                                                          Net Income                                                                                                                   2021E
 Weighted average common shares outstanding (in millions)                                                     106.9                    Increase in revenue producing sites                                                       2,150 – 2,350
 First quarter 2021, basic earnings per share                                                            $0.08 - $0.12                 Vacant ground-up & expansion site deliveries                                              1,200 – 1,600
 Full year 2021, basic earnings per share                                                                $1.66 - $1.82
                                                                                                          Core FFO(2)                  MH weighted average monthly rent increase                                                        3.2%
Weighted average common shares outstanding, fully diluted (in mm)                                              112.7                   RV weighted average monthly rent increase                                                        4.3%
First quarter 2021, Core FFO per Share                                                                   $1.13 - $1.17                 Blended weighted average monthly rent increase                                                   3.4%
Full year 2021, Core FFO per Share                                                                       $5.79 - $5.95

                                               1Q21                  2Q21                  3Q21                  4Q21                  New home sales volume                                                                        550 - 650

Seasonality of Core FFO(2)                    19.6%                 26.2%                  32.8%                 21.4%                 Pre-owned home sales volume                                                                2,400 - 2,600

Total MH & RV Portfolio
                                                                                                                                                                                    CAVA ROBLES RV RESORT – PASO ROBLES, CA
Number of Properties: 446                                        2020 Actual (in mm) 2021E Change %

 Income from real property                                                 $1,002.4                   10.9% - 11.4%

 Total property operating expense                                           $367.3                    13.7% - 14.4%

 Net operating income                                                       $635.1                     8.8% - 10.1%

Same Community - Number of MH & RV Properties: 407                                                  2021E Change %

 Net operating income                                                                                    5.6% - 6.6%

Safe Harbor Marinas
 Net operating income (in mm)                                                                        $163.0 - $169.0
                                                             1Q21              2Q21               3Q21             4Q21
Seasonality of NOI                                          18.0%              29.0%             28.6%             24.4%

           Source: Company information. Refer to Sun Communities, Inc. Form 10-K and Supplemental for the year ended December 31, 2020 as well as Press Releases and SEC Filings after December 31, 2020 for additional information. Refer to
           information regarding non-GAAP financial measures in the attached Appendix.
           Note: The estimates and assumptions presented on this page represent a range of possible outcomes and may differ materially from actual results. Guidance estimates include acquisitions completed through February 18, 2021 and exclude
           any prospective acquisitions or capital markets activity. The estimates and assumptions are forward looking based on the Company’s current assessment of economic and market conditions, as well as other risks outlined above under the
           caption “Forward Looking Statements.”
           1)     Refer to Supplemental for the year ended December 31, 2020 for additional information.
           2)     Certain securities that are dilutive to the computation of Core FFO per fully diluted share in the table above have been excluded from the computation of net income per fully diluted share, as inclusion of these securities would have been
                                                                                                                                                                                                                                                                   6
                  anti-dilutive to net income per fully diluted share.
INVESTOR PRESENTATION - FEBRUARY 2021 - Investor Relations | Sun Communities
POWERING SUN’S GROWTH ENGINE - INTERNAL
   Sun is the premier owner and operator of MH and RV communities
   Strong cycle-tested record of operating, expanding and acquiring MH and RV communities dating back to 1975

                                                                                        INTERNAL LEVERS

                    Contractual Rent Increases                                                                                                           MH Occupancy Gains

                                                                                                                                                                      96.6%
                                   Annual historical                                                                                                      4Q 2020 MH Occupancy

                                    2% - 4%                                                                                                                              76%
               weighted average monthly rental
                                                                                                                                                      of MH communities at 98%+
    rate increase supported by continual reinvestment into
                          properties
                                                                                                                                                                  200bps+
                                                                                                                                                    existing MH occupancy upside

                                     Expansions                                                                                                Transient RV Site Conversions

                                  Over 300                                                                                                                         ~25,000
                          2020 vacant site deliveries                                                                                                    Current transient RV sites

                                      ~7,600                                                                                                                         ~1,000
       sites available for expansion 2021 and beyond                                                                                              average yearly converted sites(1)

                  Target 12% – 14%                                                                                                                           40% – 60%
                                  expansion           IRRs(2)                                                                                1st year revenue uplift once converted
         Source: Company information. Refer to Sun Communities, Inc. Form 10-K and Supplemental for the year ended December 31, 2020 as well as Press Releases and SEC Filings after December 31, 2020 for additional information. Refer to
         information regarding non-GAAP financial measures in the attached Appendix.
         (1)   2018-2020 average.
         (2)   Expected 5-year unlevered internal rates of return based on certain assumptions.                                                                                                                                               7
INVESTOR PRESENTATION - FEBRUARY 2021 - Investor Relations | Sun Communities
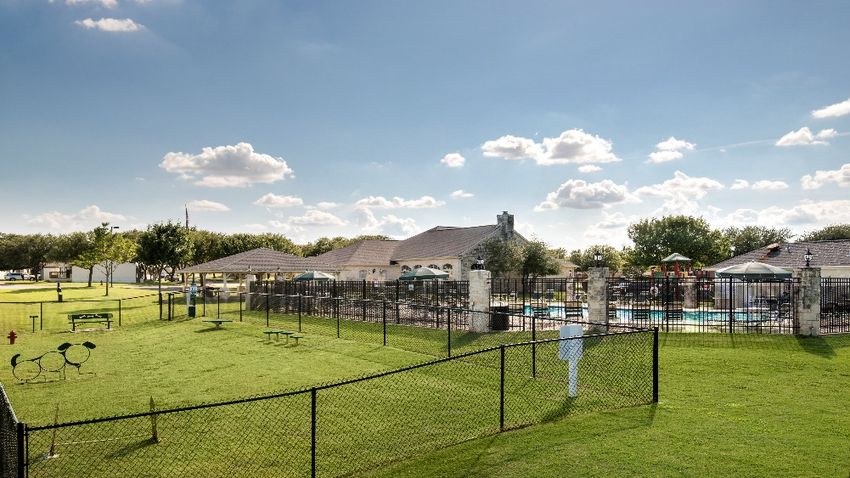
POWERING SUN’S GROWTH ENGINE - EXTERNAL
                                                                                         EXTERNAL LEVERS

                                        Acquisitions                                                                                                                 Development

                               ~$3bn investment                                                                                                           Targeting 2 - 4
     in 24 MH and RV properties and 106 marinas in 2020                                                                                         new development project starts / year

                             4.1x increase                                                                                                              Target 7% – 9%
                     in properties since year end 2010                                                                                                ground-up development IRRs(1)

  High degree of visibility into MH, RV and Marina acquisition
         pipeline with additional opportunities arising
                                                                                                                                                                Over 1,000
                                                                                                                                        2020 ground-up site deliveries in 5 properties
VENTURA ISLE – VENTURA, CA                                                                                             SMITH
                                                                                                                       OCEANCREEK CROSSING
                                                                                                                             BREEZE        – GRANBY,
                                                                                                                                    – MARATHON, FL   CO

          Source: Company information. Refer to Sun Communities, Inc. Form 10-K and Supplemental for the year ended December 31, 2020 as well as Press Releases and SEC Filings after December 31, 2020 for additional information. Refer to
          information regarding non-GAAP financial measures in the attached Appendix.
          (1)   Expected 5-year unlevered internal rates of return based on certain assumptions.                                                                                                                                               8
INVESTOR PRESENTATION - FEBRUARY 2021 - Investor Relations | Sun Communities
2020 ACQUISITION & DEVELOPMENT ACTIVITY
Investment Activity Summary

                  Acquisitions                                                   Ground-up & Redevelopments                                                                                  Expansions
 JELLYSTONE ISLAND
ASSOCIATION  NATURAL BRIDGE
                   KOA      – NATURAL
                       – HENDERSON, NYBRIDGE, VA                               RIVER RUN PINES
                                                                               CAROLINA  RV RESORT  – GRANBY,
                                                                                               – CONWAY, SC CO                                                      SHADOW
                                                                                                                                                                    INDIAN  WOOD
                                                                                                                                                                           WELLS  VILLAGE
                                                                                                                                                                                 RV       – HUDSON,
                                                                                                                                                                                    RESORT– INDIO, CAFL
 ACQUIREDIN
ACQUIRED  INJANUARY
             FEBRUARY 2020
                    2021                                                       FIRST PHASE OPENED IN JULY 2019 2                                                    OPENED IN SEPTEMBER 2019

     ~$3bn purchase price                                                                      $172mm spend                                                                           $72mm spend

        ~45,800 sites added                                                       Over 1,000 site deliveries                                                             Over 300 site deliveries
 in 130 properties & marinas                                                           in 5 properties                                                                       in 8 properties

    Robust pipeline of small                                                                ~2,400 sites available                                                               ~7,600 sites available
   portfolios and single assets                                                                for ground-up &                                                                        for expansion
          in underwriting                                                                     redevelopments                                                                      in 2021 and beyond

             Source: Company information. Refer to Sun Communities, Inc. Form 10-K and Supplemental for the year ended December 31, 2020 as well as Press Releases and SEC Filings after December 31, 2020 for additional information. Refer to
             information regarding non-GAAP financial measures in the attached Appendix.                                                                                                                                                          9
INVESTOR PRESENTATION - FEBRUARY 2021 - Investor Relations | Sun Communities
SUN’S FAVORABLE REVENUE DRIVERS
     Yearly home move-outs in Sun’s MH communities are less than 1%
                                                                                                                            (1)
     Tenure of residents in Sun’s MH communities is over 14                                                                      years
                                                                                                  (1)
     RVs stay in our resorts for approximately 11                                                      years
MH Resident Move-out Trends                                                                                                             CROSSROADS – AIKEN, SC
                                                                                                                                                                                 MAJESTIC OAKS – ZEPHYRHILLS, FL
(3 Year Average)

          (Home stays in community)                              (Home leaves community)

RV Guest Move-out Trends                                                                                                                GROVES RV RESORT – FT. MYERS,
                                                                                                                                                     HOMOSASSA   RIVERFL– HOMOSASSA SPRINGS, FL
    (3 Year Average)

             (RV stays in resort)                                     (RV leaves resort)

            Source: Company information. Refer to Sun Communities, Inc. Form 10-K and Supplemental for the year ended December 31, 2020 as well as Press Releases and SEC Filings after December 31, 2020 for additional information. Refer to
            information regarding non-GAAP financial measures in the attached Appendix.
            (1)   Annual average (2018 - 2020).                                                                                                                                                                                                  10
CONSISTENT AND CYCLE TESTED INTERNAL GROWTH
     Sun’s average same community NOI growth has exceeded REIT industry average by ~210 bps and the
      apartment sector’s average by ~200 bps since 1998

     Since 1998, every individual year or rolling 4-quarter period has had positive same community NOI growth

    Same Community NOI Growth
    Annual Growth Since 1998                                                                                                                      Average Annual Growth Since 1998

                                                                                                                                                           5.1%
                                                                                                                                                                                       SUI:                           SUI:
                                                                                                                                                                                    + ~200bps                      + ~210bps

                                                                                                                                                                                          3.1%                           3.0%

                                                                                                                                                       Sun                            Apartment                  REIT Industry
                                                                                                                                                    Communities                         REITs

          Source: Citi Investment research, September 2020. “REIT Industry Average” includes an index of REITs across a variety of asset classes including: self storage; mixed office; regional malls; shopping centers; apartments; student housing;
          manufactured homes and specialty. Refer to information regarding non-GAAP financial measures in the attached Appendix.                                                                                                                         11
RENTING - MH VS. OTHER RENTAL OPTIONS
    Manufactured homes in Sun’s communities provide 25% more space at ~52% less cost per square foot

    Manufactured Homes in                                                                                                                                Other Rental
    Sun’s Communities(1)                                                                                                                                 Options(2)

                                                                                                                 PRICE

           $0.83 per sq. ft.
                                                                                                                                                               $1.74 per sq. ft.
                                                                                                      SQUARE FOOTAGE

               1,250 sq. ft.
                                                                                                                                                               1,000 sq. ft.

                                                                                                                  RENT

        $1,042 per month
                                                                                                                                                             $1,740 per month

         (1)   Company information.
         (2)   Zillow – U.S. Median Monthly Rent (Zillow rent index, December 2020). Includes multifamily, single family and duplex 2-bedroom rentals.                              12
HOMEOWNERSHIP – MH VS. SINGLE FAMILY
   Sun’s communities offer affordable options in attractive locations

                                                     Manufactured Homes                                             Single Family Homes

            Average cost of a new Manufactured Home is                                                                       Average cost of Single Family is $299,415 or
             $81,900 or roughly 2 years median income                                                                          roughly 7 years median income

      $450,000                                       Manufactured Homes                  Portion of purchase price attributable to land                     Single Family Homes

      $400,000

      $350,000

      $300,000

      $250,000                                                                                                                                                                  $299,415
                                                                                                                                                      $293,727     $297,747
                                                                                                       $263,256        $272,454           $278,409
      $200,000                                                                         $249,429
                                                                       $223,085
                       $203,182        $206,560        $207,950
      $150,000

      $100,000                                                                                                                                                                                        Average
                                                                                                                                                                                                     Household
       $50,000                                                                                                                                                                                         Income
                                $63,100         $62,800         $60,500          $62,200         $64,000         $65,300        $68,000           $70,600      $71,900      $78,500        $81,900   $81,900
                                                                                                                                                                                                     ~$44,000(1)
            $-
                         2009            2010            2011            2012            2013            2014            2015              2016         2017         2018        2019

        Source: U.S. Department of Census, Cost & Size Comparisons of New Manufactured & New Single-Family Site-Built Homes (2009-2019)
        (1)   Average of 2020 primary applicant household income for SUI’s manufactured housing communities.                                                                                                       13
EXPANSIONS PROVIDE ATTRACTIVE RETURNS
   Investment in expansion sites boosts growth in highly accretive manner
   Sun expands in communities and resorts with high occupancies and continued strong demand

                    12 – 24 months
    average lease-up for 100-site expansion

                           ~7,600 sites
        available in expansion inventory
                                                                                                                      CIDER MILL CROSSINGS – FENTON, MI

                                                                                                                       BOULDER RIDGE – PFLUGERVILLE, TX

      Target 12% - 14% IRRs(1)

                                Over 300
     2020 vacant expansion site deliveries
                                                                                                                                                                                     SHERKSTON SHORES – SHERKSTON, ON

        Source: Company information. Refer to Sun Communities, Inc. Form 10-K and Supplemental for the year ended December 31, 2020 as well as Press Releases and SEC Filings after December 31, 2020 for additional information. Refer to
        information regarding non-GAAP financial measures in the attached Appendix.
        (1)   Expected 5-year unlevered internal rates of return based on certain assumptions.                                                                                                                                               14
MAXIMIZING VALUE FROM STRATEGIC ACQUISITIONS
      Professional Operational Management                                                                                                   Adding Value with Expansions

           Home Sales & Rental Program                                                                                         Call Center & Digital Marketing Outreach

             Skilled Expense Management                                                                                              Repositioning with Additional Capex

    2020 Year End Properties and Sites
    Since 2010, Sun has acquired communities valued at over $8.5 billion, increasing its number of
     communities by 4.1x                                                                  188,176

                                                                                                                                                                                                 552
                                                                                                                                                                            141,293
                                                                                                                                                           128,454
                                                                                                                          117,376         121,892
                                                                                                                                                                                422
                                                                                                                                                               371
                                                                                                                             341              350
                                                                                                          88,612
                                                                                         79,554
                                                                        69,789
                                                       63,697
                                      54,811                                               217              231
                     47,683                                               188
                                        159              173
                        136

                      2010             2011             2012             2013             2014             2015             2016            2017             2018             2019             2020
                                                                                                   Sites             Properties
         Source: Company information. Refer to Sun Communities, Inc. Form 10-K and Supplemental for the year ended December 31, 2020 as well as Press Releases and SEC Filings after December 31, 2020 for additional
         information. Refer to information regarding non-GAAP financial measures in the attached Appendix.                                                                                                              15
STRATEGIC BALANCE SHEET
      Balance sheet supports growth strategy
      No near-term debt maturities with 3.7% of total debt maturing per year through 2025

    Mortgage Debt Outstanding                                                                                                Mortgage Debt 5-Year Maturity Ladder
    principal amounts in millions                                                                                            amounts in thousands

                                                   Quarter Ended December 31, 2020                                                            Fannie Mae              CMBS           Freddie Mac              Life Companies

                                                 Principal                                 WA
                                               Outstanding
                                                           (1)
                                                                                     Interest Rates                                                                                                   $315,330

                           CMBS                      $267.2                               4.79%
                                                                                                                                                                                 $185,618
                   Fannie Mae                      $1,150.9                               3.23%

              Life Companies                       $1,658.2                               3.99%                                                              $82,155
                                                                                                                                                                                                                            $50,528
                   Freddie Mac                      $368.6                                3.85%                                              $0

                            Total                  $3,444.9                               3.78%                                           2021                 2022                 2023                 2024                 2025

    Net Debt / TTM EBITDA(2)                                                                                                 Net Debt / TEV (4)

                                                                                                                                         33.8%

            7.5x                                                                                         (3)                                                  28.2%
                                                                                                   6.9x                                                                            25.2%
                                 6.3x
                                                       5.6x                                                                                                                                                                 21.4%
                                                                             5.5x                                                                                                                      19.0%

            2016                 2017                  2018                 2019                  2020                                    2016                 2017                 2018                2019                 2020

               Source: Company information. Refer to Sun Communities, Inc. Form 10-K and Supplemental for the year ended December 31, 2020 as well as Press Releases and SEC Filings after December 31, 2020 for additional information. Refer to
               information regarding non-GAAP financial measures in the attached Appendix.
               (1)   Includes premium / discount on debt and financing costs.
               (2)   The debt ratios are calculated using trailing 12 months recurring EBITDA for the period ended December 31, 2020.
               (3)   Includes full debt load of recently completed acquisitions but less than a full year of EBITDA contribution. Proforma leverage with full year EBITDA contribution is in the mid to high 5x net debt to EBITDA.
               (4)   Total Enterprise Value includes common shares outstanding (per Supplemental), Common OP Units, and Preferred OP Units, as converted, outstanding at the end of each respective period.                                         16
SUN COMMUNITIES’ ESG INITIATIVES
     Sun published its 2nd annual ESG report in 2020
     We are committed to sustainable business practices to benefit all stakeholders: team members, residents
      and guests, shareholders and the broader communities where we operate
     We will continue to enhance Sun’s sustainability program through the formal adoption of additional
      environmental policies, establishing a data baseline for utility usage, expanding the ESG team, and
      engaging a consultant for third party certification reporting
ESG Highlights(1)

                Environmental                                                                                 Social                                                                      Governance

                                                                                                                                                                            BoD’s Nominating and Corporate
    95%, or 400+ communities and resorts
                                                                                  Sun Unity social responsibility program                                                   Governance Committee formally
         retrofitted with LED lighting
                                                                                                                                                                              oversees all ESG initiatives

    Replaced 40K+ residential water meters                                       Internal training program, Sun University,                                                      BoD composition is
       with auto read, real time systems                                         offers over 200 courses to team members                                                   38% female and 75% independent

      Invested $35M+ in solar energy                                                                                                                                  Enterprise Risk Management Committee
                                                                                 Launched Diversity, Equity, Inclusion and
 construction projects covering 32 property                                                                                                                            identifies, monitors and mitigates risks
                                                                                            Access Initiative
    locations in California and Arizona                                                                                                                                         across the organization

                                                                                                                                                                                Comprehensive policies and
    Installed smart thermostat technology at                                     SunFit Program promotes team member,
                                                                                                                                                                                     procedures foster
         400+ communities and resorts                                                  resident and guest wellness
                                                                                                                                                                                sound corporate governance

           Source: Company information. Refer to Sun Communities, Inc. Form 10-K and Supplemental for the year ended December 31, 2020 as well as Press Releases and SEC Filings after December 31, 2020 for additional information. Refer to
           information regarding non-GAAP financial measures in the attached Appendix.
           (1)   Performance and initiatives for the 2018 and 2019 reporting years are referenced. Also reference our 2020-2021 ESG Interim Updates.                                                                                            17
STRATEGY-DRIVEN OUTPERFORMANCE
   Sun has significantly outperformed major REIT and broader market indices over the last ten years
2020 Total Return                                                     3-year Total Return

5-year Total Return                                                   10-year Total Return

                                       Sun Communities, Inc. (SUI)   S&P 500                 MSCI US REIT (RMS)
         Source: S&P Global as of December 31, 2020.                                                              18
CONSISTENT NOI GROWTH
   Manufactured housing is one of the most recession-resistant sectors in real estate and has consistently
    outperformed multifamily and most sectors in same community NOI growth since 2000
Indexed NOI Growth

                                                                                                                                                      $253 Sun Communities
                                                                                                                                                      $242 Manufactured Housing

                                                                                                                                                      $228 Self-storage

                                                                                                                                                      $162 Multifamily

                                                                                                                                                      $153 Industrial

                                                                                                                                                      $139 Office
                                                                                                                                                      $131 Shopping Centers

                                                                                                                                                      $116 Mall

                                                                                                                                                YTD

       Source: Citi Investment research, September 2020. Refer to information regarding non-GAAP financial measures in the attached Appendix.                                 19
MARINA & SAFE HARBOR OVERVIEW

                            RIVIERA BEACH – RIVIERA BEACH, FL
ATTRACTIVE INDUSTRY FUNDAMENTALS
                                                                                                  Supportive
       Fragmented Industry                           High Barriers to Entry
                                                                                               Demographic Trends
  Most marinas are owned by small           1                                          The majority of boaters in the United
                                                  Strict Regulatory Environment
   mom-and-pop operators                                                                 States are 55 and older
                                                  Regulatory hurdles continue to
  Significant upside from institutional           limit new marina construction        The aging U.S. population is a
   management and value-add capex                                                        positive trend because boat buyers
                                                  Increased scrutiny, approval
                                                   times and risk of denial              are concentrated in older, wealthier
  The top five operators collectively
                                                                                         demographic groups
   represent approximately 5% of the
   market by marina count                    2                                          Retiring Baby Boomers with
                                                     Scarcity of Available Land          additional leisure time and migration
                                                  Highly limited stock of desirable     to warmer and coastal areas will
                                                   protected waterways                   drive greater demand for boating
                                                  Marina capacity growth is           U.S. Population Above Age 55(1)
                                                   primarily driven by expansions /    (% of Total U.S. Population)
                                                   reconfigurations                    35%
                                             3
                                                          Capital Intensity            33%
                                                  High initial capital investment
                                                                                       30%
                                                  Scale is necessary to spread
                                                   fixed operating costs over a        28%
                                                   larger base
                                                                                       25%
                                                                                             2015       2020          2025   2030

        (1)   Source: U.S. Census Bureau..                                                                                          21
ATTRACTIVE INDUSTRY FUNDAMENTALS                                                                                                                        (CONT’D)
     Fundamentals are strong as a result of the limited supply of new marinas, stable stock of boats and increasing
      vessel size that may require a marina for storage
                                                                                                       Marina Supply
    U.S. Marinas (in 000’s)                                                                    Slow & Steady Decrease
    4.3
    4.0
    3.8
              '04 – '16 CAGR: (0.6%)
    3.5
       2004                              2006                                   2008                                  2010                2012                 2014            2016

                                                                                                         Slip Demand
    U.S. Target Boat Fleet (17’+) (in mm)                                                       Slow & Steady Increase
    6.3
              '04 – '18 CAGR: 0.3%
    6.0
    5.8
    5.5
       2004                         2006                             2008                             2010                       2012            2014            2016          2018

                                                                                                             Boat Size
    U.S. Boat Fleet Sizes (in FT) | ’14 – ’19 CAGR                                            Trending Longer & Wider
                                                                                                                                                                        5.7%

                                                                                                                    0.9%                0.8%            1.7%
              0.8%                            (0.1%)                              0.3%

              17'–                             31'–                               41'–                               51'–               61'–            71'–            80'+
              30'                              40'                                50'                                60'                70'             80'

            Sources: Info-Link, U.S. Coast Guard Recreational Vessel Registration, U.S. Census Bureau and Yachtworld.
            Note: U.S. Coast Guard boat fleet data available since 2004; U.S. marinas data available through 2016 U.S. Census.                                                        22
SAFE HARBOR IS THE BEST MARINA OPERATOR
    Safe Harbor is the largest and most diversified marina owner and operator in the United States

    108                30,000                           9,000                         22                             72%                                  77%                 40,000               8.3
    Owned (1)        Approximate                  Approximate                        States                 of Marinas Located                       of Marinas Owned        Approximate      Years Average
    Marinas           Wet Slips               Dry Storage Spaces(2)                                        in Coastal Markets(3)                        Fee Simple(4)         Members         Member Tenure

Diversified National Geographic Footprint                                                                                                                          Unrivaled Among Competitors
                                                                                                                                                                 Unmatched in scale, portfolio quality
                                                                                                                                                                   and depth of network offering
                                                                                                                                                                        (# of owned marinas – 2/15/2021)

                                                                                                                                                                   108

                                                                                                                                                                              29
                                                                                                                                                                                      25      23

                                                                                                                                                                                                         8

           (1)   As of February 15, 2021, Safe Harbor directly or indirectly owns 108 marinas and manages five marinas on behalf of third parties.
           (2)   Dry Storage Spaces include Indoor Storage.
           (3)   Calculation of marinas located in coastal markets includes those along the Great Lakes.
           (4)   25 currently owned marinas operate with underlying ground leases with a weighted average remaining term of ~29 years.                                                                        23
EXPERIENCED TEAM WITH PROVEN TRACK RECORD
   The Safe Harbor team joined Sun Communities and will continue to drive day-to-day operations and identify future
    marina investment opportunities

                                             Experienced Team of Industry Executives Supported by a Deep Bench

    Operationally-focused                Built regional management and                                    Successfully                                Dedicated M&A team                                 Management equity
       executives with                        business development                                       completed and                                  maintains deep                                  stakes and incentives
      significant marina                  infrastructure with consistent                                   integrated                                      pipeline of                                 align management with
     industry experience                operational strategy and approach                               108 acquisitions                               acquisition targets                                Sun shareholders

                                                         Baxter Underwood
                                                        Chief Executive Officer
                                              Prior experience acquiring and managing                                        Executive Leadership with
                                                           lifestyle assets
                                                                                                                               Safe Harbor Platform
                                               Former CIO of CNL Lifestyle Properties                                           from the Beginning
                                                  Former Partner at Clapham Capital

                   Growth                                                                                 Execution                                                                                   Control

 Acquisitions                                                                                   Chief Operating Officer                                                     Operational improvement
 Systems, data management,                                                                                                                                                  Internal legal and audit
  integrations and training                                                                  14 Regional Vice Presidents                                                     Treasury, accounting, FP&A and
 Hospitality, marketing and partnerships                                                                                                                                     capital management
                                                                                                                                                                             Risk and compliance
                                                                                      ~1,600 Property-level Team Members
                                                                                                                                                                             Human resources

           Source: Company information. Refer to Sun Communities, Inc. Form 10-K and Supplemental for the year ended December 31, 2020 as well as Press Releases and SEC Filings after December 31, 2020 for additional information. Refer to
           information regarding non-GAAP financial measures in the attached Appendix.                                                                                                                                                          24
MARINA SECTOR PIONEER AND CONSOLIDATOR
 Safe Harbor Portfolio Evolution

                                                                                                                                                                              108

                                                                                                                                                       (1)
 Key Transactions(2)
 1                            2                               3                             4                    5                    6                      7                    8

       Flagship                            CNL                           Brewer                     OPC               Charleston            Newport                  Tri-W              Rybovich

       3Q 2015                        2Q 2016                          1Q 2017                    1Q 2018              4Q 2018              4Q 2019                3Q 2020              4Q 2020
     Date Acquired                  Date Acquired                   Date Acquired               Date Acquired        Date Acquired        Date Acquired          Date Acquired        Date Acquired

               7                             15                              26                       3                    3                    2                      5                    2
        Marinas                          Marinas                         Marinas                   Marinas              Marinas              Marinas                Marinas              Marinas

        4,717                            7,134                            7,411                     660                  401                  329                   2,251                  78
        Slips / Dry                  Slips / Dry                      Slips / Dry                  Slips / Dry          Slips / Dry          Slips / Dry            Slips / Dry          Slips / Dry
     Storage Spaces               Storage Spaces                   Storage Spaces               Storage Spaces       Storage Spaces       Storage Spaces         Storage Spaces       Storage Spaces

         (1)       Dry Storage Spaces include Indoor Storage.
         (2)       Date acquired reflects period in which last marina acquisition closed.                                                                                                              25
APPENDIX

           RIPTIDE RV RESORT & MARINA– KEY LARGO, FL
NON-GAAP TERMS DEFINED
Investors in and analysts following the real estate industry utilize funds from operations (“FFO”), net operating income (“NOI”), and earnings before interest, tax, depreciation and amortization (“EBITDA”) as
supplemental performance measures. The Company believes that FFO, NOI, and EBITDA are appropriate measures given their wide use by and relevance to investors and analysts. Additionally, FFO, NOI,
and EBITDA are commonly used in various ratios, pricing multiples, yields and returns and valuation calculations used to measure financial position, performance and value.

FFO, reflecting the assumption that real estate values rise or fall with market conditions, principally adjusts for the effects of generally accepted accounting principles (“GAAP”) depreciation and amortization of
real estate assets.
NOI provides a measure of rental operations that does not factor in depreciation, amortization and non-property specific expenses such as general and administrative expenses. EBITDA provides a further
measure to evaluate ability to incur and service debt and to fund dividends and other cash needs.

FFO is defined by the National Association of Real Estate Investment Trusts (“NAREIT”) as GAAP net income (loss), excluding gains (or losses) from sales of depreciable operating property, plus real estate-
related depreciation and amortization, real estate related impairments, and after adjustments for unconsolidated partnerships and joint ventures. FFO is a non-GAAP financial measure that management
believes is a useful supplemental measure of the Company’s operating performance. By excluding gains and losses related to sales of previously depreciated operating real estate assets, impairment and
excluding real estate asset depreciation and amortization (which can vary among owners of identical assets in similar condition based on historical cost accounting and useful life estimates), FFO provides a
performance measure that, when compared period-over-period, reflects the impact to operations from trends in occupancy rates, rental rates, and operating costs, providing perspective not readily apparent from
GAAP net income (loss). Management believes the use of FFO has been beneficial in improving the understanding of operating results of REITs among the investing public and making comparisons of REIT
operating results more meaningful. The Company also uses FFO excluding certain gain and loss items that management considers unrelated to the operational and financial performance of our core business
(“Core FFO”). The Company believes that Core FFO provides enhanced comparability for investor evaluations of period-over-period results.

The Company believes that GAAP net income (loss) is the most directly comparable measure to FFO. The principal limitation of FFO is that it does not replace GAAP net income (loss) as a performance
measure or GAAP cash flow from operations as a liquidity measure. Because FFO excludes significant economic components of GAAP net income (loss) including depreciation and amortization, FFO should be
used as a supplement to GAAP net income (loss) and not as an alternative to it. Further, FFO is not intended as a measure of a REIT’s ability to meet debt principal repayments and other cash requirements,
nor as a measure of working capital. FFO is calculated in accordance with the Company’s interpretation of standards established by NAREIT, which may not be comparable to FFO reported by other REITs that
interpret the NAREIT definition differently.

NOI is derived from revenues minus property operating expenses and real estate taxes. NOI is a non-GAAP financial measure that the Company believes is helpful to investors as a supplemental measure of
operating performance because it is an indicator of the return on property investment and provides a method of comparing property performance over time. The Company uses NOI as a key measure when
evaluating performance and growth of particular properties and/or groups of properties. The principal limitation of NOI is that it excludes depreciation, amortization, interest expense and non-property specific
expenses such as general and administrative expenses, all of which are significant costs. Therefore, NOI is a measure of the operating performance of the properties of the Company rather than of the
Company overall.

The Company believes that GAAP net income (loss) is the most directly comparable measure to NOI. NOI should not be considered to be an alternative to GAAP net income (loss) as an indication of the
Company’s financial performance or GAAP cash flow from operating activities as a measure of the Company’s liquidity; nor is it indicative of funds available for the Company’s cash needs, including its ability to
make cash distributions. Because of the inclusion of items such as interest, depreciation, and amortization, the use of GAAP net income (loss) as a performance measure is limited as these items may not
accurately reflect the actual change in market value of a property, in the case of depreciation and in the case of interest, may not necessarily be linked to the operating performance of a real estate asset, as it is
often incurred at a parent company level and not at a property level.

EBITDA as defined by NAREIT (referred to as “EBITDAre”) is calculated as GAAP net income (loss), plus interest expense, plus income tax expense, plus depreciation and amortization, plus or minus losses or
gains on the disposition of depreciated property (including losses or gains on change of control), plus impairment write-downs of depreciated property and of investments in unconsolidated affiliates caused by a
decrease in value of depreciated property in the affiliate, and adjustments to reflect the entity’s share of EBITDAre of unconsolidated affiliates. EBITDAre is a non-GAAP financial measure that the Company
uses to evaluate its ability to incur and service debt, fund dividends and other cash needs and cover fixed costs. Investors utilize EBITDAre as a supplemental measure to evaluate and compare investment
quality and enterprise value of REITs. The Company also uses EBITDAre excluding certain gain and loss items that management considers unrelated to measurement of the Company’s performance on a basis
that is independent of capital structure (“Recurring EBITDA”).

The Company believes that GAAP net income (loss) is the most directly comparable measure to EBITDAre. EBITDAre is not intended to be used as a measure of the Company’s cash generated by operations
or its dividend-paying capacity and should therefore not replace GAAP net income (loss) as an indication of the Company’s financial performance or GAAP cash flow from operating, investing and financing
activities as measures of liquidity.

                                                                                                                                                                                                                           27
NET INCOME TO FFO RECONCILIATION
                                                                                                            Three Months Ended December 31,                                               Year Ended December 31,
(amounts in thousands except per share data)
                                                                                                                     2020                          2019                         2020                       2019                       2018
 Net Income attributable to Sun Communities, Inc. common stockholders                                        $           7,586             $          28,547             $       131,614            $       160,265            $       105,493
 Adjustments
    Depreciation and amortization                                                                                        117,354                        98,950                     376,897                    328,646                    288,206
    Depreciation on nonconsolidated affiliates                                                                                 38                          -                             66                       -                          -
    (Gain) / loss on remeasurement of marketable securities                                                               (8,765)                      (17,692)                     (6,129)                   (34,240)                     3,639
    Loss on remeasurement of investment in nonconolidated affiliates                                                         103                           -                         1,608                        -                          -
    Loss on remeasurement of notes receivable                                                                                964                           -                         3,275                        -                          -
    Income to noncontrolling interests                                                                                          4                          482                       7,881                      8,474                      7,740
    Preferred return to preferred OP units                                                                                   494                           519                       2,231                      2,610                      2,206
    Preferred distribution to Series A-4 preferred stock                                                                     -                             -                           -                        1,288                      1,737
    Gain on disposition of properties                                                                                        -                             -                        (5,595)                       -                          -
    Gain on disposition of assets, net                                                                                    (6,929)                       (5,273)                    (22,180)                   (26,356)                   (23,406)
 FFO Attributable To Sun Communities, Inc. Common Stockholders And
 Dilutive Convertible Securities                                                                                         110,849                      105,533                      489,668                    440,687                    385,615

 Adjustments
    Business combination expense                                                                                           23,008                           -                       23,008                        -                             -
    Other acquisition related costs                                                                                         1,035                           244                      2,326                      1,146                         1,001
    Loss on extinguishment of debt                                                                                            -                           3,027                      5,209                     16,505                         1,190
    Catastrophic weather related charges, net                                                                                 831                           398                        885                      1,737                             92
    Loss of earnings - catastrophic weather related                                                                           -                             -                          -                          -                            (292)
    (Gain) / loss on foreign currency translation                                                                         (10,480)                       (4,522)                    (8,039)                    (4,557)                        8,234
    Other (income) / expense, net                                                                                             390                          (424)                     3,768                      1,100                        (1,781)
    Other adjustments                                                                                                        (761)                          278                     (1,265)                       314                           310
 Core FFO Attributable To Sun Communities, Inc. Common Stockholders
 And Dilutive Convertible Securities                                                                         $           124,872           $          104,534            $         515,560          $         456,932          $         394,369
    Weighted average common shares outstanding - basic                                                                   104,275                       91,342                       97,521                     88,460                     81,387
    Weighted average common shares outstanding - fully diluted                                                           108,038                       95,463                      101,342                     92,817                     86,141
 FFO Attributable To Sun Communities, Inc. Common Stockholders And
 Dilutive Convertible Securities Per Share - Fully Diluted                                                   $                1.03         $                1.11         $              4.83        $              4.75        $              4.48
 Core FFO Attributable To Sun Communities, Inc. Common Stockholders
 And Dilutive Convertible Securities Per Share - Fully Diluted                                               $                1.16         $                1.10         $              5.09        $              4.92        $              4.58

                 Source: Company information. Refer to Sun Communities, Inc. Form 10-K and Supplemental for the year ended December 31, 2020 as well as Press Releases and SEC Filings after December 31, 2020 for additional information.             28
NET INCOME TO NOI RECONCILIATION
                                                                                                   Three Months Ended December 31,                                                Year Ended December 31,
 (amounts in thousands)                                                                                      2020                          2019                        2020                       2019                        2018
Net Income Attributable to Sun Communities, Inc., Common
Stockholders                                                                                         $             7,586           $           28,547            $        131,614           $        160,265           $        105,493
 Interest income                                                                                                  (2,510)                      (3,368)                    (10,119)                   (17,857)                   (20,852)
 Brokerage commissions and other revenues, net                                                                    (4,162)                      (2,937)                    (17,230)                   (14,127)                    (6,205)
 Home selling expenses                                                                                             4,626                        3,768                      15,134                     14,690                     15,722
 General and administrative expenses                                                                              31,795                       25,434                     111,288                     93,964                     81,429
 Catastrophic weather related charges, net                                                                           831                          435                         885                      1,737                          92
 Business combination expense                                                                                     23,008                          -                        23,008                        -                          -
 Depreciation and amortization                                                                                   117,423                       98,826                     376,876                    328,067                    287,262
 Loss on extinguishment of debt                                                                                      -                          3,027                       5,209                     16,505                      1,190
 Interest expense                                                                                                 35,013                       33,259                     129,071                    133,153                    130,556
 Interest on mandatorily redeemable preferred OP units / equity                                                    1,047                        1,207                       4,177                      4,698                      3,694
 (Gain) / loss on remeasurement of marketable securities                                                          (8,765)                     (17,692)                     (6,129)                   (34,240)                     3,639
 (Gain) / loss on foreign currency translation                                                                   (10,480)                      (4,522)                     (8,039)                    (4,557)                     8,234
 Gain on disposition of property                                                                                     -                            -                        (5,595)                       -                          -
 Other (income) / expense, net                                                                                       390                         (424)                      3,768                      1,100                     (1,781)
 Loss on remeasurement of notes receivable                                                                           964                          -                         3,275                        -                          -
 Loss / (income) from nonconsolidated affiliates                                                                    (392)                           6                      (1,740)                    (1,374)                      (790)
 Loss on remeasurement of investment in nonconsolidated affiliates                                                   103                          -                         1,608                        -                          -
 Current tax expense                                                                                                 328                          189                         790                      1,095                        595
 Deferred tax benefit                                                                                               (761)                        (258)                     (1,565)                      (222)                      (507)
 Preferred return to preferred OP units / equity                                                                   2,136                        1,418                       6,935                      6,058                      4,486
 Income attributable to noncontrolling interests                                                                       96                         720                       8,902                      9,768                      8,443
 Preferred stock distribution                                                                                        -                            -                           -                        1,288                      1,736
   NOI / Gross Profit                                                                                $           198,276           $          167,635            $        772,123           $        700,011           $        622,436

                                                                                                   Three Months Ended December 31,                                                Year Ended December 31,
                                                                                                             2020                          2019                        2020                       2019                        2018
Real Property NOI                                                                                    $         167,840             $         146,106             $      649,233             $      586,649             $       524,178
Home Sales NOI / Gross Profit                                                                                    12,486                       10,944                      43,815                     47,579                      42,698
Rental Program NOI                                                                                               29,101                       26,682                    115,283                    104,382                       95,968
Ancillary NOI / Gross Profit                                                                                      7,973                        1,382                      38,615                     30,206                      25,207
Site rent from Rental Program (included in Real Property NOI)                                                   (19,124)                     (17,479)                    (74,823)                   (68,805)                    (65,615)
   NOI / Gross Profit                                                                                $         198,276             $         167,635             $      772,123             $      700,011             $       622,436

             Source: Company information. Refer to Sun Communities, Inc. Form 10-K and Supplemental for the year ended December 31, 2020 as well as Press Releases and SEC Filings after December 31, 2020 for additional information.     29
NET INCOME TO RECURRING EBITDA RECONCILIATION

                                                                                                        Three Months Ended December 31,                                                  Year Ended December 31,
(amounts in thousands)
                                                                                                                   2020                          2019                         2020                        2019                        2018
Net Income Attributable to Sun Communities, Inc., Common
Stockholders                                                                                              $                7,586         $             28,547           $        131,614            $        160,265            $          105,493
 Adjustments
   Depreciation and amortization                                                                                       117,423                        98,826                     376,876                     328,067                       287,262
   Loss on extinguishment of debt                                                                                          -                           3,027                       5,209                      16,505                         1,190
   Interest expense                                                                                                     35,013                        33,259                     129,071                     133,153                       130,556
   Interest on mandatorily redeemable preferred OP units / equity                                                        1,047                         1,207                       4,177                       4,698                         3,694
   Current tax expense                                                                                                     328                           189                         790                       1,095                           595
   Deferred tax benefit                                                                                                   (761)                         (258)                     (1,565)                       (222)                         (507)
   (Income) / loss from nonconsolidated affiliates                                                                        (392)                            6                      (1,740)                     (1,374)                         (790)
   Less: Gain on disposition of assets, net                                                                             (6,929)                       (5,273)                    (22,180)                    (26,356)                      (23,406)
   Less: Gain on disposition of properties                                                                                 -                             -                        (5,595)                        -                             -
EBITDAre                                                                                                  $            153,315           $           159,530            $        616,657            $        615,831            $          504,087
 Adjustments
  Catastrophic weather related charges, net                                                                                831                           435                         885                       1,737                             92
  Business combination expense                                                                                          23,008                           -                        23,008                         -                             -
  (Gain) / loss on remeasurement of marketable securities                                                               (8,765)                      (17,692)                     (6,129)                    (34,240)                        3,639
  (Gain) / loss on foreign currency translation                                                                        (10,480)                       (4,522)                     (8,039)                     (4,557)                        8,234
  Other (income) / expense, net                                                                                            390                          (424)                      3,768                       1,100                        (1,781)
  Loss on remeasurement of notes receivable                                                                                964                           -                         3,275                         -                             -
  Loss on remeasurement of investment in nonconsolidated affiliates                                                        103                           -                         1,608                         -                             -
  Preferred return to preferred OP units / equity                                                                        2,136                         1,418                       6,935                       6,058                         4,486
  Income attributable to noncontrolling interests                                                                            96                          720                       8,902                       9,768                         8,443
  Preferred stock distribution                                                                                             -                             -                           -                         1,288                         1,736
  Plus: Gain on dispositions of assets, net                                                                              6,929                         5,273                      22,180                      26,356                        23,406
Recurring EBITDA                                                                                          $            168,527           $           144,738            $        673,050            $        623,341            $          552,342

               Source: Company information. Refer to Sun Communities, Inc. Form 10-K and Supplemental for the year ended December 31, 2020 as well as Press Releases and SEC Filings after December 31, 2020 for additional information.         30
You can also read