INVESTOR PRESENTATION - July 2021 - eMarket Storage

Page created by Bertha Terry
 
CONTINUE READING
INVESTOR PRESENTATION - July 2021 - eMarket Storage
INVESTOR
PRESENTATION
   July 2021
INVESTOR PRESENTATION - July 2021 - eMarket Storage
Management team

       Giovanni Costantino                     Filippo Menchelli                Giuseppe Taranto                       Marco Carniani

              Founder &                           Chairman &                     Vice President &
                                                                                                                    Administration Director
        Chief Executive Officer              Chief Financial Officer         Chief Commercial Officer

      25 years of experience as top         18 years of experience as top    25 years of experience as top         12 years of experience as top
                manager                               manager                          manager                               manager
        13 in the yachting industry          9 in the yachting industry        13 in the yachting industry           7 in the yachting industry
     10+ years as General Manager             20+ years experience in       10+ years as General Manager
     of an Italian furniture group listed   accounting and finance across   of an Italian furniture group listed
                 on the NYSE                      various industries                    on the NYSE
     15+ years as an entrepreneur in
       the custom furniture industry

                                                                                                                                                   2
INVESTOR PRESENTATION - July 2021 - eMarket Storage
1
    EQUITY STORY
    HIGHLIGHTS
INVESTOR PRESENTATION - July 2021 - eMarket Storage
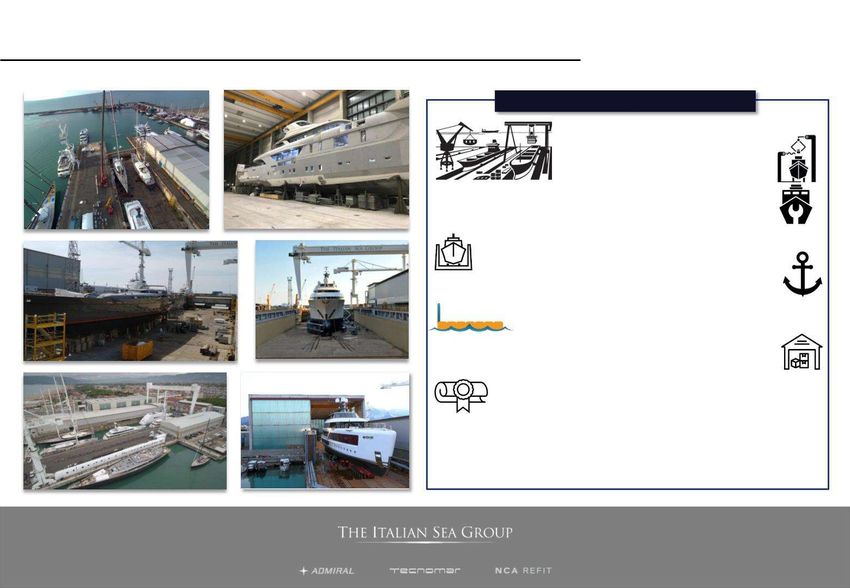
Key pillars of The Italian Sea Group’s equity story

                                 A key player in customised ultra-luxury superyachts and megayachts
                           I

                                     Resilient and unpenetrated customer base, almost immune to economic shocks
                                II

                                             Backlog-based business granting exceptional visibility
                                       III

A unique positioning in                      Superior refitting capabilities and facilities, boosting customer base expansion
the ultra-luxury                       IV
megayachts segment
                                     Strong and continued growth combined with best-in-class profitability, high cash
                                V
                                     generation, and returns on capital

                               Experienced management team able to position The Italian Sea Group in the top
                               market segment
                          VI

                                                                                                                                5
INVESTOR PRESENTATION - July 2021 - eMarket Storage
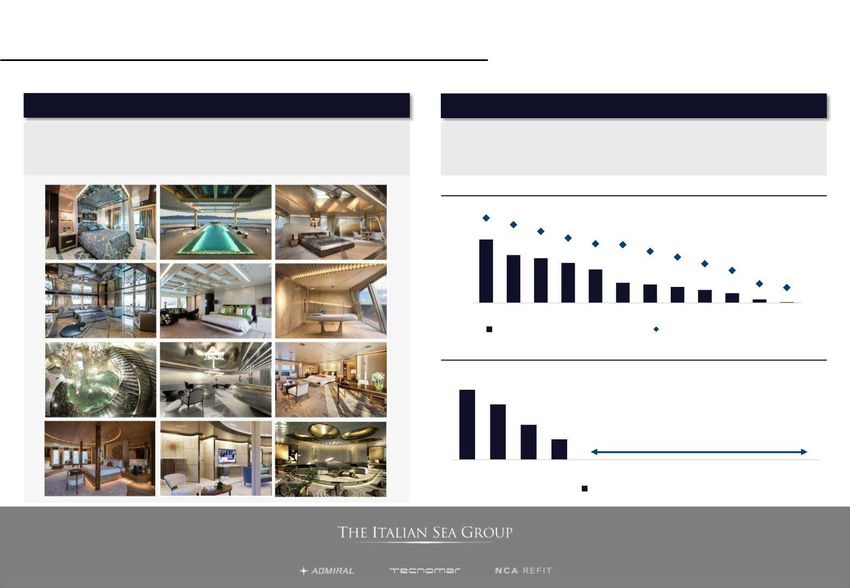
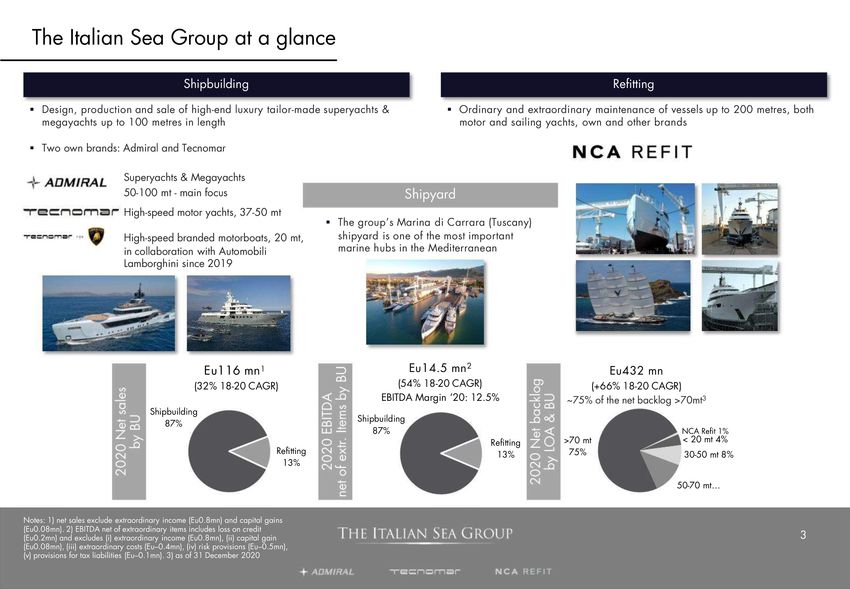
A key player in customised ultra-luxury yachts…
  One of the top players in the high-end luxury yacht industry created through transformational
  investments and revamping of heritage brands

                                                                                                                 Brand

                                                                      Yachts launched                                                      Yachts launched
                                       54                                                                                                                                    33
                               years of activity                 147                     14                     Heritage                  17                289       years of activity
                                                                 overall       since brand acquisition                           since brand acquisition    overall

   (Average # employees)

          18                 22                 25                  28                 138               143               176              178             196        226           247             278

                                                                                                                                                                                                   116.4
  (Net   Sales1   - Eu mn)                                                                                                                                                          100.3
  CAGR 09-20 +15.6%
                                                                                                                                            61.5            65.1      67.2
  CAGR 18-20 +31.7%
                                                                                       49.7              50.4              51.6

         23.6                22.6              23.9                24.2

         2009                2010             2011                 2012               2013            2014                 2015             2016            2017      2018          2019            2020

     Acquisition                            Acquisition          Acquisition           Eu35m                         START refitting          Eu4m                                   START           TISG 4.0
                                                                                  investment in the                                      investments in                            Automobili    transformational
                                                                                     Marina di                                          Steel, Carpentry,                         Lamborghini   project to increase
                                         and FOCUS on                             Carrara shipyard                                         Upholstery                                               production
                                         aluminium alloy                            Rebranding                                             production                                                capacity
                                         and steel mega                                                                                     divisions
                                             yachts

Sources: company information

Note: net sales exclude extraordinary income and capital gains                                                                                                                                             6
INVESTOR PRESENTATION - July 2021 - eMarket Storage
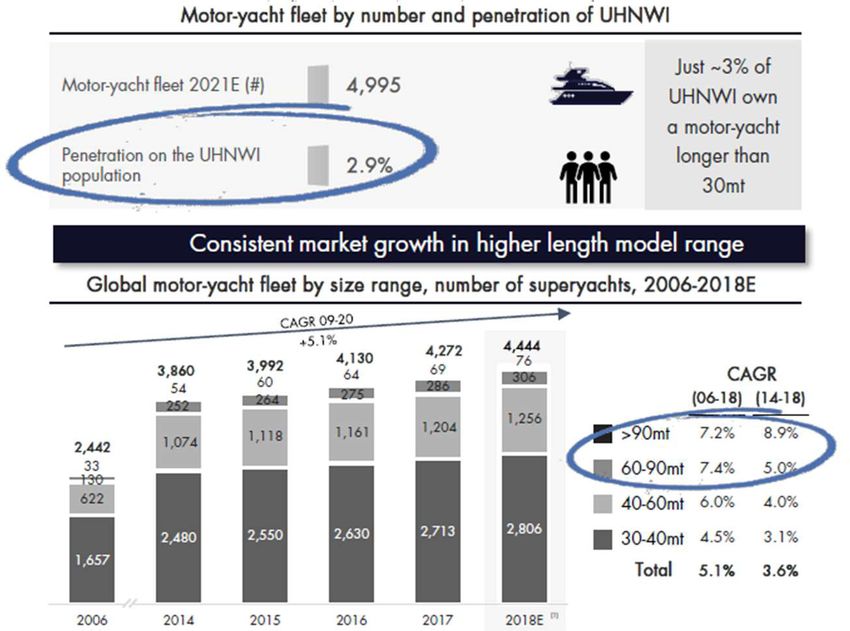
…with prestigious strategic partnerships and collaborations
  Alliances with Automobili Lamborghini, leading international luxury brands and “starchitects”
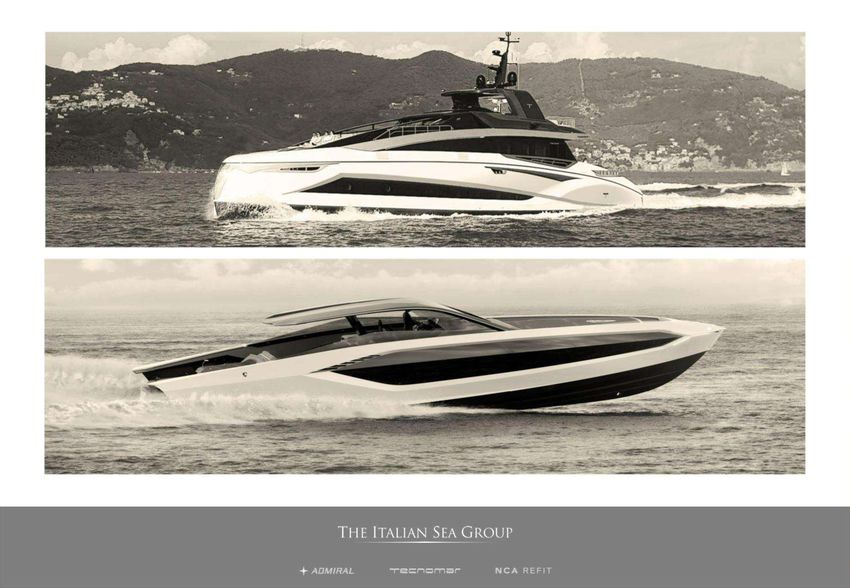
             Exclusive partnership with Automobili Lamborghini to develop its   Exclusive partnership with international top luxury brand: “Giorgio Armani”, for
                          co-branded limited edition high-speed boats                           the co-design of exterior and interior yacht lines

                                                                                                   Collaboration with industry “starchitects”
                  2021+1H22 production capacity already sold

                                                                                 Strong brands are choosing The Italian Sea Group as a partner

Sources: company information, management statements

                                                                                                                                                             7
INVESTOR PRESENTATION - July 2021 - eMarket Storage
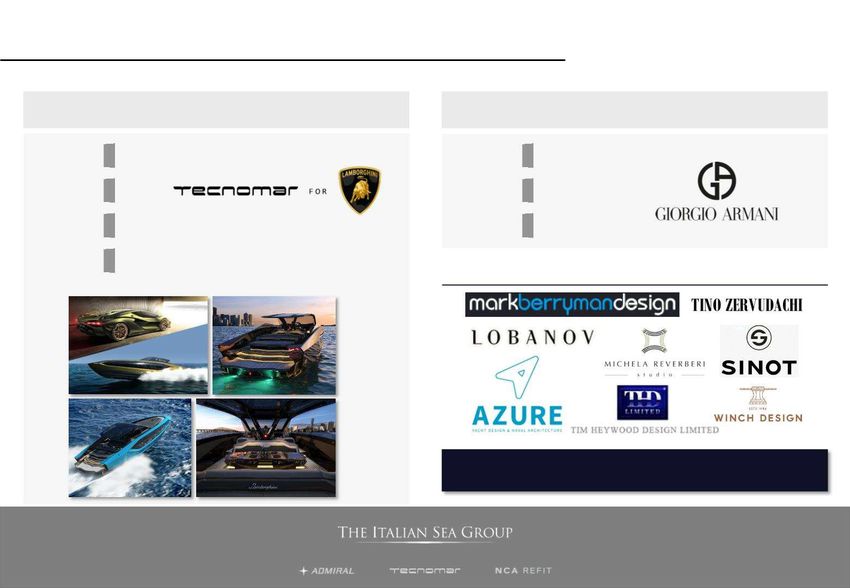
Superior customisation and “Made in Italy” quality

  ~75% of customers rely on the company to assess and design the interior
                         Globally recognised quality and design                              Ever-increasing quality combined with prompt delivery

            Exceptional craftmanship and design and engineering skills for an   Relentlessly improving yard performance, leading to near-to-zero claims, with ever-
                                 ultra luxury yacht with Italian flair                    shortening response times and no delays to deliveries since 2013

                                                                                                        Claims per yacht delivered and time to solve them

                                                                                        89        82
                                                                                                             75
                                                                                                                       68
                                                                                        798                                   62    61
                                                                                                                                          54
                                                                                                  602                                              48
                                                                                                          563                                             41
                                                                                                                    504                                          34
                                                                                                                             421
                                                                                                                                    253   232                            20   16
                                                                                                                                                  201     163    122
                                                                                                                                                                         45   10

                                                                                       2009 2010 2011 2012 2013 2014 2015 2016 2017 2018 2019 2020
                                                                                              Number of claims (average)                         Days to solve claims (average)

                                                                                                   Actual delivery vs. contractually agreed delivery time

                                                                                  24
                                                                                             19

                                                                                                        12
                                                                                                                   7
                                                                                                                                                    ON TIME

                                                                                 2009    2010       2011          2012      2013   2014   2015     2016   2017    2018    2019     2020
                                                                                                                              Average days of delay

Sources: company information, management statements

                                                                                                                                                                                    8
INVESTOR PRESENTATION - July 2021 - eMarket Storage
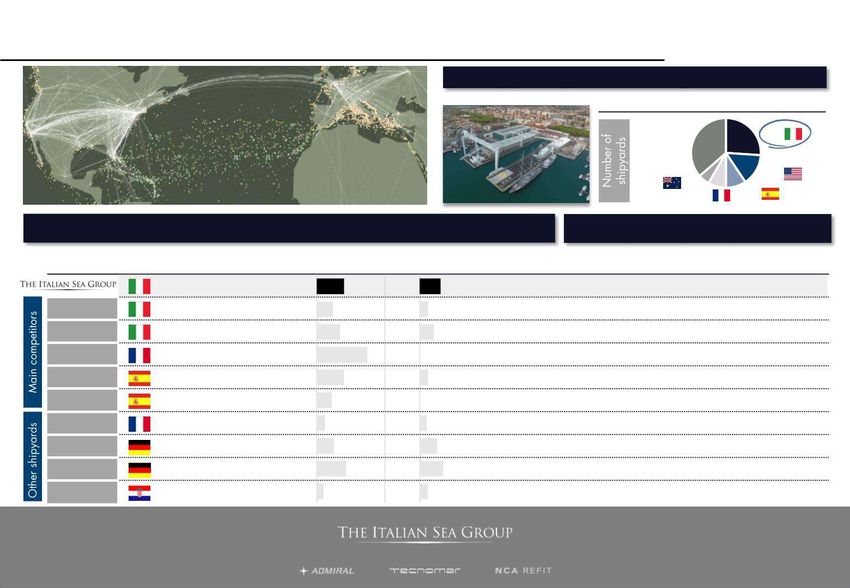
One of the most important marine hubs on the Mediterranean

                                                                        Key Figures

                                                                ~100.000        m2 for production

                                                                                            o/w ~45.000
                                                                                m2 for Shipbuilding activities

                                                                                               o/w ~53.000
                                                                                     m2   for Refitting activities

                                                   200 x 35     mt dry dock

                                                                                   metres of docks     2,000

                                                       100    mt x 3,300 ton floating dock

                                                                                           Sheds   11+ 1

                                                     2043 expiry date of state shipyard concession

                                          TISG 4.0 Increase in production capacity by 40%,
                                          by August 2021

                                                                                                                     9
INVESTOR PRESENTATION - July 2021 - eMarket Storage
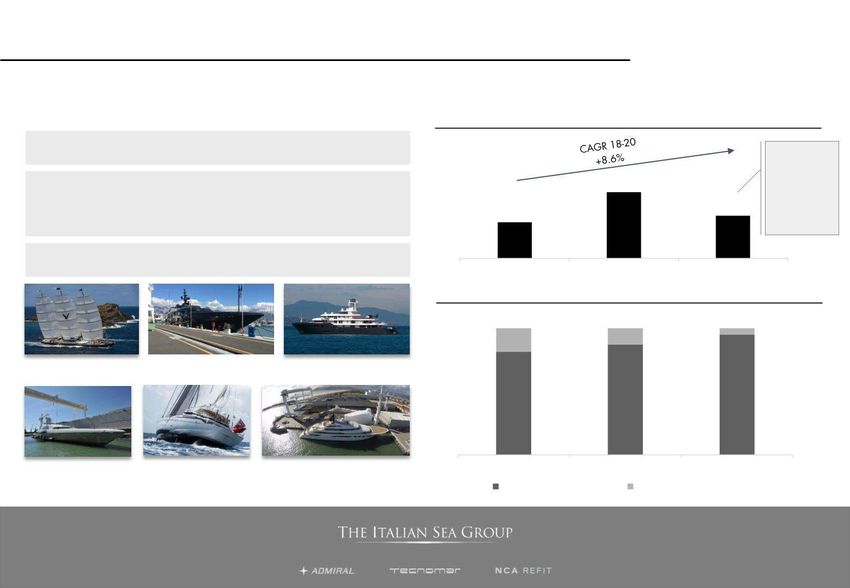
Largely untapped, UHNWI client base immune to economic shock

  Considerable potential upside from even a marginal increase in penetration of highly resilient client
  base
                                Growing UHNWI client base                                                         Largely unpenetrated addressable market

 UHNWI doubled in the last decade and are expected to have dropped just 1.9% in                Luxury yachts represent a tiny fraction of the global luxury market (
Few competitors, mainly located in Northern Europe

  Focus on the less crowded segment

                                                                                        40 Mt.                       80 Mt.                         120 Mt.              180 Mt.

                                                                                40 Mt.                                                  100 Mt.
                                                                                                                                                               Strong focus on
                                                                               37 Mt.                50 Mt.
                                                                                                                                                              megayachts >60mt
                                                                             20 Mt.
      The Italian                                                                                 59 Mt.                                                                                    180 Mt.
      Sea Group
                                                                                40 Mt.                                                           110 Mt.
        direct
      competitors                                                              37 Mt.                                                            110 Mt.
                                                                               37 Mt.                                                           108 Mt.
                                                                                40 Mt.                                                 98 Mt.
                                                                                         49 Mt.                               83 Mt.
                                                                                  42 Mt.                                      83 Mt.
                                                                                  43 Mt.                                     80 Mt.
                                                                       28 Mt.                                       70 Mt.
                                                                    24 Mt.                                      64 Mt.
                                                          13 Mt.                                           55 Mt.
                                                        8 Mt.                                        50 Mt.
                                                             16 Mt.                                48 Mt.
                                                                       28 Mt.                42 Mt.
                                                        10 Mt.                              40 Mt.                                                               The Italian Sea Group
                                                        10 Mt.                           35 Mt.                                                                   The Italian Sea Group focus market

Sources: Superyachts Annual Report 2017, 2018 and 2019, company websites,
Aida BdV, Amadeus BdV
                                                                                                                                                                                              11
Backlog-based business granting exceptional visibility…

  Net backlog growing sharply, now at 3.7x 2020 revenues, with track record of order cancellations
  close to zero
                                                  Order Book1                                                                    Net backlog2

                                                                                  605
 (Eu mn)                                                                                      (Eu mn)

                                                                                                                                                             432

                                                        358                                                                            248
                   240                                                                                         157

                  2018                                  2019                      2020                         2018                    2019

Coverage                                                                                       Coverage
                   3.5x                                 3.6x                      5.2x                         2.3x                    2.5x                  3.7x
ratio3                                                                                         ratio3

                                  Just 2 clients defaulted since 2009
                                                                                                                         Net backlog 2020 breakdowns
                         Defaulted orders were resold with no loss incurred                                 By brand                               By geography

                                                                Case 1              Case 2    Tecnomar for Lamborghini                            Americas   NCA Refit
                                                                                                                          NCA Refit
                                                                                                       4.3%                                        1.1%       0.8%
Order date                                                       2014                2018                                  0.8%
Expected delivery date                                           2016                2020        Tecnomar
                                                                                                                                          APAC
Client default date                                              2015              Oct 2020        7.7%
                                                                                                                                          26.4%                     Europe &
% Completion at default date                                     10%                 50%
Down payments (Eu mn)                                             3.0                4.5                                                                             Russia
Resale agreement date                                            2019              Nov 2020                                                                          71.7%
                                                                                                                             Admiral
New expected delivery date                                       2020              May 2021
Resold Order value                                              >100%               >100%                                    87.2%

Notes: 1) order book is equal to the sum of all contract values related to
shipbuilding orders in progress; 2) net backlog takes into account the contract
values net of related revenues already recorded; 3) backlog / Net Sales                                                                                                  12
…with positive trend towards longer products…

  ~75% of the net backlog >70mt1
 (Net Sales - Eu mn)                                                                                                                                                                 Net backlog 2020 breakdown by LOA
                                                                                                                                                     100 mt

                                                                                                                    116
                                                                                                                                                        72 mt                 >70 mt,
                                                                                                                                                                              74.7%                               NCA Refit, 0.8%
                                                                                                                                                                                                                   < 20 mt 4.3%
                                                                                                                                    77 mt
                                                                                                        100
                                                                                    65 mt                                   66 mt                                                                                      30-50 mt 7.8%

                                                                                                                        78 mt

                                                                                                                                                                                                                       50-70 mt,
                                                                                                        55 mt                                   72 mt                                                                  12.5%
                                                                                            67                              55 mt
                                                                               65
                                                                  62
                                             50 mt                                                      75 mt                                        45 mt2

                                                       52
                                            50                         75 mt                                          37 mt

                                   45 mt                                                                48 mt                               40 mt

                               45 mt                                                                          37 mt

                                                                                                                                                                                                Legend
                           38 mt                         17 mt                                                  37 mt

                           37 mt                     37 mt             40 mt                37 mt                                           19 mt

                       35 mt                         37 mt                 37 mt                                                    19 mt                                     Tecnomar for      70 mt
      2011      2012           2013        2014      2015        2016      2017         2018           2019        2020         2021          2022       2023   2024   2025                                    Date     Date

Sources: company information

Note: 1) data as at 31 December 2020, 2) contract signed in 2021                                                                                                                                                                13
…combined with a low-risk sales model

  No risk of unsold inventory and favourable advance payment conditions drive positive working capital
  dynamics
                                  Order-based approach and acceptance of cash payments only, eliminating warehouse risk

                                                                            No trade-ins                                No risk of unsold inventory
      No speculative production
                                                                             accepted                                      No risk of write-offs

             Favourable advance payment conditions improving order cash cycle, with a positive dynamic moving towards higher production length

   Order
                                                  Advance payments (% of purchase price)
   type
                                                                                                                            Advance payments not
                                     Usually up to 11/12 milestones, each with mid payments scheduled
                                                                                                                        refundable to clients in default
    Over
    50mt

                                                                                                                              •     No performance guarantees
                                   Down                                                                                                      granted
    Up to                                               Mid payment                    Mid payment           Delivery
                                   paym.
    50mt                                                   35%                            35%                 15%
                                    15%
                                                                                                                          •       Only up to 40% of the advance
                                                                                                                              payments are covered by bank and
   High-
   speed                                                                                                                          insurance guarantees granted by
                                     Down paym.             Mid payment           Mid payment           Delivery
  branded                                                                                                                              The Italian Sea Group
                                        25%                    25%                   25%                 25%
   motor-
   yacht

Sources: company information

                                                                                                                                                               14
Superior refitting capabilities, boosting customer base expansion…

  Most refitting occurs on third-party yachts, easing future customer base expansion

                                                                                                                    Refitting revenues
                                                                                        (Eu mn)
            +~25 mt increase in average length yacht refitted in 2020 vs. 2018
                                                                                                                                                              Temporary effects
                                                                                                                                                              on refitting
                                                                                                                                                              facilities due to
                                                                                                                         22.4
          • ~90% of revenues on average from third-party boats in the last 3 years                                                                            COVID-19 and
                                                                                                                                                              The Italian Sea
            • Customer base expansion opportunity for shipbuilding business                                                                         14.4
                                                                                                  12.2                                                        Group 4.0
   •     Ongoing know-how acquisition through refitting assessments of peers’ vessels                                                                         project

                     100% refitting hit ratio on The Italian Sea Group fleet
                                                                                                  2018                   2019                       2020

                                                                                                          Units refitted, breakdown by ownership

                                                                                                                         12.9%                       1.0%
                                                                                                  18.6%

        Maltese Falcon                      Main                            Ice
       88mt – Perini Navi              65mt – Codecasa                 90mt – Lürssen

                                                                                                                                                    99.0%
                                                                                                  81.4%                  87.1%

          Smeralda                       M5                           Quattro Elle                2018                   2019                        2020
       77mt – SilverYatch          78mt – VT Group                   86mt – Lürssen
                                                                                                  Other shipyards               The Italian Sea Group fleet

Sources: company information

                                                                                                                                                                    15
…leveraging on comprehensive and strategically located yard facilities
                                                                                                                        Strategic positioning in most acclaimed shipyard districts worldwide

                                                                                                                                                          Country breakdown of the refitting market

                                                                                                                                                                   RoW                           25%
                                                                                                                                                                   35%

                                                                                                                                                                                                 14%
                                                                                                                                                                         5%
                                                                                                                                                                              8%            9%

                                                                                                                                             Top crew facilities on site to convince refit decision-makers:
                                               Outperforming other competitor shipyards
                                                                                                                                                      captain and shipowner’s representative

                                                                                                         Covered
           Shipyard          Country             Motor                    Sail      Max length (mt)                            Dry docks        Offices           Gym              Training       Restaurants
                                                                                                       workspace (mt)
                                                                                           200                   150
              Lusben                                                                 120                  60                                 On site
2   FINANCIALS
Net backlog

 (Eu mn)

                                                       In   2020, 11 new contracts signed:
                                                       .     2 Admiral 72 mt yachts
                                                       .     1 40 mt catamaran (new model)
                                                       .     1 Admiral 100 mt yacht
                                                       .     7 Tecnomar for Lamborghini high-speed motorboats

Note: 2020 order intake includes ~Eu10mn of orders received and closed in
2020
                                                                                                                18
…resulting in strong cash generation and a solid capital structure
  Virtuous business model improving cash generation and favouring the balance sheet strengthening
                                     Strong cash conversion                                                      Solid capital structure

                                                                                     Strong ROCE improvement over time (21.4% ROCE in 2020 vs. 6.2% in 2018),
                   Strong cash generation, with Eu24.5mn cumulative free
                                                                                                  with a healthy financial structure to support growth
            cash flow from 2018-2020 and positive working capital dynamics
                                                                                                         (0.3x leverage in 2019 vs. 2.6x in 2018)

                         Free cash flow and cash conversion1 evolution                                   Net invested capital and ROCE 2 evolution

(Eu mn)                                                                             (Eu mn)       49.3                                           21.4%
                                                                       15.4
                                                                                                                             46.3
                    71%
                                                                       106%                                                 9.8%                 44.1
                                                  4.8
                                                                                                 6.2%
                     4.3                                    49%

                    2018                         2019                  2020                      2018                        2019                2020
                             Free Cash Flow                       Cash Conversion                           Net Invested Capital                      ROCE

                              Net working capital (NWC) evolution                             Net financial position and leverage evolution (NFP/EBITDA)
                   16.0
                                                                                                  15.6
(Eu mn)                                                                             (Eu mn)

                                                                                                                             12.2
                                                  5.0
                                                                                                   2.6x

                                                                                                                                                     3.8
                   2018                          2019                  2020                                                   1.3x
                                                                                                                                                            0.3x
                                                                                                  2018                       2019                    2020
                                                                       (10.4)
                                                                                                          NFP / (Cash)                     NFP/EBITDA

Notes:
1) Computed as unlevered free cash flow divided by EBITDA
2) Computed as EBIT/ net invested capital                                                                                                                          20
Profit & Loss | Q1 2021
                                        Profit & Loss (reclassified)

(Eu '000)                                               2020           1Q 2020     1Q 2021     YoY (%)
Operating revenues                                    112,951            18,054      33,698      86.7%
Other revenues                                          5,343               872       1,200      37.6%
Sale fees                                              (1,853)             (473)       (206)    (56.4%)
Net Sales                                            116,441             18,453      34,692      88.0%
YoY                                                     16.1%
Raw material costs                                    (26,423)           (3,333)     (7,621)    128.7%
Outsourced processes                                  (44,703)           (7,632)    (13,034)     70.8%
Consulting fees                                        (5,370)             (448)     (1,579)    252.5%
Other service costs                                    (7,037)           (1,262)     (2,229)     76.6%
Staff costs                                           (16,881)           (3,715)     (5,114)     37.7%
Other operating costs                                  (1,507)             (184)       (512)    178.3%
Total Costs                                         (101,921)           (16,574)    (30,089)     81.5%
EBITDA                                                 14,520             1,879       4,603     145.0%
EBITDA margin                                           12.5%             10.2%       13.3%
D&A                                                    (5,090)           (1,012)     (1,137)     12.4%
EBIT                                                    9,430               867       3,466     299.6%
EBIT Margin                                              8.1%              4.7%       10.0%
Net financial income (charges)                         (1,963)             (552)       (936)     69.6%
Total extraordinary Income (expenses)                     343                75          48     (36.0%)
EBT                                                     7,810               390       2,578     560.2%
Taxes                                                  (1,575)             (221)       (670)    203.2%
Tax rate                                                20.2%             56.6%       26.0%
Net income                                              6,235               169       1,908    1025.9%

                                                                                                21
Balance Sheet | Q1 2021
                                         Balance Sheet                                                                 Key comments

(Eu '000)                                             2020       1Q 2021     YoY (%)

Intangible assets                                                              (1.1%)
                                                         4,377      4,327
                                                                                        The increase in the NFD as at Q1-2021 vs. FY-2020 is due to:
Tangible assets                                                                 7.4%
                                                     53,543        57,522               •   € 6.2m for the payment of dividends
Investments                                                                         -       € 3.2m upon payment of the CELI transaction
                                                           43          43               •

Net Fixed Assets                                    57,963        61,892        6.8%    •   € 4.6m for investments referring to TISG 4.0

Other long-term assets and liabilities                   (740)      1,293    (274.7%)   •   For the residual part to the dynamics of working capital

Inventory                                                2,759      2,739      (0.7%)

Contract work in progress and advance
                                                     13,704        31,063     126.7%
payments
Trade receivables                                    14,616         4,932     (66.3%)

Trade payables                                      (34,240)      (30,191)    (11.8%)

Other current assets and liabilities                 (6,544)       (6,931)      5.9%

Net Working Capital                                (10,445)         2,905    (127.8%)

(Funds)                                              (3,456)       (3,653)      5.7%

Total Invested Capital                              44,062        61,144       38.8%

Total shareholder's equity                           40,220        35,902     (10.7%)

Net financial debt                                       3,842     25,242     557.0%

Total shareholder's equity and NFD                  44,062        61,144       38.8%

                                                                                                                                                       22
Cash Flow | Q1 2021
                                    Cash Flow
(Eu '000)                                 2020      1Q 2020     1Q 2021      YoY (%)
Earnings before taxes                     7,810          390       2,578      561.0%
Provisions                                2,656          456         648       42.1%
Depreciation and amortisation             3,941          869         957       10.1%
Financial items                             703           16          17        6.3%
Taxes                                      (637)       (221)        (670)     203.2%
Operating Cash Flow                      14,473       1,510        3,530     133.8%
Trade receivables                        (2,933)         825       9,504     1052.0%
Inventory                                 8,012        5,563     (17,339)    (411.7%)
Other operating assets                   (1,260)       1,215         431      (64.5%)
Credits for escrow                              -           -           -           -
Trade payables                           11,161       (3,959)     (4,049)       2.3%
Other operating liabilities                (511)       (504)       1,190     (336.1%)
Employee severance indemnity               (798)       (173)        (219)      26.6%
Funds                                      (406)          (4)        360    (9100.0%)
Change in NWC and Funds                  13,265       2,963      (10,122)   (441.6%)
Cash flow from operating activity        27,738       4,473       (6,592)   (247.4%)
Capex                                   (12,349)     (1,381)      (5,069)    267.1%
Free Cash Flow                           15,389       3,092      (11,661)   (477.1%)
CELI receivable                          (1,343)           0      (3,192)           -
Cash flow from financing activity        (1,858)     (1,700)       5,747    (438.1%)
Total cash flow for the period           12,188       1,392       (9,106)   (754.2%)

                                                                              23
3   STRATEGY
A clear long-term vision to drive future growth

  Clearly developed business strategy to enhance brand awareness, improve international positioning and
  increase production capacity

                   Enhance brand awareness                       Improve international positioning                       Increase production capacity

            Increase yacht length (up to 100mt)                US - Increase Admiral and Tecnomar brand              External growth, acquiring majority stakes in
            To enhance luxury features of Admiral yachts and   awareness through ad hoc marketing campaigns          selected European shipyards (i.e. in Italy, Turkey
            improve the Group’s overall price positioning      and participation at the most exclusive industry      and Greece) to move less strategic activities abroad
                                                               events

            Leverage on the Automobili Lamborghini
            partnership as a “door opener”                     Asia - Extend Tecnomar range - in high demand in
                                                                                                                     ”The Italian Sea Group 4.0”, a transformational
                                                               the region - improving internal and external design
                                                                                                                     project to expand the Marina di Carrara
                                                                                                                     production area, specialising in the phases that
           Enter into new partnerships with
                                                                                                                     add most value (already financed)
            international luxury brands to increase            Europe - Increase collaborations with acclaimed
            visibility and price positioning                   industry “starchitects” to strengthen uniqueness
                                                               and exclusivity of TISG production

                                                               Middle East - Leverage on the Automobili
                                                               Lamborghini partnership to foster cross-selling of
                                                               Admiral and Tecnomar and boost marketing
                                                               efforts

Sources: company information, management statements

                                                                                                                                                               25
Disclaimer
This document has been prepared by The Italian Sea Group S.p.A. (“TISG” or the “Company”) for use during meetings with investors and financial analysts and is solely for information purposes.
This presentation may contain forward looking statements which reflect Management’s current views and estimates. The forward looking statements involve certain risks and uncertainties that could
cause actual results to differ materially from those contained in the forward looking statements. Potential risks and uncertainties include such factors as general economic conditions, foreign
exchange fluctuations, competitive product and pricing pressures and regulatory developments. Figures as absolute values and in percentages are calculated using precise financial data. Some of
the differences found in this presentation are due to rounding of the values expressed in millions of Euro. This document does not constitute an offer to sell or a solicitation to buy or subscribe to
Company shares and neither this entire document or a portion of it may constitute a recommendation to effect any transaction or to conclude any legal act of any kind whatsoever. This document
may not be reproduced or distributed, in whole or in part, by any person other than the Company. The Manager in Charge of preparing the Corporate accounting documents, Marco Carniani,
declares pursuant to and to the effects of article 154-bis, paragraph 2 of Legislative Decree no. 58 of 1998, as amended, that the disclosures included in this document correspond to the
balances on the books of account and the accounting records and entries.
You can also read