INVESTOR UPDATE TSX & NYSE: ERF - Enerplus

Page created by Annette Fuller
 
CONTINUE READING
INVESTOR UPDATE TSX & NYSE: ERF - Enerplus
TSX & NYSE: ERF

                  INVESTOR UPDATE
                       May 2022
INVESTOR UPDATE TSX & NYSE: ERF - Enerplus
Forward looking information and statements
This presentation contains certain forward-looking information and statements ("forward-looking information") within the meaning of applicable securities laws. The use of any of the words "expect", "anticipate", "continue", "estimate",
“guidance”, "ongoing", "may", "will", "project", "plans", “budget”, "strategy" and similar expressions are intended to identify forward-looking information. In particular, but without limiting the foregoing, this presentation contains forward-looking
information pertaining to the following: updated 2022 production and capital spending guidance; expected capital spending levels in 2022; expectations regarding 2022 and future shareholder returns, including payment of dividends and
Enerplus' share repurchase program, the timing and amounts thereof and funding dividends and the share repurchase program from free cash flow; expectations regarding free cash flow generation and capital spending reinvestment rates;
expected operating strategy in 2022 and expectations regarding our drilling program and well costs; 2022 average production volumes and the anticipated production mix; the proportion of our anticipated oil and gas production that is
hedged and the expected effectiveness of such hedges in protecting our cash flow from operating activities and adjusted funds flow; oil and natural gas prices and differentials and expectations regarding the market environment and our
commodity risk management program in 2022; updated and existing 2022 Bakken and Marcellus differential guidance; expectations regarding realized oil and natural gas prices; expected operating, transportation and cash G&A expenses and
production taxes and updated 2022 guidance with respect thereto; expectations regarding net debt and debt reduction; expectations regarding increases to dividends and timing thereof; and expectations regarding renewal of our normal
course issuer bid, including timing and size thereof.

The forward-looking information contained in this presentation reflects several material factors and expectations and assumptions of Enerplus including, without limitation: that we will conduct our operations and achieve results of operations
as anticipated; the continued operation of the Dakota Access Pipeline; that our development plans will achieve the expected results; that lack of adequate infrastructure will not result in curtailment of production and/or reduced realized prices
beyond our current expectations; current and anticipated commodity prices, differentials and cost assumptions; the general continuance of current or, where applicable, assumed industry conditions, the impact of inflation, weather conditions,
storage fundamentals and expectations regarding the duration and overall impact of COVID-19; the continuation of assumed tax, royalty and regulatory regimes; the accuracy of the estimates of our reserve and contingent resource volumes;
the continued availability of adequate debt and/or equity financing and adjusted funds flow to fund our capital, operating and working capital requirements, and dividend payments as needed; the ability to fund increased dividend payments
and the share purchase program from free cash flow as expected and discussed in this presentation; our ability to comply with our debt covenants; the availability of third party services; expected transportation expenses; the extent of our
liabilities; and the availability of technology and process to achieve environmental targets. In addition, our 2022 guidance described in this presentation is based on: a WTI price of US$85.00/bbl, a NYMEX price of US$5.00/Mcf, a Bakken
crude oil price at par with WTI, a Marcellus natural gas price differential of $(0.75)/Mcf below NYMEX and a CDN/USD exchange rate of 0.79. Enerplus believes the material factors, expectations and assumptions reflected in the forward-
looking information are reasonable but no assurance can be given that these factors, expectations and assumptions will prove to be correct. Current conditions, economic and otherwise, render assumptions, although reasonable when made,
subject to greater uncertainty.

The forward-looking information included in this presentation is not a guarantee of future performance and should not be unduly relied upon. Such information involves known and unknown risks, uncertainties and other factors that may
cause actual results or events to differ materially from those anticipated in such forward-looking information including, without limitation: continued instability, or further deterioration, in global economic and market environment, including
from COVID-19, inflation and/or the Ukraine/Russia conflict and heightened geopolitical risks; decreases in commodity prices or volatility in commodity prices; changes in realized prices of Enerplus’ products from those currently anticipated;
changes in the demand for or supply of our products; unanticipated operating results, results from our capital spending activities or production declines; legal proceedings or other events inhibiting or preventing operation of the Dakota Access
Pipeline; curtailment of our production due to low realized prices or lack of adequate infrastructure; changes in tax or environmental laws, royalty rates or other regulatory matters; changes in our capital plans or by third party operators of our
properties; increased debt levels or debt service requirements; inability to comply with debt covenants under our bank credit facilities and/or outstanding senior notes; inaccurate estimation of our oil and gas reserve and contingent resource
volumes; limited, unfavourable or a lack of access to capital markets; increased costs; a lack of adequate insurance coverage; the impact of competitors; reliance on industry partners and third party service providers; changes in law or
government programs or policies in Canada or the United States; and certain other risks detailed from time to time in our public disclosure documents (including, without limitation, those risks identified in our first quarter 2022 MD&A, our
annual information form for the year ended December 31, 2021, our 2021 annual MD&A and Form 40-F as at December 31, 2021).

The forward-looking information contained in this presentation speaks only as of the date of this presentation. Enerplus does not undertake any obligation to publicly update or revise any forward-looking information contained herein, except
as required by applicable laws.
                                                                                                                                                                                                                                                       2
INVESTOR UPDATE TSX & NYSE: ERF - Enerplus
Enerplus overview
   Differentiated core Bakken position with deep drilling inventory

   Committed to capital discipline                                                                                       CDN
                                                                                                                      WATERFLOODS
   Robust free cash flow profile

   Long track record of returning capital to shareholders

   Consistently operates with low financial leverage                                                                        BAKKEN                       MARCELLUS

   Deeply integrated approach to ESG
                                                                                                                             Dual listed: TSX & NYSE
       Production by area (1)                      Production by product(1)           Capital allocation(1)
                                                                                                                             Market capitalization: US$3 billion
                                     28%            53%                             83%
                                                                                                                             2022e production: 98,500 BOE/d (62% liquids)
     64%                                                                      38%

                                                                                                                10%
                                   7%
                                                                                                           7%
                                 1%                                      9%
    Bakken      Marcellus     Canada       DJ       Crude Oil   Natural Gas   NGL   Bakken   Marcellus   Canada/DJ
                                                                                                                                                                    3
1) Charts reflect 2022e production and capital allocation.
INVESTOR UPDATE TSX & NYSE: ERF - Enerplus
Key updates from Q1 2022

       INCREASING CASH RETURNS TO SHAREHOLDERS IN 2022
 1
       Returning $350MM or 50% of free cash flow, whichever is greater, through dividends & share repurchases

       ON TRACK TO DELIVER RECORD ANNUAL FREE CASH FLOW
 2
       Forecasting 2022 free cash flow(1) of approximately $675MM based on $85 WTI and $5 NYMEX

       EXECUTION DRIVES PRODUCTION GUIDANCE INCREASE
3
       Strong execution increases annual production forecast to 96-101 MBOE/d (+0.5 midpoint)

       MANAGING INFLATION IMPACTS
4
       Services, equipment & supplies secured to execute efficient operating plan; 2022 capital spending increased 5%(2)

       COMMITTED TO CAPITAL DISCIPLINE
 5
       No increase to activity levels, no plans to chase higher, less efficient growth

1) See Non-GAAP & Other Financial Measures in “Advisories”.                                                                4
2) Capital spending guidance updated to $400-$440MM, from $370-$430MM. Midpoint increased by 5%.
INVESTOR UPDATE TSX & NYSE: ERF - Enerplus
2022: disciplined plan, robust free cash flow generation
Key figures                                                                                         2022e free cash flow sensitivities (1)(2)

              TOTAL                                                                                                                $900                                                                                             30%
              PRODUCTION                       96,000-101,000                                                                      $800                                                                           24%
              BOE/D                                                                                                                                                                                                                 25%
                                                                                                                                   $700                                     22%

                                                                                                     Free cash flow ($ millions)
                                                                                                                                           18%

                                                                                                                                                                                                                                          Free cash flow yield
                                                                                                                                   $600                                                                                             20%
             CAPITAL
             SPENDING(1)                                $400-$440                                                                  $500
             $ MILLIONS
                                                                                                                                                                                                                                    15%
                                                                                                                                   $400

                                                                                                                                   $300                                                                                             10%
              REINVESTMENT
INVESTOR UPDATE TSX & NYSE: ERF - Enerplus
2022 capital allocation and excess free cash flow at $85 WTI
                                           2022e adjusted funds flow
                                             Based on $85/bbl
                                              WTI & $5/Mcf NYMEX
                    $1,200                                                        2022e capex: $400-$440MM
                                      ~$1,100                                                                                                              ~$640
                                                                                    7% annual production growth(2)
                    $1,000                                                          3-5% annual organic production growth
                                                                                     (normalized for timing of 2021 acquisitions)
                                                                                                                                                                           Excess free cash flow:
                     $800                                                                                                Annual dividend                                    Share repurchases
                                                                                                                                                                                                      PRIORITIZE
     US$ millions

                                                                                                                           Quarterly:                                      Debt reduction
                                                                                                                            $0.043/share                                    Accretive acquisitions
                     $600

                                                                             ~$420                                   ~$40
                     $400

                     $200

                       $0
                             Adjusted funds flow(1)                          Capex                                Dividends                  Excess free cash flow after
                                                                                                                                                     dividends
1) See Non-GAAP & Other Financial Measures in “Advisories”. Based on realized prices through Q1 2022 and flat oil price thereafter (assumes $5.00/Mcf NYMEX).                                              6
2) 2022e production growth based on the guidance midpoint.
INVESTOR UPDATE TSX & NYSE: ERF - Enerplus
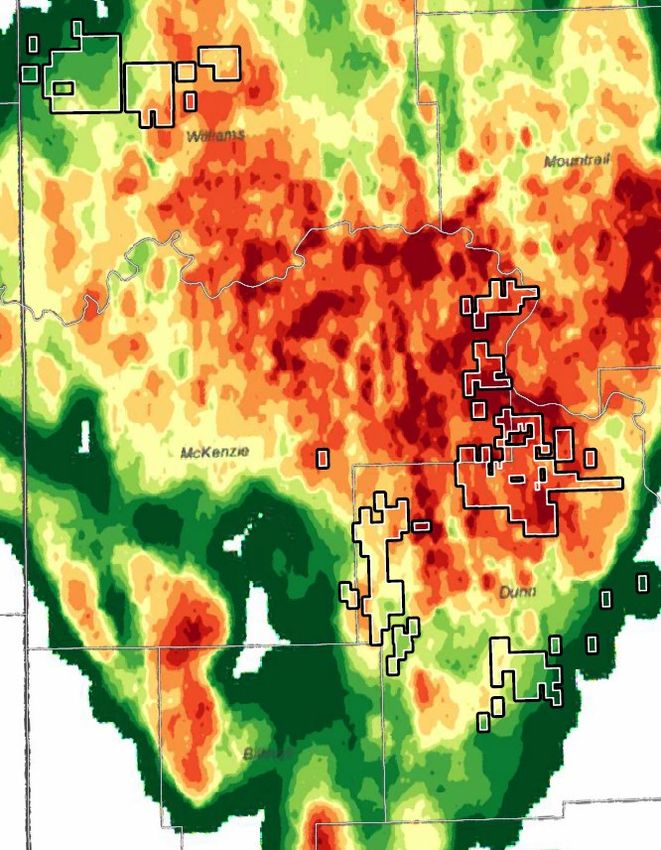
Return of capital to shareholders
                                                                                                              2022 return of capital oil price sensitivity(1)
                                                                                                              $ millions
        2022 RETURN OF CAPITAL COMMITMENT

 Total of $350 million or 50% of free cash flow,                                                             $400                                                                                $370
  whichever is greater, to be returned to                                                                                             $350                          $350
                                                                                                                                                                                                         $350MM
  shareholders in 2022                                                                                                                             Additional                                            minimum
                                                                                                              $300                                  amount
 Returns to be delivered through dividends and
  share repurchases                                                                                                                                                                               $306
                                                                                                              $200                                                   $274
 Quarterly dividend increased by 30% to                                                                                               $221
                                                                                                                                                    50% of
  $0.043/share, or ~$40 million annualized                                                                                                           FCF
                                                                                                               $100
 Minimum of $286 million in remaining cash
  returns in 2022                                                                                                                      $64                           $64                          $64
                                                                                                                  $0
                                                                                                                                      $75 WTI                       $85 WTI                   $95 WTI
                                                                                                                                         Capital returned to date     Capital returns remaining
                                                                                                                                         Capital returns = Dividends + Share repurchases
                                                                                                                                                                                                           7
 1) Capital returned to date is inclusive of dividends and share repurchases through May 4, 2022. Sensitivity uses $5.00/Mcf NYMEX.
INVESTOR UPDATE TSX & NYSE: ERF - Enerplus
Bakken focused five-year outlook
    Bakken focused five-year outlook expected to generate                                                                           Five-year production and free cash flow outlook
       ~$2.3bn of free cash                 flow(1)    at $70/bbl           WTI (2)                                                                  120                                               $2.5

                                                                                                                                                                                                                  Cumulative free cash flow ($ billions)
          − >80% of capital allocated to the Bakken

                                                                                                                       Company production (Mboe/d)
                                                                                                                                                     100
          − >80% of annual cash flow generated from the Bakken                                                                                                                                         $2.0
                                                                                                                                                      80
    Annual production growth rate of 3-5% supports sustainability                                                                                                                                     $1.5
          − Base decline expected to remain between 30-35%                                                                                            60
          − Assumes 1.5-2 rigs operating throughout 5-year period                                                                                                                                      $1.0
                                                                                                                                                      40

    Outlook assumes current asset portfolio unchanged                                                                                                20                                               $0.5

          − Divestment process initiated for Canadian assets
                                                                                                                                                       0                                               $0.0
                                                                                                                                                             2022    2023   2024   2025       2026
                                                                                                                                                           Bakken                   Marcellus
    Five-year outlook based on $70/bbl WTI, $3.00/Mcf NYMEX(2)                                                                                             Canada/DJ                Cumulative free cash flow

                        Annual capital                                        Avg. reinvestment                                                       Cumulative free                 Annual liquids
                        spending(1)                                           rate (1)                                                                cash flow(1)                    production growth

         ~$400-450 million                                                  ~50%                                                                     ~$2.3 billion                       3-5%
1) See Non-GAAP & Other Financial Measures in “Advisories”.                                                                                                                                                   8
2) 2022 is based on $85/bbl WTI and $5.00 /Mcf NYMEX. Years 2023-2026 are based on $70/bbl WTI and $3.00/Mcf NYMEX..
INVESTOR UPDATE TSX & NYSE: ERF - Enerplus
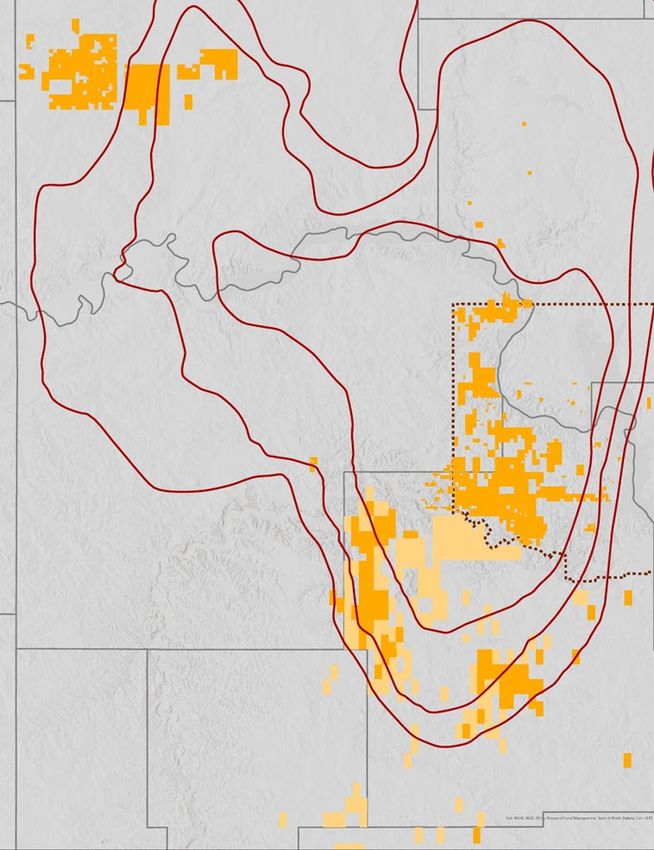
ENVIRONMENTAL, SOCIAL & GOVERNANCE
   Material focus areas
                                                                                                                                                                                     Water Management
                                                                                          2021
TARGETS           (1)
                                                                                          PERFORMANCE (1)
GHG emissions intensity reduction targets(2)                                               >20% Methane   emissions
                                                                                                intensity reduction
  2022 target: 20% reduction in methane emissions                                                                                                                                                                              Community
  2030 target: 50% reduction                                                              ~25%          GHG emissions                             Greenhouse Gas
                                                                                                         intensity reduction
                                                                                                                                                      Emissions                                                                 Engagement
                                                                                                                                                                                                ESG
Freshwater use reduction targets                                                                                                                                                            MATERIAL
                                                                                            31%
  2021 target: 25% reduction/well comp. in FBIR                                            Freshwater use reduction
                                                                                                                                                                                             FOCUS
  2025 target: 50% reduction/well comp. corporately                                        per completion in 2021                                                                           AREAS

Health & Safety target                                                                      Zero lost time                                      Board Constitution                                                                    Culture
  Reduce LTIF(3) by 25% on average, between 2020-                                          injuries in 2021                                        & Culture
   2023

                                                                                                                                                                                         Health & Safety
 1) Targets and 2021 performance are relative to a 2019 baseline.
 2) Enerplus’ GHG emissions reduction targets address scope 1 and 2 emissions. Scope 1 emissions are direct emissions from owned and operated facilities. Scope 2 emissions are indirect emissions from the generation of purchased
    energy for the Company’s owned and operated facilities. Targets are relative to a 2019 baseline.                                                                                                                                      9
 3) Lost Time Injury Frequency.
INVESTOR UPDATE TSX & NYSE: ERF - Enerplus
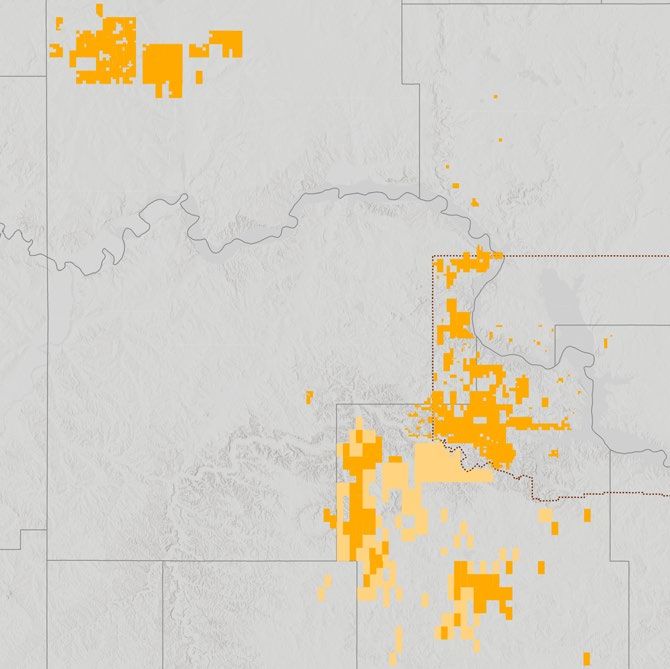
DIFFERENTIATED BAKKEN POSITION

                                 10
Core Bakken is competitive with the best N.A. oil plays
           Third-party data: Breakeven WTI oil prices across North American oil plays(1)(2)
           Source: Enverus Intelligence Research
                            $60
                                                                                          Little Knife & FBIR areas represent ~85%
                                                                                          of Enerplus’ >10-year core inventory
                            $50
    WTI oil price ($/bbl)

                            $40

                            $30

                            $20

                             $10

                             $0

                                                                                                                                                                 UINTA
                                                                                                                      CARDIUM

                                                                                                                                BAKKEN-US

                                                                                                                                                                         PRB

                                                                                                                                                                                            DUVERNAY
                                   DELAWARE

                                              MIDLAND

                                                                                 BAKKEN
                                                        DJ

                                                                                                 EAGLE FORD

                                                                                                                                            VIKING
                                                                  LITTLE KNIFE

                                                                                                              SCOOP

                                                                                                                                                     SHAUNAVON

                                                                                                                                                                               BAKKEN-CDN
                                                                                                              STACK
                                                                                  FBIR
                                                                     BAKKEN

1) Breakeven prices represent the average WTI price at which wells generate a 10% IRR. Based on wells since 2018.                                                                                      11
2) Based on oil plays developed with horizontal wells.
Enerplus: substantial core acreage, large remaining opportunity set
  Lightly drilled acreage                                                  Acreage in core & extended core                                            Substantial sub-$50/bbl WTI inventory
  Drilling density: wells per DSU                                          Productivity: 6 month BOE/1K foot lateral                                  Contours based on breakeven WTI prices (10% IRR)

                                                                                      Williams

                                                                                                                                                                                                                                 Indicative well NPVs
                                                                                                                                                                                                                                  NPV10 at $80 WTI(1)
                                                                                                                                FBIR
                                                                                                                                                                                                                                  ($MM)

                                                                                                                                                            $60                                                                   Approx. $4MM+

                                                                                                                                                                               $50                                                Approx. $7MM+
                                                                                                                 Little
                                                                                                                 Knife                                                                      $40                                   Approx. $12MM+

                                                                                                                              Murphy Creek                 Enerplus operated acreage
                                                                                                                                                           Enerplus non-op acreage

  Outlines are Enerplus operated units                                      Outlines are Enerplus operated units
1) Source: Drilling density based on internal mapping. Productivity mapping from Tudor, Pickering, Holt & Co. WTI breakeven analysis and drilling density based on internal research. Well NPVs at $80 & $100 WTI assume a total well cost   12
  of $6.5mm. Well NPVs at $60 WTI assume a total well cost of $6.0mm.
Enerplus has outsized core inventory relative to production
  Third-party data: Top Bakken operators - remaining drilling inventory ranked by breakeven WTI price (1)(2)
  Source: Enverus Intelligence Research
  Mcap >$10bn
  Mcap
Deep drilling inventory supports sustainable outlook
                           1,000
                                                                                                           Inventory upsides
                            900                                                                            Lower return locations that offer

                            800
                                                                                 250
                                                                                                            upside through stimulation advances,
                                                                                                            well cost improvements, sustained
                                                                                                            high oil prices
                                                                                                                                                                                          >Decade
  Net drilling locations

                            700                                                                                                                                                        of Core drilling
                            600      670                                          110                      Extended Core                                                                  inventory
                                                                                                           Periphery of established core                                               (at development pace
                                     FUTURE
                            500                                                                            Lower returns than Core, but exceeds
                                     DRILLING                                                                                                                                          assumed in 5-year plan)
                                                                                                            returns threshold at midcycle prices
                                     LOCATIONS
                            400                                                                            Primarily southern Dunn
                                     IN CORE /
                                     EXTENDED CORE(1)
                            300
                                                                                 560                       Core                                                                           Additional drilling
                            200                                                                            Established economic core of play                                              inventory in the
                                                                                                           Well defined & de-risked                                                   Extended Core + Upside
                            100                                                                            FBIR, northern Dunn, eastern                                                      locations
                                                                                                            Williams
                              0
                                       45
                                     2022                                 North Dakota
                                   Onstreams (2)                           Inventory

1) See “Advisories – Drilling Inventory” for a reconciliation of undrilled locations between those associated with reserves and those not associated with any reserves. As at 1 Jan 2022. Includes operated and non-operated locations.   14
2) 2022 onstreams includes operated and non-operated wells.
Operational execution supporting low cost structures
                                                                            Total well costs         34%
                                                                            ($MM)              Reduction driven
                                                                                               primarily by efficiencies
                                                                               $8.6
 Strong track record of drilling and completion                                                                            Expected increase
  efficiency gains driving cost structures lower                                                                     $5.7
                                                                                                                            due to inflation
                                                                                                                                            ~$6.5
   − Almost $3MM reduction in total well costs 2018-2021

 Strategic partnerships, technology and innovative
  culture are supporting efficiencies
                                                                               2018        2019          2020        2021                   2022e
 Inflationary pressures are increasing 2022e well costs
                                                                                                     EFFICIENCY GAINS
   − Primarily driven by diesel and steel which account for approximately
                                                                              Drilling days (spud to rig release)           Completions (stages/day)
      80% of the estimated increase                                           Normalized to 20,700 ft TMD
                                                                                             IMPROVEMENT                                IMPROVEMENT
                                                                                    15%      SINCE 2018                       2.7x      SINCE 2018

                                                                                    14.6
                                                                                                  12.4                                      13.0

                                                                                                                                4.9
                                                                                    2018        2021                            2018        2021    15
Bakken oil price strength supported by spare pipeline capacity
                                                                 Enerplus Bakken oil price differential vs WTI ($/bbl)
 Oil price diffs

                                                                                                                                                                                                          Par with WTI

                                                                                                                                                                                              (2.15)
                                                                                                                          (3.72)            (3.78)            (3.98)
                                                                                                                                                                            (5.39)                                          Basin not expected to test egress capacity.
                                                                                                                                                                                                            2022
                                                                                                        (7.46)                                                                                            GUIDANCE          Expect in basin differentials to trade in
                                                                                      (9.44)                                                                                                                                $0 - $2.00/bbl range below WTI
                                                                   (12.94)

                                                                      Pre-DAPL                                             DAPL in service June 2017                            COVID / OPEC related oil price shock
                                                                      Significant rail utilization led to                  Differentials strengthened due                       led to reduced basin production &
                                                           1.8
Bakken oil production & takeaway(1)

                                                                      wider differentials                                  to increased pipeline egress                         increased spare pipeline capacity
                                                           1.6                                                                                                                                                                               Production forecast
                                                           1.4                                                                                                                                                                               based on 50 rigs
                                                           1.2                                                               DAPL
                                       Millions of bbl/d

                                                           1.0
                                                                                                                                                                                                                                             Wood Mackenzie
                                                                             Production
                                                           0.8                                                                                                                                                                              Production forecast
                                                                                                                                                                                                                                            based on 30 rigs
                                                           0.6                                                                Pipelines
                                                                                                                              (ex DAPL)
                                                           0.4
                                                           0.2
                                                                                                                                            Rail volumes(2)
                                                           0.0
                                                             Jan-14          Jan-15            Jan-16            Jan-17            Jan-18            Jan-19            Jan-20        Jan-21            Jan-22      Jan-23      Jan-24      Jan-25      Jan-26
        1) Source: North Dakota Industrial Commission (NDIC), Company estimates, Wood Mackenzie. Production is shown net of local refining demand.                                                                                                                    16
        2) Forecast rail volumes assume 175 mb/d are contracted going forward.
APPENDIX

           17
Strong liquidity and low financial leverage
Significant liquidity                                                                                                                                         Track record of low financial leverage
Liquidity position at March 31, 2022 ($ millions)                                                                                                             Net debt to adjusted funds flow ratio(2)
             Enerplus was the first North American E&P to transition its principal credit facility to a Sustainability                                                      5-year track record of operating at or below 1x
             Linked Credit Facility, incorporating ESG performance targets                                                                                                  ND/FF ratio annually

                                                                                                                                                               3x
     ~$1,030                                                                                                       Net debt as at
                                                                                                                   March 31, 2022:
                                                                                                                    $572 million
                                                                                                                                                               2x

                          Cash + Undrawn
                                                                             Revolving Credit Facility
                          Credit Facilities                                                                                                                                                          1.0x
                                                                              Avg. interest rate: 2.83%(1)
                                                                                                                                                                1x                                            0.9x
                                                                                                                                                                       0.6x                0.6x                        0.7x
                                                  SENIOR NOTES                         $278                                                                                      0.4x
                                                Avg. interest rate: 4.2%
                                                $101                 $81                $81                  $21                $21
                                                                                                                                                               0x
     Liquidity                                 2022                2023                2024                  2025             2026                                     2017      2018      2019     2020      2021      Q1
                                                                                                                                                                                                                       2022
            Undrawn Credit Facilities + Cash                         Senior Notes                  Revolving Credit Facility

  1) Drawn fees are expected to be approximately 2.83% based on an underlying 3-month LIBOR rate of 1.33%.. Drawn amount is net of amortized debt issuance costs of $2MM.                                                     18
  2) See Non-GAAP & Other Financial Measures in the “Advisories”.
2022 guidance
     2022 ANNUAL GUIDANCE                                                                                        Bakken focused capital budget
                                                                                                                 2022e capital spending allocation
     Capital spending (US$MM)(1)                                                             $400 - $440

     Total production (Mboe/d)                                                                     96 – 101

     Liquids production (Mbbl/d)                                                                58.5 – 62.5    Williston Basin

     Average production tax rate
                                                                                                         7%
     (% of net sales, before transportation)                                                                               83%
     Operating expense (US$/boe)                                                             $9.75 - $10.50

     Transportation expense (US$/boe)                                                                 $4.15                $400-$440
                                                                                                                                 MILLION
     Cash G&A expense (US$/boe)                                                                       $1.25
                                                                                                                                                 10%
                                                                                               $20 – $30
     Current tax expense (US$MM)                                                                                                                       Marcellus
                                                              (2% - 3% of adjusted funds flow before tax(1))                                7%

     Bakken oil price differential. vs WTI (US$/bbl)                                          Par with WTI
                                                                                                                                         Canada / DJ Basin
     Marcellus natural gas price differential. vs NYMEX (US$/Mcf)                                   $(0.75)

                                                                                                                                                              19
1) See Non-GAAP & Other Financial Measures in “Advisories”.
COMMODITY HEDGING SUMMARY
   Price risk management
  CRUDE OIL HEDGES (WTI)(1)(2)(3)
                                                                        Swaps                                                                                           Collars

  Period                                                                                                                                                                    Purchased
                                                       Volume                      Swaps                           Volume                    Sold Put                                                                 Sold Call
                                                                                                                                                                                Put
                                                      (Mbbl/d)                   (US$/bbl)                        (Mbbl/d)                  (US$/bbl)                                                                (US$/bbl)
                                                                                                                                                                             (US$/bbl)

  Apr 1 – Jun 30, 2022                                     -                          -                              12.5                    $58.00                            $75.00                                  $87.63

  Apr 1 – Dec 31, 2022                                     -                          -                              17.0                   $40.00                            $50.00                                   $57.91

  Jan 1 – Jun 30, 2023                                     -                          -                              10.0                   $60.00                             $76.50                                 $107.38

  Jan 1 – Dec 31, 2023                                     -                          -                              2.0                         -                             $5.00                                  $75.00

   NATURAL GAS HEDGES (NYMEX)(2)
                                                                           Swaps                                                                                           Collars

  Period                                                Volume                         Swaps                                Volume                       Sold Put                     Purchased Put                        Sold Call
                                                        (Mcf/d)                      (US$/Mcf)                              (Mcf/d)                     (US$/Mcf)                       (US$/Mcf)                         (US$/Mcf)

  Apr 1 – Oct 31, 2022                                  40,000                          $3.40                             60,000                              -                             $3.77                           $4.50

1) The total average deferred premium spent on our outstanding hedges is US$1.50/bbl from April 1, 2022 – December 31, 2022 and US$1.25/bbl from January 1, 2023 – June 30, 2023.
2) Transactions with a common term have been aggregated and presented at weighted average prices and volumes.
3) Upon closing of the Bruin Acquisition, Bruin’s outstanding crude oil contracts were recorded at a fair value liability of $76.4 million. At March 31, 2022, the remaining liability was $16.3 million on the Condensed Consolidated Balance Sheets. Realized and unrealized gains
and losses on the acquired contracts are recognized in Condensed Consolidated Statement of Income/(Loss) and the Condensed Consolidated Balance Sheets to reflect changes in crude oil prices from the date of closing of the Bruin Acquisition. See Note 16 to the Interim
Financial Statements for further details.                                                                                                                                                                                                                                              20
BAKKEN CORE DRILLING INVENTORY
                                     FBIR
                           Expected average well performance (1)                                                       Inventory Distribution
                           Payout period and NPV10 at $60, $80, $100 per barrel WTI                                    Net future drilling locations
                                                                                                                                                                                                                               Mountrail
                                     300
                                               WTI NPV10 $MM                                                                                                                                      Williams
                                               $100                    $19                                           EXTENDED              670                                                                                FBIR
                                     250        $80              $13                                                    CORE
 Cumulative oil production (mbbls)

                                                $60        $7                                                            ~110
                                                                                                                      locations                                                                 McKenzie
                                     200                          $60
                                                                  WTI
                                     150               $80
                                                       WTI
                                                $100                                                                                                                                                       Billings                  Dunn

                                     100
                                                WTI
                                                                                                                        CORE
                                                                                                                        ~560
                                                                                                                                                                                         Development plan
                                                                                                                      locations
                                      50                                                                                                                                                 ~10 wells per 1,280 ft. spacing unit
                                                                 Payout: 6 months                                                                           60%
                                                                                                                                                            FBIR                         MB
                                                                 at $80 WTI
                                      0                                                                                                                                                  TF 1
                                           0      2    4     6     8         10    12 14    16   18   20   22   24
                                                                                  Month                                                                                                  TF 2              TF2 locations in select areas
                                               Enerplus well                               $50 WTI breakeven well
                                               $60 WTI breakeven well
                                                                                                                                                                                                                                       21
1) See “Expected well performance” in “Advisories”. Well economics at $80 & $100 WTI assume a total well cost of $6.5mm. Well economics at $60 WTI assume a total well cost of $6.0mm.
BAKKEN CORE DRILLING INVENTORY
                                      Little Knife
              Expected average well performance (1)                                                                         Inventory Distribution
              Payout period and NPV10 at $60, $80, $100 per barrel WTI                                                      Net future drilling locations
                                                                                                                                                                                                                               Mountrail
                                      300
                                                WTI NPV10 $MM                                                                                                                                     Williams
                                                $100                       $19                                                                 670
                                      250                                                                                 EXTENDED
                                                $80                  $13
                                                                                                                             CORE
  Cumulative oil production (mbbls)

                                                $60         $7                                                                ~110                                                                                    Little
                                      200                                                                                  locations                                                            McKenzie              Knife
                                                        $60
                                                    $80 WTI
                                      150
                                                    WTI                                                                                                           25%
                                                 $100                                                                                                       LITTLE KNIFE                                   Billings                 Dunn

                                      100        WTI                                                                         CORE
                                                                                                                             ~560                                                        Development plan
                                                                                                                           locations                                                     ~6-9 wells per 1,280 ft. spacing unit
                                       50
                                                                 Payout: 5 months
                                                                                                                                                                                         MB
                                                                 at $80 WTI
                                       0                                                                                                                                                 TF 1
                                            0      2    4        6         8     10    12 14 16 18 20 22             24
                                                                                      Month                                                                                              TF 2
                                                Enerplus well                               $50 WTI breakeven well
                                                $60 WTI breakeven well
                                                                                                                                                                                                                                       22
1) See “Expected well performance” in “Advisories”. Well economics at $80 & $100 WTI assume a total well cost of $6.5mm. Well economics at $60 WTI assume a total well cost of $6.0mm.
BAKKEN CORE DRILLING INVENTORY
                                      Eastern Williams
              Expected average well performance (1)                                                                     Inventory Distribution
              Payout period at $60, $80, $100 per barrel WTI                                                            Net future drilling locations
                                                                                                                                                                                                                      Williams   Mountrail
                                      300
                                                WTI NPV10 $MM                                                                                                                                       Eastern
                                                                                                                                                                                                    Williams
                                                $100                    $16                                           EXTENDED             670
                                      250       $80               $11                                                    CORE
  Cumulative oil production (mbbls)

                                                $60          $6                                                           ~110
                                                                                                                       locations                                                                McKenzie
                                      200                                                                                                                         15%
                                                                         $60
                                                                         WTI                                                                               E. WILLIAMS
                                      150                $80
                                                         WTI                                                                                                                                                                          Dunn
                                                  $100                                                                                                                                                     Billings
                                      100         WTI                                                                    CORE
                                                                                                                         ~560                                                            Development plan
                                                                                                                       locations                                                         ~5-6 wells per 1,280 ft. spacing unit
                                       50
                                                                      Payout: 6 months
                                                                                                                                                                                         MB
                                                                      at $80 WTI
                                       0                                                                                                                                                 TF 1
                                            0      2     4        6     8     10    12 14    16   18   20   22   24
                                                                                   Month                                                                                                 TF 2
                                                Enerplus well                               $50 WTI breakeven well
                                                $60 WTI breakeven well
                                                                                                                                                                                                                                         23
1) See “Expected well performance” in “Advisories”. Well economics at $80 & $100 WTI assume a total well cost of $6.5mm. Well economics at $60 WTI assume a total well cost of $6.0mm.
BAKKEN EXTENDED CORE DRILLING INVENTORY
                                       Murphy Creek
         Expected average well performance (1)                                                                            Inventory Distribution
         Payout period at $60, $80, $100 per barrel WTI                                                                   Net future drilling locations
                                                                                                                                                                                                                         Mountrail
                                       300
                                                 WTI NPV10 $MM                                                                                                                                    Williams
                                                 $100                $11                                                EXTENDED             670
                                       250       $80           $6                                                          CORE
                                                                                                        $60                                                MURPHY
   Cumulative oil production (mbbls)

                                                 $60     $2                                             WTI                 ~110
                                                                                                                                                            CREEK
                                                                                                                         locations
                                       200                                                                                                                                                      McKenzie
                                                                           $80
                                                                           WTI                                                                                                                                        Murphy
                                                                                                                                                                                                                       Creek
                                       150                    $100
                                                              WTI                                                                                                                                                              Dunn
                                                                                                                                                                                                           Billings
                                       100                                                                                 CORE
                                                                                                                           ~560                                                          Development plan
                                                                                                                         locations                                                       ~5-6 wells per 1,280 ft. spacing unit
                                        50
                                                                                 Payout: 10 months
                                                                                 at $80 WTI                                                                                              MB
                                        0
                                                                                                                                                                                         TF 1
                                             0      2    4     6     8      10    12 14       16   18   20    22   24
                                                                                 Month                                                                                                   TF 2
                                                 $50 WTI breakeven well                   Enerplus well
                                                 $60 WTI breakeven well
                                                                                                                                                                                                                                 24
1) See “Expected well performance” in “Advisories”. Well economics at $80 & $100 WTI assume a total well cost of $6.5mm. Well economics at $60 WTI assume a total well cost of $6.0mm.
MARCELLUS OVERVIEW
     Core acreage position in the Marcellus dry gas window
                                                                                                                       MARCELLUS POSITION – NE PENNSYLVANIA
    Non-operated position in Marcellus dry gas core
           − 32,700 net acres                                                                                                            Bradford                   Susquehanna

           − 160-170 MMcf/d production(1)

    High quality exposure to robust natural gas prices
           − Low cost structures                                                                                                                               Wyoming
                                                                                                                                            Sullivan
           − Stable production, consistent free cash flow generation
                                                                                                                     Lycoming

  Marcellus production & capital spending                        Marcellus pricing exposure (Apr-Dec)                    Marcellus unhedged annual net operating income
  MMcf/d and $ millions                                          Approx. % of natural gas sales                          Sensitivity to NYMEX ($ millions)                  $320
  200                                                                                                         18%                                               $260
                                                  $45
                                                           $50      Leidy                                                                              $200
   150                                  $31
            $25                                                     TZ6 Non-NY
  100                                                                                      $0.75/Mcf                                      $140
                                                           $25                            2022e portfolio
    50                                                              Gulf Coast                                                   $80
            154                         158      160-170                                 differential below    19%
     0                                                     $0       Other        60%          NYMEX
           2020                        2021       2022e                                                                         $3.00    $4.00         $5.00   $6.00        $7.00
              Production                      Capital                                                         3%
                                                                                                                                          NYMEX Benchmark Price (US$/Mcf)
                                                                                                                                                                               25
1) Enerplus production, net of royalties.
CANADIAN OIL WATERFLOOD PORTFOLIO
 Consistent, low decline production

 Assets under water or polymer flooding                                                   CANADIAN WATERFLOODS

 Portfolio optimized to focus on highest return, strong                    ANTE CREEK

  free cash flow generating assets
 Low decline production                                                                                GILTEDGE

        − Q1 2022 production was ~5,500 BOE/d (94% oil)(1)                                     CADOGAN             Saskatchewan

                                                                                                    MEDICINE HAT
                                                                        British Columbia      Alberta                       FREDA LAKE
  Enerplus has initiated a divestment process for its Canadian assets

                                                                                                                                    26
1) Production is shown on a net after deduction of royalty basis.
EMERGING OPPORTUNITY – DJ BASIN
Northern extension of Wattenberg field
                                                                                             DJ BASIN
 ~34,700 net acres in NW Weld County                                            WYOMING

   − Low entry price achieved through leasing and farm-in activity               COLORADO      2017/2018 - 5 wells online
                                                                                               (4 Codell, 1 Niobrara)
   − Significant oil in place through all Niobrara benches and Codell
                                                                                               2019 - 5 wells online
                                                                                               (4 Codell, 1 Niobrara)
 Well results compare favorably to core DJ oil rates
                                                                                               2020 - 2 wells online
                                                                                               (2 Codell)
 Focused on enhancing well economics through further drilling
                                                                                               2021 – 3 wells online
  & completion optimization                                                           WELD
                                                                                               (3 Codell)

                                                                                                                        MORGAN

                                                                                                               ADAMS

                                                                        DENVER

                                                                                                                                 27
Board of Directors

      Hilary A. Foulkes (Director since February 2014)          Mark A. Houser (Director since March 2022)
                                                                Audit & Risk Management Committee
      Board Chair                                               Compensation & Human Resources Committee
                                                                Reserves, Safety & Social Responsibility Committee

      Judith D. Buie (Director since January 2020)
      Audit & Risk Management Committee                         Susan M. MacKenzie (Director since July 2011)
      Corporate Governance & Nominating Committee               Compensation & Human Resources Committee (Chair)
      Reserves, Safety & Social Responsibility Committee        Reserves, Safety & Social Responsibility Committee

      Karen E. Clarke-Whistler (Director since December 2018)
      Compensation & Human Resources Committee                  Jeffrey W. Sheets (Director since December 2017)
      Corporate Governance & Nominating Committee               Audit & Risk Management Committee (Chair)
      Reserves, Safety & Social Responsibility Committee        Compensation & Human Resources Committee

      Ian C. Dundas                                             Sheldon B. Steeves (Director since June 2012)
                                                                Audit & Risk Management Committee
      President and CEO                                         Reserves, Safety & Social Responsibility Committee (Chair)

      Robert B. Hodgins (Director since November 2007)
      Compensation & Human Resources Committee
      Corporate Governance & Nominating Committee (Chair)

                                                                                                                             28
Advisories
Assumptions
All amounts in this presentation are stated in U.S. dollars unless otherwise specified. All financial information in this presentation has been prepared and presented in accordance with U.S. GAAP, except as noted below under “Non-GAAP Measures”.

Barrels of Oil Equivalent and Cubic Feet of Gas Equivalent
This presentation contains references to "BOE" (barrels of oil equivalent), “MBOE” (one thousand barrels of oil equivalent), and “MMBOE” (one million barrels of oil equivalent). Enerplus has adopted the standard of six thousand cubic feet of gas to one barrel of oil (6 Mcf: 1 bbl) when converting
natural gas to BOEs. BOE, MBOE and MMBOE may be misleading, particularly if used in isolation. The foregoing conversion ratios are based on an energy equivalency conversion method primarily applicable at the burner tip and do not represent a value equivalency at the wellhead. Given that
the value ratio based on the current price of oil as compared to natural gas is significantly different from the energy equivalent of 6:1, utilizing a conversion on a 6:1 basis may be misleading.
Non-GAAP & Other Financial Measures
This presentation includes references to certain non-GAAP financial measures and non-GAAP ratios used by the Company to evaluate its financial performance, financial position or cash flow. Non-GAAP financial measures are financial measures disclosed by a company that (a) depict historical or
expected future financial performance, financial position or cash flow of a company, (b) with respect to their composition, exclude amounts that are included in, or include amounts that are excluded from, the composition of the most directly comparable financial measure disclosed in the primary
financial statements of the company, (c) are not disclosed in the financial statements of the company and (d) are not a ratio, fraction, percentage or similar representation. Non-GAAP ratios are financial measures disclosed by a company that are in the form of a ratio, fraction, percentage or similar
representation that has a non-GAAP financial measure as one or more of its components, and that are not disclosed in the financial statements of the company. These non-GAAP financial measures and non-GAAP ratios do not have standardized meanings or definitions as prescribed by U.S.
GAAP and may not be comparable with the calculation of similar financial measures by other entities. Please see Management’s Discussion & Analysis for the composition of each non-GAAP measure, the identified GAAP equivalency to the extent one exists, a reconciliation of the measure to the
mostly directly comparable GAAP financial measure and details on the usefulness of the measure for the reader. These non-GAAP financial measures and non-GAAP ratios should not be considered as a substitute for, or superior to, measures of financial performance prepared in accordance with
GAAP. Please see “Non-GAAP Measures” in the latest MD&A for more detail.
Other financial measures include supplementary financial measures and capital management measures. Supplementary financial measures are disclosed by a company that (a) are, or are intended to be, disclosed on a periodic basis to depict the historical or expected future financial performance,
financial position or cash flow of a company, (b) are not disclosed in the financial statements of the company, (c) are not non-GAAP financial measures, and (d) are not non-GAAP ratios. The following section provides an explanation of the composition of those supplementary financial measures if
not previously provided: (a) “Capital spending” - Capital and office expenditures, excluding other capital assets/office capital and property and land acquisitions and divestments. (b) “Cash general and administrative expenses” or “Cash G&A expenses” - General and administrative expenses that
are settled through cash payout, as opposed to expenses that relate to accretion or other non-cash allocations that are recorded as part of general and administrative expenses; and (c) “Cash share-based compensation” or “Cash SBC expenses” - share-based compensation that is settled by way of
cash payout, as opposed to equity settled
Capital management measures are financial measures disclosed by a company that (a) are intended to enable an individual to evaluate a company’s objectives, policies and processes for managing the company's capital, (b) are not a component of a line item disclosed in the primary financial
statements of the company, (c) are disclosed in the notes to the financial statements of the company, and (d) are not disclosed in the primary financial statements of the company. The following section provides an explanation of the composition of those capital management measures if not
previously provided: “Net Debt” - “Net Debt” is calculated as current and long-term debt associated with senior notes plus any outstanding Bank Credit Facilities balances, less cash and cash equivalents. For further details, see Note 15 to the Interim Financial Statements.
Presentation of Production and Reserves Information
All production volumes presented in this presentation are reported on a "net" basis (the Company's working interest share after deduction of royalty obligations, plus the Company's royalty interests), unless expressly indicated that it is being presented on a "gross" basis. Previously, the Company
presented production volumes on a "company interest" basis, which was calculated as its working interest share before deduction of royalties plus the Company's royalty interests. With these changes, production volumes presented by the Company on a "net" basis are expected to be lower than
those presented historically. All reserves information presented herein are reported in accordance with Canadian reserve evaluation standards under National Instrument 51-101 – Standards of Disclosure for Oil and Gas Activities (“Canadian NI 51-101 Standards”), except certain reserves information
effective December 31, 2021 in accordance with the provisions of the Financial Accounting Standards Board’s ASC Topic 932 Extractive Activities – Oil and Gas, which generally utilize definitions and estimations of proved reserves that are consistent with Rule 4-10 of Regulation S-X promulgated
by the U.S. Securities and Exchange Commission (collectively, the "U.S. Rules"), but does not necessarily include all of the disclosure required by the SEC disclosure standards set forth in Subpart 1200 of Regulation S-K (the "U.S. Standards"). The practice of preparing production and reserves data
under the Canadian NI 51-101 Standards differs from the U.S. Rules and the presentation of production and reserves data under the Canadian Standards differs from presentation under the U.S. Standards. Please refer to our 2021 reserves news release for further information. All references to
"liquids" in this presentation include light and medium crude oil, heavy oil and tight oil (all together referred to as "crude oil") and NGLs on a combined basis. All references to "natural gas" in this presentation include conventional natural gas and shale gas on a combined basis. Enerplus’ oil and gas
reserves statement for the year ended December 31, 2021, which will include complete disclosure of our oil and gas reserves and other oil and gas information prepared under the Canadian NI 51-101 Standards and also certain information about our oil and gas reserves prepared in accordance with
the U.S. Rules, is contained within our Annual Information Form (AIF) for the year ended December 31, 2021 which is available on our website at www.enerplus.com and under our SEDAR profile at www.sedar.com. Additionally, our AIF forms part of our Form 40-F that is filed with the U.S.
Securities and Exchange Commission and is available on EDGAR at www.sec.gov. Readers are also urged to review the Management’s Discussion & Analysis and financial statements filed on SEDAR and as part of our Form 40-F on EDGAR concurrently with this presentation for more complete
disclosure on our operations.
Drilling Inventory and Expected Well Performance
Drilling locations associated with proved plus probable undeveloped reserves have been evaluated or reviewed by Enerplus’ independent qualified reserves evaluators in accordance with the COGE Handbook. Drilling locations associated with unrisked “best estimate” economic
contingent resources in “development pending” project maturity sub-class have been evaluated by Enerplus’ independent qualified reserves evaluators, McDaniel & Associates Ltd in the case of North Dakota in accordance with the COGE Handbook. Unbooked future drilling
locations are not associated with any reserves or contingent resources of Enerplus and have been identified by Enerplus and have not been audited by Enerplus’ independent qualified reserves evaluators. Existing Enerplus net locations in North Dakota as at 1 Jan 2022 are 920 and
comprise 316 2P undeveloped reserves locations, 284 best estimate contingent resources locations and 320 unbooked future locations. The Enerplus expected well performance comes from analyzing historical well productivity within the geographic area outlined in the locator box
on the maps on the respective slides. The data set analyzed excludes wells completed before 2016 and the Enerplus expected well is an average of our future planned inventory. Payout times and NPVs are calculated assuming a $6.5MM capital well cost.                                              29
Contacts
Investor Relations Contacts
Drew Mair
Manager, Investor Relations & Corporate Planning
403-298-1707

Krista Norlin
Sr. Investor Relations Analyst
403-298-4304

Email: investorrelations@enerplus.com

                                                   30
You can also read