(IPLAN) Illinois Project for the Local Assessment of Needs 2017 2022
←
→
Page content transcription
If your browser does not render page correctly, please read the page content below

Illinois Project for the
Local Assessment of Needs
         (IPLAN)
       2017 – 2022

             001
Clay County Health Department
                                  IPLAN 2017 - 2022

                                 Table of Contents

Board of Health Review / Approval ……………………………………………………………………………..………………. pg. 3
Introduction ………………………………………………………………………………………………………………………………… pg. 4
Statement of Purpose …………………………………………………………………………………………………………………. pg. 4
Phase 1: Organize for Success……………………………………………………………………………………………………. pg. 5
Phase 2: Visioning ……………………………………………………………………………………………………………………… pg. 6
Phase 3: Assessments
        Local Public Health System Assessment ………………………………………………………………………….. pg. 9
        Community Themes and Strengths Assessment ……………………………………………………………… pg. 10
        Forces of Change Assessment ………………………………………………………………………………………... pg. 12
        Community Health Status Assessment ……………………………………………………………………………. pg. 13
Phase 4: Identify Strategic Issues………………………………………………………………………………………………… pg. 14
Phase 5: Formulate Goals and Strategies…….……………………………………………………………………………… pg. 14
Phase 6: Action Cycle ………………………………………………………………………………………………………………… pg. 15

Appendix A – Community Health Assessment ……………………………………………………………………………. pg. 16
Appendix B – Community Health Improvement Plan…………………………………………….……………………. pg. 63

                                        002
003

004

005

Phase 1: Organize for Success

Purpose
The first phase of MAPP involves two key components: 1) organizing the planning process and 2)
developing the planning partnership. The purpose of this phase is to structure a planning process that
builds commitment, engages participants as active partners, uses participants’ time well, and results in a
plan that can be realistically implemented.

The Process

Planning Process
In October 2016, the Health for Generations (H4G) Coalition met to begin the MAPP planning process.
This core planning team was responsible for identifying the purpose, goals and potential barriers for the
MAPP process. Additionally, the team brainstormed organizations and coalitions that exist in our
community who could participate in the process.

Partnership Development
After the October 2016 meeting, Clay County Health Department sent invitations to participate in MAPP
via email and mail to approximately 80 individuals. Our goal was to recruit broad community
representation and select key stakeholders that would be active participants throughout the MAPP
process. Potential committee members received an invitation with information about MAPP and four
meeting dates between November 2016 and April 2017. In total, 43 of the invited organizations
participated including representatives from the medical and hospital community, mental health and
social service organizations, the cooperative extension service, schools, voluntary organization, business
community, and faith community.

Supporting Documents:
Appendix A, Community Health Assessment, IPLAN Committee Participation, p. 46

                                                   006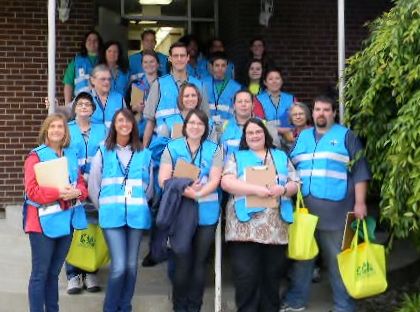
Phase 2: Visioning

Purpose
The purpose of visioning is to engage community members in a creative process that leads to a shared
community vision and common values. From this creative process, participants collectively develop
vision and mission statements that provide focus, purpose, and direction to the MAPP process.

Process
In November 2016, the IPLAN Committee (aka Health for Generations or H4G) convened to participate
in the visioning process. Images from magazines were cut out and spread across a table. Each participant
looked through the images and picked 2-3 images that answered the question “What does a healthy
Clay County look like to you?” The participants were then instructed to write down three words that
described the images they chose. The facilitator encourages individuals to share the images and words
they chose. The facilitator emphasized that these values should guide the MAPP process and reflect
what is important to the Committee.

From this meeting, the committee created a mission statement that identifies what the Committee
should strive to achieve throughout the MAPP process. The vision statement provides a compelling and
inspirational image of what the community will look like in the future. A wordle image (below) was
generated from the words that people wrote down during the visioning activity. A draft of the statement
was emailed to all Health for Generation Coalition members after the meeting to solicit their comments.

                                              Vision Statement
The Clay County Health for Generations Coalitions envisions an environment that supports a healthy
lifestyle and health prevention activities that start early. We envision a public health system that is
diverse and collaborative that encourages broad participation and effectively reaches the whole
population, including the most vulnerable members of our community.

                                                    007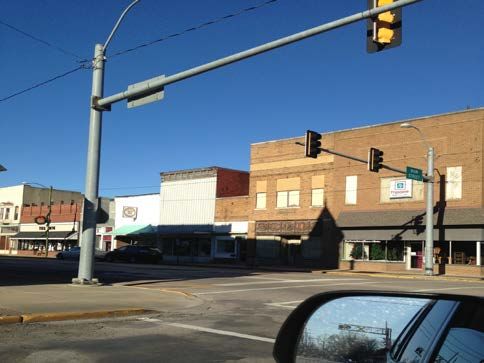
Phase 3: Local Public Health System Assessment

Purpose
The purpose of the Local Public Health System Assessment (LPHSA) is to assess local public health
system’s capacity to provide the 10 Essential Public Health Services (EPHS) to the community. The local
public health system includes all public, private, and voluntary entities that contribute to the delivery of
public health services.

Process
The local public health system assessment (LPHSA) was conducted over the course of a month by
meeting with local stakeholders and asking them to rate performance for each of the essential services
on a scale of “no activity” to “optimal activity.” The tool was developed by NACCHO and CDC as part of
the National Public Health Performance Standards Program (NPHPSP). The NPHPSP is a valuable tool in
identifying areas for system improvement, strengthening partnerships, and assuring that a strong
system is in place for effective response to day-to-day public health issues as well as public health
emergencies.

Data Analysis
Scores from the NPHPSP assessments were entered into the CDC’s National Public Health Performance
Standards Program website, which produced the Local Public Health System Performance Assessment
(LPHSPA) Report of Results.

Results

Highest Scores:
    • ES #1: Monitor Health Status to Identify Community Health Problems
    • ES #4: Mobilize Community Partnerships to Identify and Solve Health Problems
    • ES #7: Link to Health Services
    • EPHS #3: Inform, Educate, and Empower People about Health Issues

Lowest Scores:
   • ES# 9: Evaluate Effectiveness, Accessibility, and Quality of Personal and Population-Based Health
       Services
   • ES #6: Enforce Laws
   • ES #10: Research Innovations

Documentation:
Local Public Health System Performance Assessment Report of Results
http://www.healthdept.org/images/Community/Local_Public_Health_System_Assessment_-
_Feb._2017.pdf

                                                     008
Phase 3: The Assessments
                                 Forces of Change Assessment

Purpose
The Forces of Change Assessment (FOCA) is designed to answer the following questions: “what is
occurring or might occur that affects the health of our community or the local public health system” and
“What specific threats or opportunities are generated by these occurrences?” During this phase,
participants engage in brainstorming sessions aimed at identifying forces such as trends, factors, or
events that are or will be influencing the health and quality of life of the community.

Process
In February, 2017, the Health for Generations Committee conducted the Forces of Change Assessment.
Committee members were provided a brief tutorial on the forces of change and collaboratively
brainstormed local events, trends, and factors that could influence the health and quality of life of the
community. This activity generated a discussion on how to mitigate potential threats that may inhibit
community health and how to capitalize on potential opportunities as we develop our community
health improvement plan.

Supporting Documents:
Appendix A, Community Health Assessment
   • Forces of Change Brainstorming Chart, p. 43

                                                   009
Phase 3: The Assessments
                      Community Themes and Strengths Assessment

Purpose
The Community Themes and Strengths Assessment (CTSA) is designed answer the following questions:
“What is important to our community?” “How is quality of life perceived in our community?” and
“”What assets do we have that can be used to improve community health?”

The Process
The Community Themes and Strengths Assessment (CTSA) was completed using three different
strategies to try to obtain broad community input.

Strategy 1: Community Assessment for Public Health Emergency Response (CASPER) Survey
Strategy 2: Windshield Survey
Strategy 3: Focus Groups

The Health for Generations Coalition was involved in the design of each strategy, and the results of each
strategy were shared with the Coalition.

Strategy 1: CASPER Survey Method
In May 2016, the Clay County Health Department deployed MRC volunteers to conduct a Community
Assessment for Public Health Emergency Response (CASPER). CASPER, a CDC tool, interviews citizens in
sampled households door-to-door about their public health needs. While CASPERS were developed to
assess community needs after natural disasters or emergencies, the Clay County Health Department
used this method to rapidly gain primary source public health data for use in the CTSA.

The survey tool was developed with input from the Health for Generations Coalition and consisted of six
sections: basic household information, household emergency plans, home and neighborhood safety,
nutrition and physical activity, access to healthcare services and Clay County’s overall health. No
personally identifying information was collected.

The basic method for the CASPER is to use Geographic Information Systems to randomly select 30
census blocks with probability proportional l to size. In each of these 30 “clusters”, seven houses are
randomly selected to interview. Volunteer teams were trained on the household selection method to
ensure that they were chosen randomly.

Residents of the selected households who were at least 18 years of age or older were considered eligible
to participate. Teams were instructed to get verbal consent from the resident before proceeding with
the interview.

                                                   010
For more detailed explanation of the CASPER data collection and analysis methodology, reference the
“CASPER Final Report and Results” at http://www.healthdept.org/images/Community/Report%20-
%20Clay%20County%20Health%20Department%20Final%20Report.pdf.
Over the weekend of May 20th and May 21st 2016, interview teams were able to conduct 149 interviews.
20 additional interviews were conducted the following week (May 23rd- May 25th), for a total of 169
interviews.
Strategy 2: Focus Groups
Four focus groups were conducted among Pre-K parents, High School Students, and Senior Citizens using
the Yale University Program for Recovery and Community Health Report’s 2009 qualitative analysis
methods.
Strategy 3: Windshield Assessment
A windshield assessment was used to get a sense of the community and its characteristics from the
viewpoint of a new resident to Clay County. This method was adapted from the Community Tool Box, a
public resource developed and maintained by the University of Kansas.
Supporting Documents:
Appendix A, Community Health Assessment
• CASPER Results, p. 6
• Focus Group Results, p. 6
• Windshield Assessment Results, p. 7
011Phase 3: The Assessments
Community Health Status Assessment
Purpose
The Community Health Status Assessment (CHSA) answers the questions, “How healthy are our
residents” and “What does the health status of our community look like?” The results of the CHSA
provide the IPLAN Committee with an understanding of the community’s current health status and
identify trends and emerging health issues affecting the community (e.g. high obesity rates or low
immunization rates).
Method
The MAPP Community Health Status Assessment (CHSA) method was followed. This includes gathering
core indicators for broad-based categories and comparing the data to trend information and to peers,
state, and national data. Healthy People 2020 (HP2020) is a nationwide agenda created by the US
Department of Health and Human Services that provides 10-year national objectives for improving the
health of all Americans. HP2020 provides national benchmarks and goals that are applicable at the
national, state, and local levels. Clay County health data was compared to HP2020 target measures
whenever possible.
The broad-based categories analyzed in the assessment include:
• Demographic and Socioeconomic Characteristics
• General Health and Access to Care Indicators
• Maternal and Child Health Indicators
• Chronic Disease Indicators
• Environmental, Occupation, and Injury Control Indicators
• Sentinel Events
Data Sources
Health indicator data is compiled from a variety of primary and secondary data sources to create the
Clay County Community Health Profile Report. These data sources include but are not limited to the
IPLAN Data System, Illinois Behavioral Risk Factor Surveillance System (BRFSS), Illinois Department of
Public Health (IDPH), Illinois Department of Transportation, US Census Bureau, Centers for Disease
Control and Prevention, American Cancer Society, National Institutes of Health, and many more.
Supporting Documents:
Appendix A, Community Health Assessment, p. 9-40
012Phase 4: Identify Strategic Issues
Purpose
During this phase of the MAPP process, participants developed a list of the most important issues facing
the community. Strategic issues are identified by reviewing the results of the four MAPP Assessments
and determining which issues will be specifically addressed in the community health improvement plan
(CHIP).
Process
In February 2017, the IPLAN Committee completed the four MAPP assessments. The next step was to
use the results of the four MAPP assessments to identify the top 3 strategic issues. Once the top 3
strategic issues were identified, the Committee could being development of the CHIP.
Each Health for Generations Coalition (H4G) member was asked to select the top five strategic issues in
our community. Responses were collected via SurveyMonkey, a web-based survey tool. In March 2017,
the H4G members were emailed the link to the survey and given two weeks to submit responses.
The results were compiled and prioritized based on the nominal group technique. The results of the
survey were shared with the Committee in March 2017.
Top 3 strategic issues:
• Tobacco and Substance Use
• Heart Disease and Obesity
• Access to Care and Cancer
Phase 5: Formulate Goals and Strategies
See Supporting Document:
Appendix B, Community Health Improvement Plan
013Phase 6: The Action Cycle
Purpose
During this phase of the MAPP process, the community implements the community health improvement
plan developed during the Formulate Goals and Strategies Phase.
Process
In May, 2017, the Clay County Board of Health formally adopts Clay County Community Health
Improvement Plan 2017-2022.
014Appendix A – Community Health Assessment
COMMUNITY HEALTH
ASSESSMENT
Clay County, IL
2017-
2022
Prepared by the Clay County Health Department in March 2017
015Table of Contents
Acknowledgements…………………………………………………………………………………………………………………………………………..3
Introduction……………………………………………………………………………………………………………………………………………………..4
Methods…………………………………………………………………………………………………………………………………………………………..5
Vision Statement………………………………………………………………………………………………………………………………………………8
Demographics…………………………………………………………………………………………………………………………………………………..9
Indicators Section……………………………………………………………………………………………………………………………………………16
• General Health/Access to Health Care
o Leading Causes of Death………………………………………………………………………………………………………….16
o Access to Health Care Professionals…………………………………………………………………………………………17
o Health Care Utilization……………………………………………………………………………………………………………..18
• Maternal and Child Health
o Teen Births………………………………………………………………………………………………………………………………20
o Infant Mortality and Birth Characteristics………………………………………………………………………………..21
• Chronic Diseases
o Cancer……………………………………………………………………………………………………………………………………..22
o Respiratory Conditions…………………………………………………………………………………………………………….25
o Heart Disease ………………………………………………………………………………………………………………………….26
o Obesity…………………………………………………………………………………………………………………………………….27
• Health Behaviors
o Physical Activity……………………………………………………………………………………………………………………….28
o Nutrition………………………………………………………………………………………………………………………………….30
o Smoking…………………………………………………………………………………………………………………………………..31
o Substance Use………………………………………………………………………………………………………………..……….33
• Infectious Disease
o Sexually Transmitted Infections……………………………………………………………………………………………….34
o Other Communicable Diseases………………………………………………………………………………………………..35
• Environmental
o Built Environment……………………………………………………………………………………………………………………36
o Climate and Air Quality……………………………………………………………………………………………………………38
• Injury…………………………………………………………………………………………………………………………………………………..39
• Sentinel Events……………………………………………………………………………………………………………………………………40
Local Public Health System Assessment………………………………………………………………………………………………………….41
Forces of Change Assessment………………………………………………………………………………………………………………………..43
Community Participation……………………………………………………………………………………………………………………………….46
Supporting documents available on the Clay County Health Department Website:
• Community Health Status Assessment
• Community Strengths and Themes Assessment
• Local Public Health Assessment
2
016•
Acknowledgments
This project could not have been possible without the support and contribution of many people and
organizations across Clay County. A sincere thank you goes to the Health for Generations Coalition members
for their time, dedication, expertise and contributions. Additional thanks to the participants in focus groups,
surveys, and the staff from many agencies that helped us include the voices of diverse sectors across Clay
County.
Support for this project was provided by:
Clay County Counseling Services
Coalition Against Drug Abuse
Clay County Health Department Staff
Clay County Medical Reserve Corps
Clay County Hospital
City of Flora
Christopher Rural Health Planning Corps
University of Illinois Extension
Sherwin Williams
Flora School District
American Red Cross
Clay County Food Pantry
Country Financial
Golden Circle Nutrition Program
Clay County Farm Bureau
Heritage Woods
CEFS Public Transit
Southern Illinois Counseling Center
Clay Home Health and Hospice
Clay County Board
Richland Memorial Hospital
3
017Introduction
Statement of Purpose: In October 2016, the Clay County Health Department began preparations to engage in
a community health planning process known as the Illinois Project for the Local Assessment of Needs (IPLAN).
IPLAN was developed by the Illinois Department of Public Health (IDPH) to meet the requirements set forth in
77 Illinois Administrative Code 600. This administrative code mandates that all certified local health
departments in Illinois conduct an IPLAN process every five years for recertification. IPLAN requires local
health departments to create an organizational strategic plan, conduct a community health needs assessment,
and develop a community health plan.
The administrative code allows local health departments to use an equivalent planning process for completing
IPLAN. The Clay County Health Department utilized the Mobilizing for Action through Planning and Partnership
(MAPP) framework to conduct IPLAN 2017-2022.
Mobilizing for Action through Planning and Partnerships (MAPP)
Mobilizing for Action through Planning and Partnerships is a strategic approach to community health
improvement. The MAPP tool is a community health improvement planning process developed by the
National Association of County and City Health Officials (NACCHO) in collaboration with the Centers for
Disease Control and Prevention (CDC) and is designed to emphasize a community-driven and community-
owned approach. The Clay County Health Department elected to utilize MAPP for its IPLAN process because of
MAPP’s emphasis on creating a truly community-driven health improvement plan. MAPP consists of 6 phases.
Phase 1: Organize for Success
Phase 2: Visioning
Phase 3: The Four Assessments
• Local Health System Assessment
• Community Themes and Strengths Assessment
• Forces of Change Assessment
• Community Health Status Assessment
Phase 4: Identify Strategic Issues
Phase 5: Formulate Goals and Strategies
Phase 6: Action Cycle
4
018Methods
Partnership Development: The Health for Generations Coalition brainstormed organizations and coalitions
that exist in our community who could participate in the process. The Clay County Health Department sent
invitations to participate to approximately 80 individuals. Our goal was to recruit broad community
representation and select key stakeholders that would be active participants throughout the MAPP process. In
total, 43 of the invited individuals participated, including representatives from the medical and hospital
community, mental health, and social service organizations, the cooperative extension services, schools,
volunteer organizations, the business community and faith community (See IPLAN Committee Participation in
supporting documents section).
Visioning: The Health for Generations Coalition convened in November, 2017 to create a vision for the
community. Participants looked through images from magazines and chose ones that they thought answered
the questions “What does a healthy Clay County look like to you?”, “What is your vision for Clay County?” The
participants shared their images and a mission and vision statement was created as a group.
Community Health Status Assessment: Data indicators were chosen to answer the questions, “How healthy
are our residents?” and “What does the health status of our community look like?” Core indicators for broad-
based categories were chosen from secondary data sources and compared to peers, state, and national data.
Additionally, the core indicators were compared with national Health People 2020 targets whenever possible.
Healthy People 2020 (HP2020) is a nationwide agenda created by the US Department of Health and Human
Services that provides 10-year national objectives for improving the health of all Americans. HP2020 provides
national benchmarks and goals that are applicable at the national, state, and local level. Clay County Health
data was compared to HP2020 target measures whenever possible.
Secondary Data Sources:
I-PLAN Data System Center for Disease Control and Prevention (via CDC
Illinois Behavioral Risk Factor Surveillance System WONDER)
(BRFSS) U.S. Department of Health and Human Services,
Illinois Department of Public Health, Vital Statistics Health Resources and Service Administration, Area
Illinois Department of Transportation Health Resource File
U.S. Census Bureau, American Community Survey University of Wisconsin, County Health Rankings. 2016
Small Area Income and Poverty Estimates Illinois Department of Children and Family Services
State Cancer Profiles Illinois Youth Survey, Clay County 2016
U.S. Environmental Protection Agency Dartmouth Collect Institute for Health Policy, Atlas of
CDC, National Vital Statistics System Health Care
Illinois Department of Public Health, Birth Feeding America
Characteristics National Diabetes Surveillance System; Diabetes Atlas
National Oceanic and Atmospheric Administration, National Center for HIV/AIDs, Viral Hepatitis, STD, TB
North America Land Data Assimilation System Prevention
CDC, Division of Nutrition, Physical Activity and Fatality Analysis Reporting System
Obesity Uniform Crime Reporting Program
5
019Community Themes and Strengths Assessment: A variety of methods were used to get primary data to
answer the questions: “What is important to our community?” “How is quality of life perceived in our
community?” and “What assets do we have that we can use to improve community health?”
Surveys: In May 2016, the Clay County Health
Department deployed MRC volunteers to conduct a
Community Assessment for Public Health Emergency
Response (CASPER). CASPER, a CDC tool, interviews
citizens in sampled households door-to-door about
their public health needs. The survey tool was
developed with input from the Health for Generations
Coalition and consisted of six sections: basic
household information, household emergency plans,
home and neighborhood safety, nutrition and physical activity, access to healthcare services and Clay
County’s overall heath. No personally identifying information was collected. The basic method is to use
Geographic Information Systems to randomly select 30 census blocks with probability proportional to
population size. In each of the 30 census blocks, seven houses are randomly selected to interview.
Residents of the selected households who were at least 18 years of age or older were considered
eligible to participate. Results were generalized to the entire county. More detailed information about
the data collection and analysis methodology can be found in the “CASPER Final Report” document on
the Clay County Health Department’s Website.
Focus Groups: In February 2017, the Clay County Health Department conducted focus groups with
community members. Members of the focus groups represented broad interest in the community,
including those members of medically underserved, low-income, and populations that are at higher
health risk.
Focus Group Date of Meeting # of Participants
Clay City Pre-K Parents 2/7/2017 22
North Clay Pre-K Parents 2/9/2017 10
Flora and North Clay High School Students 2/16/2017 17
Senior Citizen Group 2/21/2017 10
To perform the analysis on the focus group data there were three main steps. The Yale University
Program for Recovery and Community Health Report’s (2009) qualitative analysis methods were
followed. First, notes were taken at each focus group and a recording made. Common themes were
created based on the number of times each theme was mentioned and evidence from each focus
group was used to support the chosen themes. A full report with results is available by request from
the Clay County Health Department. The results of the focus groups are integrated throughout the
report. Specific quotes are included in “voices of the community” speech bubbles.
6
020Windshield Survey: A new resident to Clay County provided outside perspective to the strengths and
themes of the community by performing a systematic assessment through observations made from a
moving vehicle. The methodology for the windshield survey was adapted from the Community Tool
Box, a public resource developed and maintained by the University of Kansas. The general guidelines
for conducting a windshield survey were used to develop and direct the survey for Clay County, Illinois.
The survey was conducted between October 2016 and February 2017. Throughout this time period,
over 200 road miles were observed at various times and days of the week. A full report with the results
is available by request from the Clay County Health Department. Pictures and comments are integrated
throughout this report.
Local Public Health System Assessment: This assessment is intended to answer the questions, “What are the
components, activities, competencies, and capacities of our local public health system?” and “How are the
Essential Services of Public Health being provided in our community?” To complete this assessment, several
small group meetings with stakeholders were held during the month of February, 2017. Within each of the 10
Essential Services, model standards that describe the key aspects of an optimally performing public health
system, were rated by on a scale of “no activity” to “optimal activity.” Notes from the discussion were
recorded as well as scores. A full copy of the report is available on Clay County Health Department’s website.
Force of Change Assessment: This assessment is intended to answer the questions, “What is occurring or
might occur that affects the health of our community?” and “What specific threats or opportunities are
generated by these occurrences?” The Health for Generations Coalition was provided a brainstorming
worksheet one week before the February 2017 meeting. During the meeting, the committee discussed various
trends, factors, and events that could influence the health and quality of life in our community.
7
021Vision Statement
The Clay County Health for Generations Coalitions envisions an environment that supports a healthy lifestyle
and health prevention activities that start early. We envision a public health system that is diverse and
collaborative that encourages broad participation and effectively reaches the whole population, including the
most vulnerable members of our community.
Voices of the Community
“Everyone knows everyone”
“Everyone is friendly”
“We are supportive of each other”
“It’s home to me!“
“Low crime rates”
“I love the nature and Charley Brown Park” Why do you like
“I can work near where my children go to living in Clay
school County?
8
022Demographics
Clay County is a rural community located in the Southeastern portion of Illinois. The county has a total
population of 13,675 residents. This is a 1.8% decrease in population since 2010. Despite the decrease in
total population, there was an increase in the population of 20-24 year olds, and 60-64 year olds between the
2010 Census and 2014 American Community Survey.
The county has an aging population. Since 2010, the median age has risen from 41.6 years to 42.7 years in
2010.
Table 1.1: Population
Characteristics
percent
Clay % of IL % of
change
Population 2010 2012 2014 population population
since
2014 2014
2010
Total population 13,927 13,828 13,675 100.0 100.0 -1.8%
Male 6,749 6,753 6,745 49.3 % 49.1 % -0.1%
Female 7,178 7,075 6,930 50.7 % 50.9 % -3.5%
Age
Under 5 909 880 840 6.1 % 6.3 % -7.6%
5 to 9 847 925 832 6.1 % 6.6 % -1.8%
10 to 14 942 848 967 7.1 % 6.7 % 2.7%
15 to 19 910 903 838 6.1 % 6.9 % -7.9%
20 to 24 693 712 832 6.1 % 6.9 % 20.1%
25 to 34 1,498 1,478 1,446 10.6 % 13.8 % -3.5%
35 to 44 1,781 1,651 1,516 11.1 % 13.2 % -14.9%
45 to 54 2,091 2,038 1,939 14.2 % 14.2 % -7.3%
55 to 59 913 988 934 6.8 % 6.6 % 2.3%
60 to 64 851 919 1,047 7.7 % 5.6 % 23.0%
65 to 74 1,206 1,233 1,280 9.4 % 7.2 % 6.1%
75 to 84 925 924 881 6.4 % 4.1 % -4.8%
85 + 361 329 323 2.4 % 1.9 % -10.5%
Median age (years) 41.6 42.5 42.7 (X) 37.0 (X)
U.S. Census Bureau, 2010-2014
American Community Survey
9
023Table 1.2: Race/Ethnicity Distribution
Race Distribution
Race 2010 Percent 2014 Percent % Change
Total Population 13,927 100.0% 13,675 100.0% -1.8%
One Race 13,813 99.2% 13,531 98.9% -2.0%
White 13,675 98.2% 13,365 97.7% -2.3%
Black or African American 44 0.3% 55 0.4% 25.0%
American Indian and Alaska Native 4 0.0% 58 0.4% 1350.0%
Asian 7 0.1% 17 0.1% 142.9%
Native Hawaiian/Pacific Islander 0 0.0% 0 0.0% 0.0%
Other Race 19 0.1% 36 0.3% 89.5%
Two or More Races 114 0.8% 144 1.1% 26.3%
Hispanic or Latino* 129 0.9% 179 1.3% 38.8%
Source: U.S. Census Bureau, 2010-2014 American Community Survey
Clay County has a predominantly white population, accounting for 97.7% of the county’s total population. The
racial makeup of the remaining 2.3% are 0.4% Black or African American, 0.4% American Indian or Alaskan
Native, 0.1% Asian, 1.1% two or more races, and 0.3% of other race. People of Hispanic or Latino origin of any
race accounted for 1.3% of the population. Only 3.2% of Clay County speaks a language other than English,
with the predominant minority language being Spanish (2.6%).
Table 1.3 Languages Spoken
Languages
Speak only English 96.80%
Speak a language other than
English 3.20%
Spanish 2.60%
Other Indo-European language 0.40%
Asian and Pacific Island language 0.10%
Source: U.S. Census Bureau,2010- 2014
American Community Survey
Since 2010, the percentage of Clay County residents age 25+ with a high school degree or higher remains
consistent with State levels. In Clay County the percentage of residents (13.4%) with at least a bachelor’s
degree is still much lower compared to the state at 31.9%.
Table: 1.4: Educational Attainment by Percent of Population Age 25+
2010 2014
Level of Education Clay IL Clay IL
Less that High
School 13.8% 13.1% 12.6% 12.4%
High School grad or
higher 86.2% 86.0% 87.3% 87.5%
Bachelors or higher 13.8% 30.7% 13.4% 31.9%
Source: U.S. Census Bureau,2010- 2014 American Community Survey
10
024Figure 1.1 Median Household Income
Median Household Income, 2004-2014
$70,000
$60,000 $57,458
Income in Dollars
$50,000
$40,000 $45,709
$30,000
$20,000 Clay Illinois
$10,000
$0
2004 2005 2006 2007 2008 2009 2010 2011 2012 2013 2014
Data Source: “Small Area Income and Poverty Estimates,” US Census Bureau. 2004-2014
Figure 1.3 Population in Poverty
Percent of Population in Poverty, 2004-2014
16.5%
15.5%
14.5%
13.5%
Percent
12.5%
11.5%
10.5%
9.5%
Clay Illinois
8.5%
7.5%
2004 2005 2006 2007 2008 2009 2010 2011 2012 2013 2014
Data Source: “Small Area Income and Poverty Estimates,” US Census Bureau. 2004-2014
In 2014 (latest available data), the median household income in Clay County was $45,709 compared to the
State median household income of $57,458. The Flora area has the lowest median household income. The
percentage of the population living in poverty in Clay County has decreased slightly below the state average.
An estimated 13.6% of Clay County residents were living in poverty compared to 14.3% of the State.
The County’s unemployment rate, as of 2014 (5.8%) has decreased since its peak in 2009 (12.4%), and is
currently comparable to the State (5.5%) and National averages (5.6%). Clay County has more than the State
and National averages of residents receiving public assistance income, SNAP, and Medicaid (Data source: U.S.
Census Bureau, American Community Survey, 2010-2014). In 2016, 42% of children lived in single-parent
households, compared to 32% in Illinois. (Source: U.S. Census Bureau, American Community Survey, 2010-
2014).
11
025Demographics
Identifying Vulnerable Populations
The Institute of Medicine defines vulnerable populations as a group of people with certain characteristics that
cause them to be at greater risk of having poor health outcomes than the general populations. These
characteristics include, but are not limited to age, culture, disability, education, ethnicity, health insurance,
housing status, income, mental health and race.
Population with a disability: This indicator reports the percentage of the total civilian non-institutionalized population
with a disability. This indicator is relevant because disabled individuals comprise a vulnerable population that requires
targeted services and outreach by providers.
Table 1.5 Population with a disability Percent Population with a
Total Population Disability
Report Total Population with Percent Population
(For Whom Disability
Area a Disability with a Disability
Status Is Determined)
Clay
13,484 2,318 17.19%
County, IL
Illinois 12,690,056 1,347,468 10.62%
United Clay County, IL
309,082,272 37,874,568 12.25% (17.19%)
States
Illinois (10.62%)
Data Source: US Census Bureau, American Community Survey. 2010-14. Source
United States
geography: Tract
(12.25%)
Figure 1. 3 Map of Population with a disability
Disabled Population, Percent by
Tract, ACS 2010-14
Over 18.0%
15.1 - 18.0%
12.1 - 15.0%
Under 12.1%
No Data or Data Suppressed
Report Area
12
026Population with Limited English Proficiency: This indicator reports the percentage of the population aged 5 and older
who speak a language other than English at home and speak English less than "very well." This indicator is relevant
because an inability to speak English well creates barriers to healthcare access, provider communications, and health
literacy/education.
Clay County has a total of 133 residents who reported understanding English less than “very well”.
Figure 1.4 Map of Population with Limited English
Population with Limited English Proficiency, Percent by Tract,
ACS 2010-14
Over 4.0%
2.1 - 4.0%
1.1 - 2.0%
Under 1.1%
No Data or Data Suppressed
Report Area
Data Source: US Census Bureau, American Community Survey. 2010-14. Source geography: Tract
Veteran Population: This indicator reports the percentage of the population age 18 and older that served (even for a
short time), but is not currently serving, on active duty in the U.S. Army, Navy, Air Force, Marine Corps, or the Coast
Guard, or that served in the U.S. Merchant Marine during World War II.
Table 1.6 Veteran Population
Veterans, Percent
Report Area Total Population Age 18 Total Veterans
of Total Population
Clay County, IL 10,482 911 8.69%
Illinois 9,796,516 699,522 7.14%
United States 239,305,216 20,700,712 8.65%
Data Source: US Census Bureau, American Community Survey. 2010-14.
13
027Children with Food Insecurity: This indicator reports the estimated percentage of the population under age 18 that
experienced food insecurity at some point during the report year. Food insecurity is the household-level economic and
social condition of limited or uncertain access to adequate food.
Table 1.7 Child Food Insecurity
Report Area Population Under Age 18 Food Insecure Children, Total Child Food Insecurity Rate
Clay County, IL 3,167 840 26.52%
Illinois 3,022,155 643,040 21.28%
United States 73,580,326 17,284,530 23.49%
Data Source: Feeding America
Food Desert: A food desert is defined as a low-income census tract (where a substantial number or share of residents
has low access to a supermarket or large grocery store. This indicator is relevant because it highlights populations and
geographies facing food insecurity. Approximately 2,517 Clay County residents live in a “food desert”.
Figure 1.4 Map of Food Deserts
Food Desert Census Tracts, 1 Mi. / 10 Mi. by Tract,
FARA 2010
Food Desert
Not a Food Desert
No Data
Report Area
Data Source: US Census Bureau, County Business Patterns. Additional data analysis by CARES, 2014. Source geography:
County
14
028Households with No Motor Vehicle: This indicator reports the number and percentage of households with no motor
vehicle based on the latest 5-year American Community Survey estimates.
A total of 247 households in Clay County are estimated to have no motor vehicle (4.57% of population).
Figure 1.5 Map of Households with No Motor Vehicle Access
Households with No Vehicle, Percent by Tract, ACS
2010-14
Over 8.0%
6.1 - 8.0%
4.1 - 6.0%
Under 4.1%
No Data or Data Suppressed
Report Area
Data Source: Centers for Disease Control and Prevention, National Vital Statistics System. Accessed via CDC WONDER.
2010-14. Source geography: County
15
029General Health and Access to Health Care
Leading Causes of Death
In 2014, the leading cause of death in Clay County was heart disease with cancer as the second leading cause.
Similarly, heart disease and cancer were the top two leading causes of death in the state of Illinois. Kidney
Disease including nephritis, nephrotic syndrome, and nephrosis has risen to the top three in Clay County.
Nearly 50% of deaths in Clay County (47.5%) can be attributed to these three causes: heart disease, cancer,
and kidney disease. Clay County is ranked 92 out of 102 counties in Illinois for length of life. Premature death
is calculated by counting the years of potential life lost before age 75 per 100,000 population. Clay County is
getting worse for this measure. The CASPER Surveys found that the top three health isses were: heart
disease/hypertension (59.2% of households with at least one membe), Asthma/COPD/Emphysema (28.7% of
households), and Diabetes (22.5% of households).
Table 2.1 Top Ten Leading Causes of Death in Clay County, 2014
Clay Illinois
Rank Cause of Death Number of Deaths Percent of Deaths Number %
All Causes 146 100.0% 105,296 100.0%
1 Diseases of the Heart 37 20.3% 25,020 24.3%
2 Cancer 26 14.3% 24,504 23.8%
3 Kidney Disease 24 13.2% 2,517 2.4%
Chronic lower respiratory
4 diseases 8 4.4% 5,633 5.5%
5 Diabetes Mellitus 6 3.3% 2,712 2.6%
6 Stroke 6 3.3% 5,490 5.3%
7 Accidents 4 2.2% 4,642 4.5%
8 Septicemia 4 2.2% 1,804 1.8%
8 Alzheimer's disease 2 1.1% 3,267 3.2%
10 Influenza and Pneumonia 2 1.1% 2,483 2.4%
Source: Illinois Department of Public Health, Vital Statistics, 2014
Figure 2.1 Premature Death Trend
Data source: University of Wisconsin, County Health Rankings; National Center for Health Statistics, National Vital Statistics System, Mortality Files.
16
030General Health and Access to Health Care
Access to Health Care Professionals and Services
The entirety of Clay County is designated as a “Health Professional Shortage Area” (HPSA), defined as having a
shortage of primary medical care, dental, or mental health professionals. The access to primary care
physicians is especially low.
In 2014, there were 14.79 primary care physicians per 100,000 population
In 2015, there were 67 dentists per 100,000 population
In 2014, there were 96.1 mental health providers per 100,000 population
Data source: US Department of Health Human Services, Health Resources and Services Administration, Area Health Resource File.
2015.
Voices of the Community
During focus groups, access to health care “We had to drive 4 hours today, back and forth to St.
came up in many forms and in all age groups. Louis to see a specialist” – North Clay Parent
It was the #1 most common theme of
all focus groups. “I wish there were more eye doctors. I go to Mt.
Vernon” –Elderly Citizen
“We need a walk-in clinic!” – Clay City Parent
Local Stakeholder Input:
There are several groups in the community with
Local community stakeholders also
unmet needs who are difficult to connect with
mentioned access to healthcare
personal health services, including people with
professionals during group
developmental disabilities and people with high
meetings.
insurance deductibles. We lost the only
Medicaid dental provider this year.
In the CASPER survey, access to health care was one of the top 10 health issues important to Clay County
residents. Households reported examples of issues such as: mental health service availability, specialized
physicians, and cancer care out of the area.
17
031You can also read