Jefferies Industrials Conference - August 2021
←
→
Page content transcription
If your browser does not render page correctly, please read the page content below

Jefferies Industrials
                                                                                                      Conference
                                                                                                         August 2021

© 2021 Babcock & Wilcox Enterprises, Inc. All rights reserved.   BABCOCK & WILCOX ENTERPRISES, INC.                       1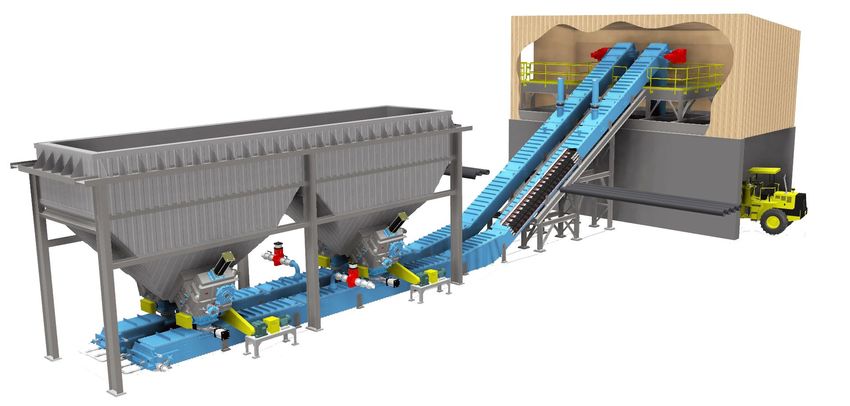
Safe Harbor Statement
   B&W Enterprises cautions that this presentation contains forward-looking statements, including, without limitation, statements relating to adjusted EBITDA and sales targets, expectations regarding future growth, expansion and profitability, as
   well as statements about B&W’s future pipeline of new projects and business within its Renewable, Environmental and Thermal operating segments and their impact on future shareholder value. These forward-looking statements are based on
   management’s current expectations and involve a number of risks and uncertainties, including, among other things, the impact of COVID-19 on us and the capital markets and global economic climate generally; our recognition of any asset
   impairments as a result of any decline in the value of our assets or our efforts to dispose of any assets in the future; our ability to obtain and maintain sufficient financing to provide liquidity to meet our business objectives, surety bonds, letters
   of credit and similar financing; our ability to comply with the requirements of, and to service the indebtedness under, our credit agreement as amended and restated (the "A&R" Credit Agreement”); the highly competitive nature of our
   businesses and our ability to win work, including identified project opportunities in our pipeline; general economic and business conditions, including changes in interest rates and currency exchange rates; cancellations of and adjustments to
   backlog and the resulting impact from using backlog as an indicator of future earnings; our ability to perform contracts on time and on budget, in accordance with the schedules and terms established by the applicable contracts with customers;
   failure by third-party subcontractors, partners or suppliers to perform their obligations on time and as specified; our ability to successfully resolve claims by vendors for goods and services provided and claims by customers for items under
   warranty; our ability to realize anticipated savings and operational benefits from our restructuring plans, and other cost-savings initiatives; our ability to successfully address productivity and schedule issues in our B&W Renewable, B&W
   Environmental and B&W Thermal segments, including the ability to complete our B&W Renewable's European EPC projects and B&W Environmental's U.S. loss projects within the expected time frame and the estimated costs; our ability to
   successfully partner with third parties to win and execute contracts within our B&W Renewable, B&W Environmental and B&W Thermal segments; changes in our effective tax rate and tax positions, including any limitation on our ability to use
   our net operating loss carryforwards and other tax assets; our ability to maintain operational support for our information systems against service outages and data corruption, as well as protection against cyber-based network security breaches
   and theft of data; our ability to protect our intellectual property and renew licenses to use intellectual property of third parties; our use of the percentage-of-completion method of accounting to recognize revenue over time; our ability to
   successfully manage research and development projects and costs, including our efforts to successfully develop and commercialize new technologies and products; the operating risks normally incident to our lines of business, including
   professional liability, product liability, warranty and other claims against us; changes in, or our failure or inability to comply with, laws and government regulations; actual or anticipated changes in governmental regulation, including trade and
   tariff policies; difficulties we may encounter in obtaining regulatory or other necessary permits or approvals; changes in, and liabilities relating to, existing or future environmental regulatory matters; changes in actuarial assumptions and market
   fluctuations that affect our net pension liabilities and income; potential violations of the Foreign Corrupt Practices Act; our ability to successfully compete with current and future competitors; the loss of key personnel and the continued
   availability of qualified personnel; our ability to negotiate and maintain good relationships with labor unions; changes in pension and medical expenses associated with our retirement benefit programs; social, political, competitive and economic
   situations in foreign countries where we do business or seek new business; the possibilities of war, other armed conflicts or terrorist attacks; the willingness of customers and suppliers to continue to do business with us on reasonable terms and
   conditions; our ability to successfully consummate strategic alternatives for non-core assets, if we determine to pursue them; and the other factors specified and set forth under "Risk Factors" in our periodic reports filed with the Securities and
   Exchange Commission, including, without limitation, the risks described in the Company's Annual Report on Form 10-K for the year ended December 31, 2020 and Quarterly Report on Form 10-Q for the quarter ended March 31, 2021 under the
   captions "Risk Factors" and "Management's Discussion and Analysis of Financial Condition and Results of Operations" (as applicable). These factors should be considered carefully, and B&W Enterprises cautions not to place undue reliance on
   these forward-looking statements, which speak only as of the date of this presentation, and undertakes no obligation to update or revise any forward-looking statement, except to the extent required by applicable law.
   Non-GAAP Financial Measures
   This presentation contains information regarding our adjusted EBITDA (including calculated on a pro forma basis to show the effect of certain changes in our operations and strategic focus going forward) and adjusted gross profit, which are non
   GAAP financial measures. Adjusted EBITDA on a consolidated basis is defined as the sum of the adjusted EBITDA for each of the segments, plus allocations to corporate and research and development costs. At a segment level, adjusted EBITDA is
   consistent with the way our chief operating decision maker reviews the results of operations and makes strategic decisions about the business and is calculated as earnings before interest, tax, depreciation and amortization adjusted for items
   such as gains or losses on asset sales, mark to market ("MTM") pension adjustments, restructuring and spin costs, impairments, losses on debt extinguishment, costs related to financial consulting required under the U.S. Revolving Credit Facility
   and other costs that may not be directly controllable by segment management and are not allocated to the segment. We present consolidated Adjusted EBITDA because we believe it is useful to investors to help facilitate comparisons of our
   ongoing, operating performance before corporate overhead and other expenses not attributable to the operating performance of our revenue generating segments. In this presentation, we also present certain targets for our adjusted EBITDA in
   the future; these targets are not intended as guidance regarding how we believe the business will perform. We are unable to reconcile these targets to their GAAP counterparts without unreasonable effort and expense due to the aspirational
   nature of these targets. This presentation also presents adjusted gross profit. We believe that adjusted gross profit by segment is useful to investors to help facilitate comparisons of the ongoing, operating performance by excluding expenses
   related to, among other things, activities related to the spin off, activities related to various restructuring activities we have undertaken, corporate overhead (such as SG&A expenses and research and development costs) and certain non-cash
   expenses such as intangible amortization and goodwill impairments.

© 2021 Babcock & Wilcox Enterprises, Inc. All rights reserved.   BABCOCK & WILCOX ENTERPRISES, INC.                                                                                                                                                        2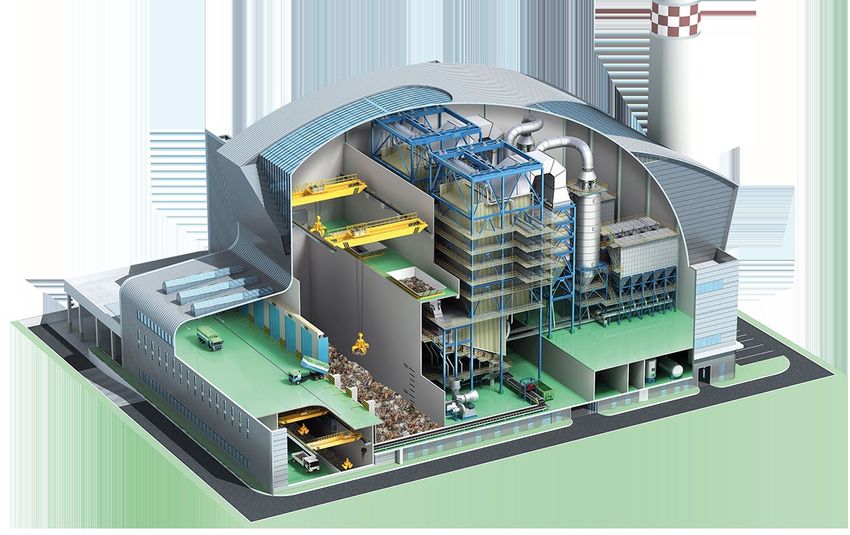
Executive Summary
                                                                                           Strong Global Brand
                                                                                      Babcock & Wilcox provides high-quality, innovative renewable, environmental and thermal technologies and
                                                                                      has served critical power generation and industrial applications for more than 150 years.

                                                                                           Executing a Transformation
                                                                                       B&W is executing a robust growth strategy after:
                                                                                        • Recovering from losses related to several expanded-scope projects, returning to its core technology and delivery model
                                                                                        • Implementing $133 million in cost savings initiatives, with another $8 million identified, and
                                                                                        • Reducing total secured debt by $347 million in 2021 to position for growth and support clean energy growth initiatives

                                                                                           Positioned for Growth
                                                                                       B&W's transformation is gaining momentum, with new branding and a global expansion underway to pursue
                                                                                       more than $5 billion in identified project opportunities in high-growth markets over the next three years.
                                                                                       B&W is pursuing a further expansion of its clean energy portfolio through innovation and acquisition.

                                                                                           Building Toward the Future
                                                                                       After achieving ~$53 million in adjusted EBITDA in the 12 months ended March 31, 2021, B&W is targeting1:
                                                                                        • FY2021 adjusted EBITDA of $70-$80 million
                                                                                        • FY2022 adjusted EBITDA of $95-$105 million
                                                                                       Recent debt paydowns and reduced required pension contributions are expected to save more than $40 million
                                                                                       annually in interest and pension funding cash expenses on a pro forma basis.

                           Advancing energy and environmental solutions that bring power and progress to our world
                                                                                                      (1)   The most comparable GAAP target information is not available without unreasonable effort; based on Q1 2021 results
                                                                                                            Disclaimer: B&W Enterprises cautions not to place undue reliance on any forward-looking statements, which speak only as of the date of this presentation and may be
© 2021 Babcock & Wilcox Enterprises, Inc. All rights reserved.   BABCOCK & WILCOX ENTERPRISES, INC.         impacted by the risks described in our SEC reports including, without limitation, the impact of COVID-19 on us and the capital markets and global economic climate generally.   3
                                                                                                            We undertake no obligation to update or revise any forward-looking statement, except to the extent required by applicable law.
Next Generation B&W
               B&W FOUNDATION DRIVES GROWTH STRATEGY
                                                                                                               A Circular Economy
                                                                                                               For our economy and future generations, we continually develop
                                              Advanced Technologies                                            ecologically sound ways of recycling resources, like biomass and
                                                                                                               waste, to create clean, renewable baseload power while reducing
                                                                                                               greenhouse gas emissions.

                                              Research & Innovation
                                                                                                               The Clear Choice for Our Climate
                                                                                                               As an industry leader in providing advanced air emissions control
                                                                                                               and energy recovery equipment and technologies, our engineered
                                              Global Brand Equity                                              solutions are designed to reduce the environmental impact of
                                                                                                               industrial processes.

                                              High-Growth End Markets                                          Efficient. Safe. Reliable.
                                                                                                               From the initial patent for the water-tube safety boiler to the
                                                                                                               world’s first supercritical boiler to technologies using the latest
                                              Vast Installed Base                                              advanced steam cycles, our robust thermal energy designs deliver
                                                                                                               availability and long-term operation.

                                                The next generation Babcock & Wilcox is providing innovative environmental and renewable solutions,
                                                     generating recurring revenues from a broad thermal installed base and expanding globally

© 2021 Babcock & Wilcox Enterprises, Inc. All rights reserved.   BABCOCK & WILCOX ENTERPRISES, INC.                                                                                  4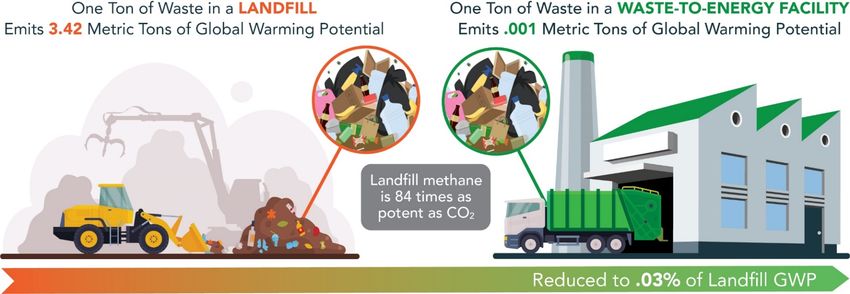
What We Do

                                                                              Technologies for Renewable Power & Resource Recovery
                                                                              Waste-to-energy and biomass-to-energy baseload power, chemical recovery boilers
                             RENEWABLE                                        for pulp & paper, multi-fuel technology, Dynagrate® and vibrating combustion grates

                                                                              Technologies for a Clean Environment
                                                                              Emissions controls, ash handling systems for bottom and fly ash, submerged grind
                          ENVIRONMENTAL                                       conveyors, wet, dry and hybrid cooling systems, carbon capture

                                                                               Technologies for Efficient Steam Generation
                                                                               Boilers, ancillary equipment and global aftermarket parts, service and upgrade
                               THERMAL                                         offerings to effectively utilize a wide range of fuels for power or industrial applications

      Delivering value to our customers through technology-driven products and services, with over 17,000 active and historical patents worldwide
                    Continual product improvement and research and development to support future needs, including carbon capture

© 2021 Babcock & Wilcox Enterprises, Inc. All rights reserved.   BABCOCK & WILCOX ENTERPRISES, INC.                                                                          5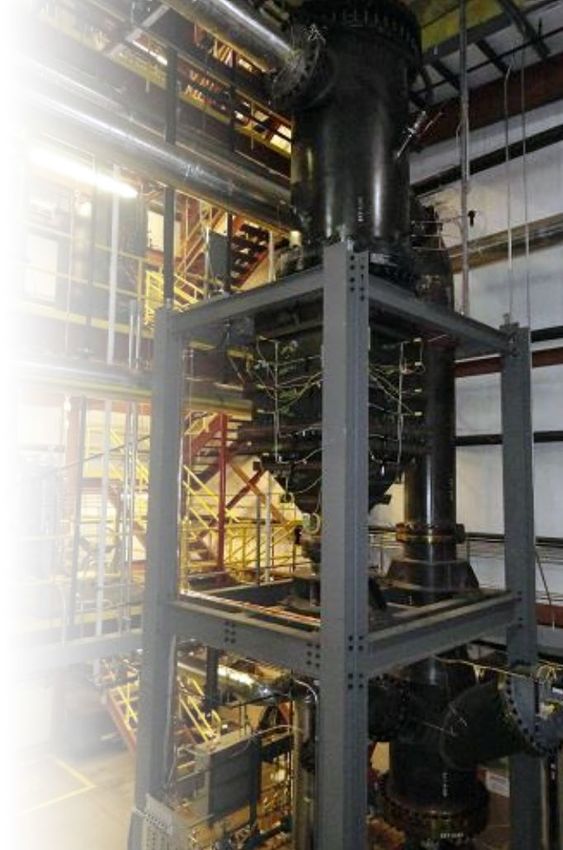
Installed & Proven Technologies
                                                                 More than 500 waste-to-energy and biomass-to-energy units at more than 300 facilities in more than 30
                                                                 countries, serving a wide range of utility, waste management, municipality and investment firm customers

                                                                 Combined installed capacity of our WtE technology is more than 48 million tons of waste per year
                                                                 and more than 5 GW of electricity from our BtE technology

                                                                  ~90 pulp and paper recovery boiler units in North America; at nearly 50%, the largest installed base among OEMs

                                                                 Key patented ADIOX® and MERCOX™ flue gas environmental technology installed in more than 120 plants

                                                                 Large installed base of wet and dry scrubbers to meet environmental regulations and technologies to
                                                                 improve ESP performance at a wide range of utility and industrial installations

                                                                 Nearly 2,000 cooling system units (7,000+ cells) across the globe

                                                                 More than 5,000 industrial water-tube package boilers installed in a variety of facilities, including refining, petro-
                                                                 chemical, food processing, metals and mining composite and carbon fiber, carbon black and wood products

                                                                 ~110 GW of baseload power generation capacity through ~330 operating fossil fuel boiler units in the U.S.

                                                                 ~180 operating utility and industrial boiler units across 38 countries outside of North America
                                                                 (excluding waste-to-energy and biomass)

                                            A vast global installation of B&W’s core technologies at utility and industrial plants, renewable plants and
                                                     pulp & paper facilities create a large growth opportunity for parts, services and retrofits

© 2021 Babcock & Wilcox Enterprises, Inc. All rights reserved.   BABCOCK & WILCOX ENTERPRISES, INC.                                                                                       6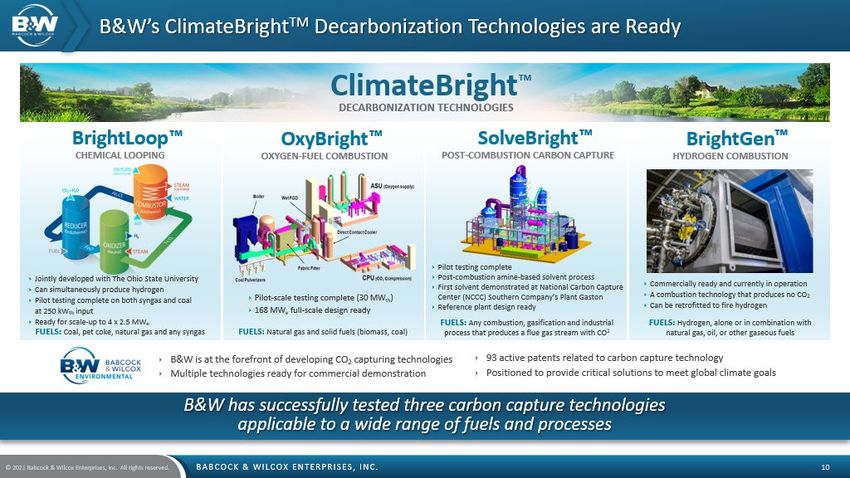
Company Profile                                                                              Babcock & Wilcox is a global leader in advanced environmental, renewable
                                                                                                                               and thermal technologies and services for power and industrial applications.

              Corporate Snapshot                                                                      Consolidated

        Headquarters:                                       Akron OH, USA                                                                                                             19%
        Founded:                                            1867                         Industrial         Parts & Services          Europe         Asia & Other
                                                                                            37%                   53%                  19%               19%
        Ownership:                                          Public (NYSE:BW)                                                                                                                                      56%
                                                                                                 Power                  Aftermarket               North                          25%
        LTM Q1 2021 Revenue: $586M                                                             Generation               & Upgrades               America
                                                                                                  63%                       34%                    62%
                                                                                                                                       New
        Employees:                                          ~2,100                                                                     Build
                                                                                                                                       13%

       B&W Renewable                                                                     B&W Environmental                                                          B&W Thermal
       Power
                                  Parts & Services                        Asia & Other   Industrial         Parts & Services          Asia & Other                  Industrial         Parts &      New Build            Asia & Other
     Generation
                                        75%                      Europe       10%           47%                   42%                     30%                          27%             Services       11%                    19%
        50%
                                                                  50%                                                                                                                    48%                    Europe
                                                                                                                                                                                                                  2%

                                              Aftermarket                    North              Power                  Aftermarket               North                     Power                  Aftermarket              North
                 Industrial                   & Upgrades                    America                                                             America                                                                   America
                                                                                              Generation               & Upgrades                                        Generation               & Upgrades
                    50%                           22%                         40%                                                                 40%                                                                       79%
                                                                                                 53%                       27%                                              73%                       41%
                                                                 New                                          New
                                                                 Build                                        Build                   Europe
                                                                  3%                                          31%                      30%

    Note: All charts based on LTM March 31, 2021 revenues, unless otherwise noted.

© 2021 Babcock & Wilcox Enterprises, Inc. All rights reserved.      BABCOCK & WILCOX ENTERPRISES, INC.                                                                                                                                  7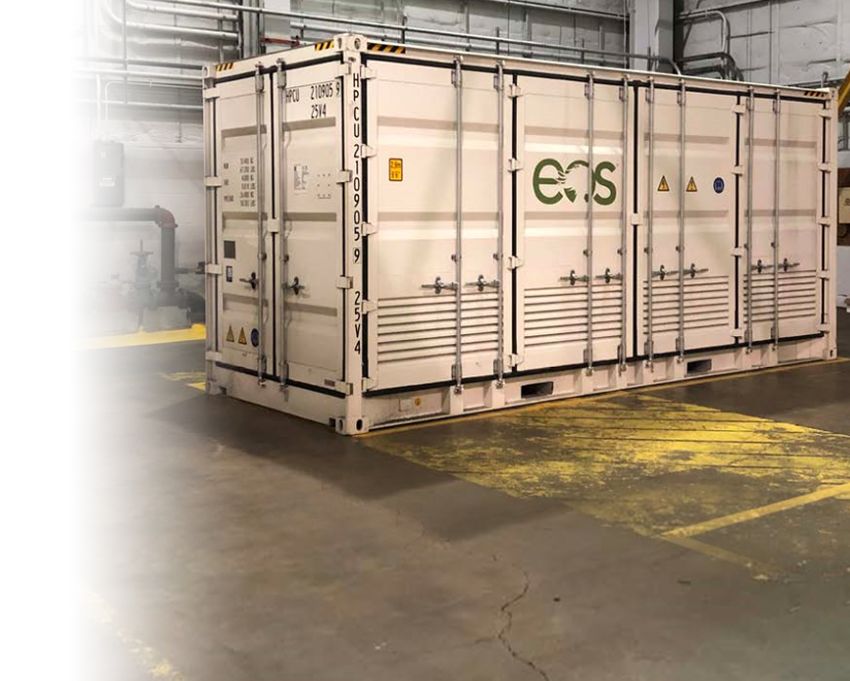
Global footprint and ongoing expansion positions
                                                Global Expansion                                                                                B&W to leverage market trends around the world

                                                                                                        2021-2023
                                                                                                    Addressable Market
                                                                                                           Europe                                                                                                              2021-2023
                                                                                                        More than $7B                                                                                                      Addressable Market
                                                                                                                                                                                                                                Asia-Pacific
                                                                                                                                                                                                                               More than $8B

                                                                                                                              2021-2023
                                                                                                                          Addressable Market
                  Manufacturing                                                                                           Middle East & Africa
              Service Facilities
                                                                                                                            More than $4B
                                                                                                2021-2023
 Future Service Facilities                                                                  Addressable Market
                        Construction
                                                                                                  Americas
                    Sales/Support                                                               More than $8B
    Future Sales/Support
                          Sales Reps
          Future Sales Reps                                                                                 Total pipeline more
                                                                                                             than $5B over the                                                                         Target Revenue Split 2023
                                                                                                           next 3 years excluding
                                                                                                              parts & services
                                             B&W RENEWABLE                                 B&W ENVIRONMENTAL                                     B&W THERMAL                                                      20-25%
      3-Year Pipeline

                                                $684 $714                                                                               $1204
                                                                                         $402                                                                                                                                                    35-45%
                                         $465                                                                      $307    $ MILLIONS
                           $ MILLIONS

                                                                           $ MILLIONS

                                                                 $326                            $198                                                                         $435
                                                                                                                                                   $349
                                                                                                           $75
                                                                                                                                                                   $24                                             30-40%
                                        Americas APAC   Europe   ME/A                   Americas APAC     Europe   ME/A                 Americas APAC            Europe         ME/A
  Note: All information as of 3/31/2021, unless otherwise noted.
                                                                                                                                          Disclaimer: B&W Enterprises cautions not to place undue reliance on any forward-looking statements, which speak only as of the date of this presentation and may be
© 2021 Babcock & Wilcox Enterprises, Inc. All rights reserved.          BABCOCK & WILCOX ENTERPRISES, INC.                                impacted by the risks described in our SEC reports including, without limitation, the impact of COVID-19 on us and the capital markets and global economic climate generally.   8
                                                                                                                                          We undertake no obligation to update or revise any forward-looking statement, except to the extent required by applicable law.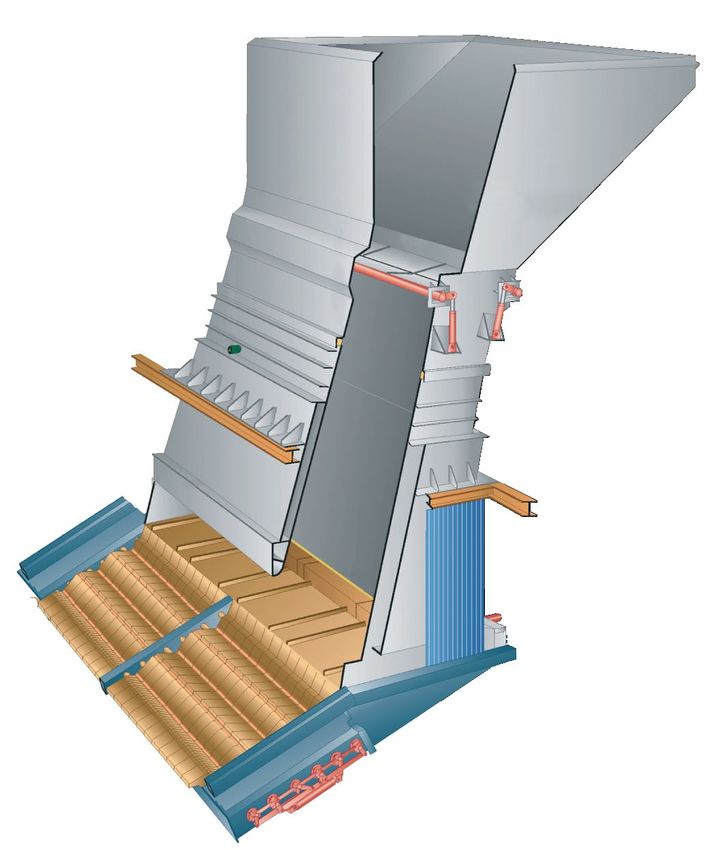
B&W’s Waste-to-Energy Technology Reduces Methane Emissions
Methane has 84 times the Global Warming Potential (GWP) of CO2i B&W’s state-of-the-art technology has been
Annual additions to landfills in the U.S.ii produce emissions installed in more than 500 units in more
equivalent to 10 million cars than 30 countries, including:
• The most recent WTE facility in the U.S.
Landfills in the U.S.iii emit more than 330 million tons of 20-year
(Palm Beach Renewable Energy Facility, Florida)
basis GWP each year, roughly equal to 70 million carsiv
• One of the world’s largest waste treatment facilities
Waste-to-Energy (WTE) avoids landfilling while producing baseload in the world (Shenzhen East, China)
clean energy
WTE Technologies
Boiler/steam generation island
DynaGrate® combustion grate
Fuel handling systems
Emissions control equipment
B&W is actively deploying technology today which curbs the global warming impact of methane
i Anthropogenic and Natural Radiative Forcing. In: Climate Change 2013: The Physical Science Basis. Contribution of Working Group I to the Fifth Assessment Report of the Intergovernmental Panel on Climate Change [Stocker, T.F., D. Qin, G.-K. Plattner, M. Tignor, S.K. Allen, J. Boschung, A. Nauels, Y. Xia, V. Bex and P.M. Midgley (eds.)]. Cambridge University Press, Cambridge, United
Kingdom and New York, NY, USA. https://www.ipcc.ch/site/assets/uploads/2018/02/WG1AR5_Chapter08_FINAL.pdf; 20-year basis
ii EIA Biomass Explained: Waste-to-energy (Municipal Solid Waste), November 29, 2020 https://www.eia.gov/energyexplained/biomass/waste-to-energy.php
iii EPA Landfill Methane Outreach Program: Project and Landfill Data by State; https://www.epa.gov/lmop/project-and-landfill-data-state#:~:text=The%20LMOP%20Landfill%20and%20Landfill,more%20than%202%2C600%20MSW%20landfills and EPA U.S. Greenhouse Gas Inventory 2020, Chapter 7: Waste, Section 7.1 Landfills (CRF Source Category 5A1)
iv Equivalent car emissions calculated using EPA metric of 4.6 metric tons of CO2 per year per passenger car
© 2021 Babcock & Wilcox Enterprises, Inc. All rights reserved. BABCOCK & WILCOX ENTERPRISES, INC. 9
B&W’s Waste-to-Energy Technology Reduces Methane Emissions
Methane has 84 times the Global Warming Potential (GWP) of CO2i B&W’s state-of-the-art technology has been
Annual additions to landfills in the U.S.ii produce emissions installed in more than 500 units in more
equivalent to 10 million cars than 30 countries, including:
• The most recent WTE facility in the U.S.
Landfills in the U.S.iii emit more than 330 million tons of 20-year
(Palm Beach Renewable Energy Facility, Florida)
basis GWP each year, roughly equal to 70 million carsiv
• One of the world’s largest waste treatment facilities
Waste-to-Energy (WTE) avoids landfilling while producing baseload in the world (Shenzhen East, China)
clean energy
WTE Technologies
Boiler/steam generation island
DynaGrate® combustion grate
Fuel handling systems
Emissions control equipment
B&W is actively deploying technology today which curbs the global warming impact of methane
i Anthropogenic and Natural Radiative Forcing. In: Climate Change 2013: The Physical Science Basis. Contribution of Working Group I to the Fifth Assessment Report of the Intergovernmental Panel on Climate Change [Stocker, T.F., D. Qin, G.-K. Plattner, M. Tignor, S.K. Allen, J. Boschung, A. Nauels, Y. Xia, V. Bex and P.M. Midgley (eds.)]. Cambridge University Press, Cambridge, United
Kingdom and New York, NY, USA. https://www.ipcc.ch/site/assets/uploads/2018/02/WG1AR5_Chapter08_FINAL.pdf; 20-year basis
ii EIA Biomass Explained: Waste-to-energy (Municipal Solid Waste), November 29, 2020 https://www.eia.gov/energyexplained/biomass/waste-to-energy.php
iii EPA Landfill Methane Outreach Program: Project and Landfill Data by State; https://www.epa.gov/lmop/project-and-landfill-data-state#:~:text=The%20LMOP%20Landfill%20and%20Landfill,more%20than%202%2C600%20MSW%20landfills and EPA U.S. Greenhouse Gas Inventory 2020, Chapter 7: Waste, Section 7.1 Landfills (CRF Source Category 5A1)
iv Equivalent car emissions calculated using EPA metric of 4.6 metric tons of CO2 per year per passenger car
© 2021 Babcock & Wilcox Enterprises, Inc. All rights reserved. BABCOCK & WILCOX ENTERPRISES, INC. 10Financial Information © 2021 Babcock & Wilcox Enterprises, Inc. All rights reserved. BABCOCK & WILCOX ENTERPRISES, INC. 11
Consolidated Financial Summary
                                                                                       Twelve Months Ended                    Twelve Months Ended                      Twelve Months Ended
                                 ($ in Millions)                                         March 31, 2021*                       December 31, 2020*                       December 31, 2019

                                  Revenue                                                     $ 586.0                                  $ 566.3                                 $      859.1

                                  Adjusted Gross Profit                                       $ 176.4                                  $ 173.6                                 $      169.5

                                  Adjusted Gross Profit Margin %                                  30.1%                                    30.7%                                      19.7%

                                  Operating Income (Loss)                                     $       2.1                              $    (1.7)                              $      (29.4)

                                  Adjusted EBITDA                                             $    52.6                                $    45.1                               $        45.0

                                  Adjusted EBITDA Margin %                                         9.0%                                     8.0%                                       5.2%

   Note: 2020 results include the recognition in Q3 2020 of a $26.0 million loss recovery settlement related to certain historical EPC loss contracts; figures may not be clerically accurate due to rounding; see SEC
   financial filings and/or slides in Appendix for reconciliation of non-GAAP measures; COVID-19 adversely impacted all segments in 2020 and Q1 2021; during the year ended December 31, 2020, we redefined our
   definition of adjusted EBITDA to eliminate the effects of certain items including loss from a non-strategic business, interest on letters of credit included in cost of operations and loss on business held for sale.
   Consequently, adjusted EBITDA in prior periods have been revised to conform with the revised definition and present separate reconciling items in our reconciliation.

                                                          *COVID-19 adversely impacted all segments in 2020 and Q1 2021;
                                               strategic actions in 2019 and 2020 provide the foundation for a strong 2021 and beyond

© 2021 Babcock & Wilcox Enterprises, Inc. All rights reserved.   BABCOCK & WILCOX ENTERPRISES, INC.                                                                                                                         12
Pro Forma Capital Structure
Preferred Stock At-The-Market(2) Pro Forma
(1)
($ in Millions) As of Mar 31, 2021 Offering ("ATM") Total (1)
Capitalization:
Total Debt $233.3 - $10.6 $243.9
Unrestricted Cash 53.8 95.7 10.7 160.2
Net Debt $179.5 ($95.7) ($0.1) $83.7
Adjusted EBITDA:
LTM 3/31/2021 Adjusted EBITDA (3) 52.6 - 52.6
(4)
2021 Target Adjusted EBITDA Range 70.0 - 80.0 - 70.0 - 80.0
Total Debt Leverage:
Net Leverage (5) 3.4x - 1.6x
(6)
Target Net Leverage Range 2.2x - 2.6x - 1.0x - 1.2x
Note: Figures may not be clerically accurate due to rounding.
(1) Includes impact of preferred stock offering through May 10, 2021, which includes $100M preferred stock offering net of estimated commissions and expenses.
(2) Includes impact of ATM sales agreement through May 10, 2021. The ATM sales agreement was entered into on 3/31/21 in which BW may sell, from time to time, up to an aggregated principle amount of $150 million of 8.125% senior notes due 2026. Cash
represents proceeds net of estimated commissions and expenses.
(3) See SEC financial filings and/or slides in Appendix for reconciliation of non-GAAP measures. 2020 results include the recognition in the third quarter of a $26.0 million loss recovery settlement related to certain historical EPC loss contracts, as previously
disclosed. Adjusted EBITDA for LTM as of 3/31/2021 is based on unaudited results for Q1 2021; 2020 Adjusted EBITDA excludes losses related to a non-strategic business, interest on letters of credit included in cost of operations and loss on business held for
sale.
(4) Targeted range for Adjusted EBITDA in 2021 previously disclosed by BW management; the most comparable GAAP target information is not available without unreasonable effort.
(5) Net Debt compared to LTM 3/31/2021 Adjusted EBITDA
(6) Net Debt compared to 2021 Target Adjusted EBITDA Range
February 2021 common stock and senior note offerings reduced secured debt by $274 million and reduced future cash interest payments by approximately $16 million
annually; combined with a reduction in required pension contributions, B&W expects savings of more than $40 million annually in cash expenses on a pro-forma basis
© 2021 Babcock & Wilcox Enterprises, Inc. All rights reserved. BABCOCK & WILCOX ENTERPRISES, INC. 13Executive Summary
Strong Global Brand
Babcock & Wilcox provides high-quality, innovative renewable, environmental and thermal technologies and
has served critical power generation and industrial applications for more than 150 years.
Executing a Transformation
B&W is executing a robust growth strategy after:
• Recovering from losses related to several expanded-scope projects, returning to its core technology and delivery model
• Implementing $133 million in cost savings initiatives, with another $8 million identified, and
• Reducing total secured debt by $347 million in 2021 to position for growth and support clean energy growth initiatives
Positioned for Growth
B&W's transformation is gaining momentum, with new branding and a global expansion underway to pursue
more than $5 billion in identified project opportunities in high-growth markets over the next three years.
B&W is pursuing a further expansion of its clean energy portfolio through innovation and acquisition.
Building Toward the Future
After achieving ~$53 million in adjusted EBITDA in the 12 months ended March 31, 2021, B&W is targeting1:
• FY2021 adjusted EBITDA of $70-$80 million
• FY2022 adjusted EBITDA of $95-$105 million
Recent debt paydowns and reduced required pension contributions are expected to save more than $40 million
annually in interest and pension funding cash expenses on a pro forma basis.
Advancing energy and environmental solutions that bring power and progress to our world
(1) The most comparable GAAP target information is not available without unreasonable effort; based on Q1 2021 results
Disclaimer: B&W Enterprises cautions not to place undue reliance on any forward-looking statements, which speak only as of the date of this presentation and may be
© 2021 Babcock & Wilcox Enterprises, Inc. All rights reserved. BABCOCK & WILCOX ENTERPRISES, INC. impacted by the risks described in our SEC reports including, without limitation, the impact of COVID-19 on us and the capital markets and global economic climate generally. 14
We undertake no obligation to update or revise any forward-looking statement, except to the extent required by applicable law.Appendix © 2021 Babcock & Wilcox Enterprises, Inc. All rights reserved. BABCOCK & WILCOX ENTERPRISES, INC. 15
Leadership Team

                                                                                                        Chairman &
                                                                                                        Chief Executive Officer

                                                                                                        Kenny Young

                                                       Chief Financial Officer                         Chief Operating Officer                            General Counsel

                                                       Lou Salamone                                    Jimmy Morgan                                       John Dziewisz

                                                                                                                                  Corporate Development
                                                                                 Human Resources
                                                                                                                                  & Investor Relations

                                                                                 Jacqueline Opal                                  Megan Wilson

© 2021 Babcock & Wilcox Enterprises, Inc. All rights reserved.    BABCOCK & WILCOX ENTERPRISES, INC.                                                                        16
Key Market Drivers & Opportunities
Global drive toward renewable and reusable energy sources
Increasing global regulatory restrictions on landfilling benefit waste-to-energy
New EU regulations require higher emissions standards
An aging utility boiler installed base drives stable aftermarket in the U.S.
while growth in international power generation continues
Water scarcity and regulations drive need for custom cooling solutions
Potential for carbon legislation benefits emergent carbon-capture technologies
B&W is positioned to capitalize on global trends driving the need for environmental and renewable solutions
© 2021 Babcock & Wilcox Enterprises, Inc. All rights reserved. BABCOCK & WILCOX ENTERPRISES, INC. 17Key Growth Strategies
Grow by expanding sales, service and business
development teams in key international regions to serve
the broad renewable, environmental and thermal markets
Meet the global need for carbon reduction with
patented renewable waste-to-energy & biomass and
carbon-capture solutions
Leverage a vast installed base and stable U.S. market
to drive aftermarket parts and service sales and
generate strong cash flow
Provide best-in-class environmental technologies
to customers across a broad array of markets to
meet growing environmental regulations
Core growth strategies focused on driving innovative environmental and renewable technologies,
growing aftermarket sales by leveraging the installed base, and expanding internationally in key regions
© 2021 Babcock & Wilcox Enterprises, Inc. All rights reserved. BABCOCK & WILCOX ENTERPRISES, INC. 18Ongoing Transformation
Key strategic actions have returned the company to positive performance
Focus on Strengths
and positioned it for growth
ACTION(1) ACHIEVED ONGOING
Focus on core products and services for
November 2018 New Senior Management Team led by Kenny Young environmental, renewable and thermal
April 2019 Settlement Negotiated for Remaining Loss Contracts; Additional Financing Obtained markets
Increase emphasis on retrofit and
May 2019 EPC Loss Contracts Turned Over to Customers(2) aftermarket services
June 2019 Sale of Non-Strategic Asset (Loibl) Focus on quality, high margin projects rather
July 2019 Deleveraging Events: Rights Offering & Debt Conversion
than revenues
Leverage a vast installed base and robust
May 2020 Extended Credit Facility for Two Years with Further Reductions Through End of 2020 pipeline
August 2020 Strategic Organizational and Global Branding Initiative Launched Return the renewable business to its
historically profitable business model,
August 2020 Board Transition to Align with Market-Focused Initiatives Complete providing core technologies and services,
February 2021 Deleveraging Event: Common Stock and Senior Notes Public Offerings with no EPC scope
Expand sales, service and business
March 2021 Entered into ATM sales agreement to sell, from time to time, Senior Notes
development teams internationally
May 2021 Deleveraging Event: Preferred Stock Offering
May 2021 Launch of ClimateBright™ Decarbonization Technologies Platform Financial Credibility & Profitability
June 2021 Deleveraging Event: Exchange of Secured Term Debt for Preferred Stock; Credit Facility Refinance
Ongoing Implementation of ~$133M in Cost Reductions Complete; Further $8 million identified
Pursuing Recoveries from Historical EPC Loss Projects; $9.1M Insurance Proceeds Q3’19; $26M (1) All financial information as of 3/31/2021, unless otherwise noted
Ongoing
Insurance Loss Recovery Recognized Q3’20; Pursuing Further Recoveries from Subcontractors (2) 5 of 6 EPC Loss Contracts turned over; Turnover not applicable for
last project under settlement terms
Ongoing Expanding Sales, Service and Business Development Teams Globally (3) The most comparable GAAP target information is not available
without unreasonable effort; targets based on current visibility
regarding COVID-19 impacts; it is not possible to fully predict the
Ongoing Targeting 2021 adjusted EBITDA of $70-$80 million, 2022 adjusted EBITDA of $95-$105 million(3) impacts of COVID-19
© 2021 Babcock & Wilcox Enterprises, Inc. All rights reserved. BABCOCK & WILCOX ENTERPRISES, INC. 19Financial Reporting Segments
Product and
Key End Markets
Service Overview
Waste-to-Energy Waste-to-energy and biomass
Biomass technologies, aftermarket equipment
Pulp & Paper upgrades, parts and service
Power Air emissions control and ash handling
Oil and Gas systems, cooling and energy recovery,
Pulp & Paper aftermarket equipment upgrades,
General Industry parts and service
Utility steam generation equipment,
Power
industrial boilers, boiler cleaning,
Oil and Gas
aftermarket equipment upgrades,
General Industry
parts and service
Note: Financial performance reported under new segments starting with Q3 2020 results; segment results for prior periods have been restated for comparative purposes.
© 2021 Babcock & Wilcox Enterprises, Inc. All rights reserved. BABCOCK & WILCOX ENTERPRISES, INC. 20Adjusted EBITDA Reconciliation
(1)
Three months ended Twelve months ended 1) Figures may not be clerically accurate
March 31, December 31,
$ in Millions $ in Millions due to rounding
2021* 2020 2020 2019 2) Adjusted EBITDA for the three months
ended March 31, 2020, excludes losses
Adjusted EBITDA (2) Adjusted EBITDA (4)(5)
related to a non-strategic business and
$ 8.5 $ 1.0 45.1 45.0
interest on letters of credit included in
Restructuring activities Restructuring activities cost of operations that were previously
(1.0) (2.0) (11.8) (11.7)
Financial advisory services Financial advisory services included in Adjusted EBITDA and total
(0.9) (0.9) (4.4) (9.1)
Settlement cost to exit Vølund contract (3) $(0.1) million and $(0.2) million,
Advisory fees for settlement costs and liquidity planning — (6.6)
(2.0) (2.6) respectively.
Litigation legal costs Advisory fees for settlement costs and liquidity planning (6.4) (11.8)
(0.4) (0.7) 3) In March 2019, we entered into a
Stock compensation Litigation fees and settlement (2.1) (0.5) settlement in connection with an
(7.8) (0.7)
Loss on business held for sale (0.5) (5.9) additional B&W Renewable waste-to-
Interest on letters of credit included in cost of operations
(0.3) (0.2) Stock compensation energy EPC contract, for which notice
Loss from business held for sale (4.6) (3.4)
(0.5) (0.8) Interest on letters of credit included in cost of operations to proceed was not given and the
Depreciation & amortization (0.9) (0.4)
(4.1) (4.2) Depreciation & amortization
contract was not started. The
(16.8) (23.6) settlement eliminated our obligations
Loss from a non-strategic business
— (0.1) Loss from a non-strategic business (2.6) (5.5) to act, and our risk related to acting, as
Gain on asset disposals, net Gain on asset disposals, net
2.0 0.9 3.3 3.9 the prime EPC should the project have
Operating loss Operating loss moved forward.
(6.5) (10.3) (1.7) (29.4)
Interest expense, net Interest expense, net 4) During the year ended December 31,
(14.1) (22.1) (59.2) (94.0)
Gain on sale of business Loss on debt extinguishment 2020, we redefined our definition of
0.4 — (6.2) (4.0) adjusted EBITDA to eliminate the
Net pension benefit Loss on sale of business (0.1) (3.6)
9.1 7.5 effects of certain items including loss
Foreign exchange Net pension benefit before MTM 28.8 14.0 from a non-strategic business, interest
(1.2) (9.3)
Other – net MTM (loss) gain from benefit plans (23.2) 8.8 on letters of credit included in cost of
(0.3) (0.2)
Foreign exchange 58.8 (16.6)
operations and loss on business held for
Total other income (expense)
(6.1) (24.0) sale. Consequently, adjusted EBITDA in
Other – net (1.1) 0.3
Loss before income tax (benefit) expense (12.6) (34.3) prior periods have been revised to
Income (loss) before income tax expense $ (3.9) $ (124.4)
Income tax expense (benefit) conform with the revised definition and
2.8 (0.8) Income tax expense
Loss from continuing operations 8.2 5.3 present separate reconciling items in
(15.4) (33.5) Income (loss) from continuing operations our reconciliation.
(12.1) (129.7)
Income from discontinued operations, net of tax
— 1.9 Income from discontinued operations, net of tax 1.8 0.7 5) Adjusted EBITDA for the twelve months
Net loss Net income (loss) ended December 31, 2020, include the
(15.4) (31.6) (10.3) (129.0)
Net loss attributable to non-controlling interest Net (income) loss attributable to non-controlling interest recognition of a $26.0 million loss
— 0.1 — 7.1 recovery settlement related to certain
Net loss attributable to stockholders Net income (loss) attributable to stockholders $
$ (15.5) $ (31.5) (10.3) $ (122.0) historical EPC loss contracts in the third
quarter, as previously disclosed.
© 2021 Babcock & Wilcox Enterprises, Inc. All rights reserved. BABCOCK & WILCOX ENTERPRISES, INC. 21Gross Profit Reconciliation
(4)
Three months ended Twelve months ended
$ in Millions March 31, $ in Millions December 31,
2021* 2020 2020 2019
Adjusted gross profit (1)(3) Adjusted gross profit (1) (2)(3)
Operating loss Operating loss
$ (6.5) $ (10.3) $ (1.7) $ (29.4)
Selling, general and administrative ("SG&A") expenses Selling, general and administrative ("SG&A") expenses
40.4 37.5 141.4 150.6
Advisory fees and settlement costs Advisory fees and settlement costs
3.3 4.2 12.9 27.9
Amortization expense Intangible amortization expense
1.4 1.4 5.5 4.3
Restructuring activities Restructuring activities
1.0 2.0 11.8 11.7
Research and development costs Research and development costs
0.6 1.3 4.4 2.9
Loss from a non-strategic business Loss from a non-strategic business
— 0.1 2.6 5.5
Gains on asset disposals, net Gain on asset disposals, net
(2.0) (0.9) (3.3) (3.9)
Adjusted gross profit Adjusted gross profit
$ 38.2 $ 35.4 $ 173.6 $ 169.5
(1) Intangible amortization is not allocated to the segments' adjusted gross profit, but depreciation is allocated to the segments' adjusted gross profit.
(2) Adjusted gross profit for the years ended December 31, 2020 and December 31, 2019, excludes losses related to a non-strategic business that was previously included in Adjusted gross profit within the
B&W Environmental segment and totals $2.6 million and $5.5 million.
(3) Adjusted gross profit for the twelve months ended December 31, 2020 includes the recognition of a $26.0 million loss recovery settlement related to certain historical EPC loss contracts in the third quarter,
as previously disclosed; Adjusted gross profit for the three months ended March 31, 2020, excludes losses related to a non-strategic business that was previously included in Adjusted gross profit and totals
$(0.1) million
(4) Figures may not be clerically accurate due to rounding.
© 2021 Babcock & Wilcox Enterprises, Inc. All rights reserved. BABCOCK & WILCOX ENTERPRISES, INC. 22Key Technologies © 2021 Babcock & Wilcox Enterprises, Inc. All rights reserved. BABCOCK & WILCOX ENTERPRISES, INC. 23
Products & Services Across Our Brands

                                Steam Generation Technologies
                                Natural Gas-fired Package Boilers
                                Boiler Auxiliaries
                 New Build

                                Combustion Grates
                                Construction
                                Emissions Control Solutions
                                Cooling Systems
                                Ash and Material Handling
                                Operations & Maintenance
                                Field Service
                Aftermarket

                                Inspections
                                Parts
                                Retrofits/Upgrades
                                Construction

           Providing “life of the plant” product and service applications across a broad array of power generation and industrial markets
       Note: Gas-fired package boilers are used in coal-fired and renewable plants for start-up or auxiliary power

© 2021 Babcock & Wilcox Enterprises, Inc. All rights reserved.   BABCOCK & WILCOX ENTERPRISES, INC.                                         24
Key Technologies: Steam Generation Technologies
Utility Boilers Waste-to-Energy Boilers
High pressure, high efficiency, high capacity, low emissions Reduces dependency on landfills and reduces methane gas emissions
Fuel: Coal, oil, natural gas, multi-fuel Fuels: MSW, RDF
Natural Gas-Fired and Other Industrial
Biomass-Fired Boilers
Water-Tube Boilers
Bottom- or top-supported, shop- or field-assembled Carbon-neutral technology
Fuel: Natural gas, oil, CO, waste heat and gases Fuels: Wood, wood waste, straw, sludge
Process Recovery Boilers
Single-drum, industry-standard unit for improved mill operation
Fuels: Black liquor
© 2021 Babcock & Wilcox Enterprises, Inc. All rights reserved. BABCOCK & WILCOX ENTERPRISES, INC. 25Key Technologies: Renewable Combustion Grates
DynaGrate® Pivoting Combustion Grate
Large installed base with diverse set of customers
Grate design allows for high availability and long
operational time, leading to reduced O&M cost
High thermal efficiency and low emissions
Fuel flexibility
Factory assembled modules reduce field construction
A Market Leader with Differentiating Technology in Waste-to-Energy Solutions
© 2021 Babcock & Wilcox Enterprises, Inc. All rights reserved. BABCOCK & WILCOX ENTERPRISES, INC. 26Key Technologies: Emissions Controls
Emission Technology Solution
Pulse Jet Fabric Filters (PJFF) / Baghouses
Wet and Dry Electrostatic Precipitators (ESPs)
Particulate Control Wet Particulate Scrubbers
Multiclone® Dust Collectors
Selective Catalytic and Non-catalytic Reduction (SCR/SNCR)
NOx Control Low NOX Burners and Combustion Systems
Wet or Seawater Flue Gas Desulfurization (FGD) Systems
Semi-dry FGDs (Spray Dry Absorbers, Circulating Dry Scrubbers)
SO2 / Acid Gas Control Wet ESPs
Dry Sorbent Injection (DSI)
Wet ESPs
SO3 / Acid Mist Control Dry Sorbent Injection (DSI)
Powdered Activated Carbon Injection
Mercury, Dioxins, Furans Absorption Plus™, MercPlus™, Mitagent™ Additives
GMAB™ ADIOX® and MERCOX® technologies
Wastewater Evaporation System (WES) via Spray Drying
Wastewater Elimination Air-Cooled Condensers
© 2021 Babcock & Wilcox Enterprises, Inc. All rights reserved. BABCOCK & WILCOX ENTERPRISES, INC. 27Steam Generation & Environmental Solutions
Key Technologies: Across a Utility Plant
Particulate Control
Steam Generator Technology Technologies Environmental Solutions
Pulverizers Particulate control
Furnace Dry Scrubbing Nitrogen oxides (NOx) removal
Technologies Sulfur removal
Burners and ignitors
Sootblowers Mercury, dioxin and furan removal
Pressure parts Fly ash handling systems
Air heaters and air heating cleaning systems Wastewater elimination
Bottom ash handling systems Wet Scrubbing
Technologies
Fly Ash Handling
Particulate Control
SCR NOx Control Technologies
Technologies
Boiler Pressure Parts
Boiler Cleaning
Equipment Fly Ash Handling
Burners
Boiler Auxiliary Components:
Fans, Air Heaters, etc.
B&W provides a comprehensive array of proprietary
technology and experience to utility power
Pulverizers Bottom Ash Handling generation customers
© 2021 Babcock & Wilcox Enterprises, Inc. All rights reserved. BABCOCK & WILCOX ENTERPRISES, INC. 28Steam Generation, Combustion Grates & Flue Gas Treatment
Key Technologies: Across a Waste-to-Energy Plant
Proven, proprietary DynaGrate® combustion grate
offers high reliability, maximizing waste throughput
and MW output
Advanced NextBAT® technology provides a thermal
efficiency of 99% and 95-99% clean flue gas
NextBAT® meets the EU BREF(1) requirements
(1) Best Available Technologies (BAT) Reference Document
On-line Boiler Washing System™ Baghouse filter
Inconel® cladded 1st and 2nd boiler pass
Conditioning tower
CUTNOX® in combination
VoluMix™ zone in 1st pass with SNCR
Water-cooled DynaGrate®
Combustion chamber with Inconel® cladded walls
© 2021 Babcock & Wilcox Enterprises, Inc. All rights reserved. BABCOCK & WILCOX ENTERPRISES, INC. 29Key Technologies: Submerged Grind Conveyor Ash Handling
Designed to meet current and future U.S.
regulatory requirements for ash handling with:
Lower equipment cost
Lower installation cost
• Utilize existing hoppers and gate valves
• No modification to hopper
Short outage required
Short lead time
Available redundancy under the boiler
Lower O&M costs
An innovative solution to eliminate ash ponds
© 2021 Babcock & Wilcox Enterprises, Inc. All rights reserved. BABCOCK & WILCOX ENTERPRISES, INC. 30Key Technologies: Clean Coal Solutions Ready for Deployment
Oxy-Fired Combustion RSAT TM
(Regenerable Solvent Absorption Technology)
Oxy-coal combustion technology Post-combustion technology
“Near-zero” emissions Patented amine-based solvent process
30 MW demonstration complete Pilot commissioning complete
Full-scale design ready Installed base retrofit application
Carbon Capture Technology for the 1000 GW of Global Coal Installed Base
© 2021 Babcock & Wilcox Enterprises, Inc. All rights reserved. BABCOCK & WILCOX ENTERPRISES, INC. 31Key Technologies: Chemical Looping Combustion Platform Technology
Combustion:
Coal (Petcoke) Turbine POWER
Steam
Fuel Cell/Boiler
Natural Gas Gasification:
REDUCER COMBUSTOR
H2 H2 Storage
Biomass HYDROGEN
Partial Oxidation: Shift Reaction
Biogas Syngas Methanation
CHEMICAL LOOPING
Fischer-Tropsch
METHANOL
FUELS APPLICATIONS
CO2
Advanced process for clean power generation and CO2 capture FUELS
A flameless, oxy-combustion process using oxidation-reduction reactions (Gasoline, Diesel,
Jet Fuel)
to process fuel and produce energy for power generation
Produces a concentrated CO2 stream that can be captured, cleaned and
compressed for use or permanent storage
Lower cost, higher efficiency
Working in collaboration with The Ohio State University
Potential extension beyond power generation
Process can be modified to convert carbon-based fuels—coal, biomass and natural gas—to electricity, syngas, chemicals, liquid fuels or hydrogen
© 2021 Babcock & Wilcox Enterprises, Inc. All rights reserved. BABCOCK & WILCOX ENTERPRISES, INC. 32Key Technologies: Cooling Systems
Natural Draft/Hyperbolic Mechanical Draft
Fanless design provides low power, noise Counterflow for cost-effective thermal
and maintenance, as well as long operating performance; crossflow for low energy
lifecycle consumption and operating costs
WET
MATERIAL OPTIONS:
WOOD | CONCRETE | FIBER-REINFORCED POLYMER (FRP)
Air-Cooled Condensers Air Fin Coolers
DRY Water preservation technology customized Cost-effective designs using embedded or
for high-performance, long-life, low noise, wrapped tubes to meet required thermal,
corrosion-resistant applications mechanical, noise and space requirements
Optimization Services
Specialized services to maximize plant
performance and minimize costs and
maintenance
© 2021 Babcock & Wilcox Enterprises, Inc. All rights reserved. BABCOCK & WILCOX ENTERPRISES, INC. 33Key Technologies: Global Parts & Service
Maintaining/improving plant operation:
Upgrades & Retrofits Projects for extending the life of power, process and
environmental equipment
Supplying components for system reliability:
Replacement Parts High-quality standard or custom-engineered pressure
and non-pressure parts
Enhancing efficiency with proven technology:
Optimization Systems Diagnostic, monitoring, tuning and control systems for
combustion, cleaning and cooling equipment
Evaluating options for improved performance:
Engineering Services Expert people, tools and processes to measure, model,
design, deliver, train and project manage
Adding value through constructability:
Construction Safe execution of new installation, retrofits, system
maintenance/repair, plant modifications
© 2021 Babcock & Wilcox Enterprises, Inc. All rights reserved. BABCOCK & WILCOX ENTERPRISES, INC. 34Key Technologies: Eos Energy Storage
October 2020 partnership with Eos Energy Storage, LLC to sell
and service Eos’ innovative, patented Eos Znyth® zinc battery
solution for industrial and utility-scale energy storage adds a
new clean energy technology capability to B&W’s range of
renewable energy solutions.
B&W will market Eos’ battery storage solutions globally
B&W is exclusive preferred installer in U.S. and Canada
Eos Znyth® zinc battery technology is:
• Scalable • High Energy Efficiency
• Modular • Safe
• Low Cost • Non-flammable
• Durable • Flexible
Applications
• Industrial
• Commercial
• Power Utilities
Innovative Battery Storage System Solution
© 2021 Babcock & Wilcox Enterprises, Inc. All rights reserved. BABCOCK & WILCOX ENTERPRISES, INC. 35© 2021 Babcock & Wilcox Enterprises, Inc. All rights reserved. BABCOCK & WILCOX ENTERPRISES, INC. 36
You can also read