JOURNAL Investment - Cantor Fitzgerald Ireland
←
→
Page content transcription
If your browser does not render page correctly, please read the page content below

May 2020
Investment
JOURNAL
FEATURED THIS MONTH:
Asset Allocation 2020
Core Equity Portfolio: The investment case for
our preferred names
Calibrating discretionary portfolio
positioning through the Coronavirus crisis
Core Funds Range: Latest updates on our
range of investment funds, ETFs and Trusts
Ethical Investing: Green Effects providing
sustainable investment returns
StockWatch: Alphabet
R
Cantor Fitzgerald Ireland Ltd Cantor is regulated by the Central Bank of Ireland. Cantor Fitzgerald
Ireland Ltd is a member firm of the Irish Stock Exchange and the London Stock Exchange.
We are part of leading global financial services firm Cantor Fitzgerald

                               FOUNDED IN 1945                                            25 COUNTRIES
                               Cantor Fitzgerald is a firm                                 Cantor and its affiliates employ
                               with significant real estate,                               12,000 people in 25 countries.
                               capital markets, research
                               and investment expertise.

       Cantor Fitzgerald Ireland
       With a proud history of stockbroking and servicing our private clients and financial advisors in Ireland since 1995, we
       provide a full suite of investment services, primarily in personalised share dealing, pensions and wealth management,
       fund management, debt capital markets and corporate finance. Our clients include private individuals and corporate
       entities, financial institutions, investment funds, credit unions and charities.
       Cantor Fitzgerald Ireland is one of the largest wealth management and stockbroking firms in the country, formed through
       the acquisition of Dolmen Stockbrokers in 2012, L&P Group in 2017 and Merrion Capital Group in 2018.

       DUBLIN: 75 St. Stephen’s Green, Dublin 2. Tel : +353 1 633 3633.
       CORK: 45 South Mall, Cork. Tel: +353 21 422 2122.
       LIMERICK: Theatre Court, Lower Mallow Street, Limerick. Tel: +353 61 436 500.

          Twitter : @cantorIreland     LinkedIn : Cantor Fitzgerald Ireland

       www.cantorfitzgerald.ie

2   CANTOR FITZGERALD IRELAND INVESTMENT JOURNAL MAY 2020
CONTENTS
      Welcome                                                                          4

      Asset Allocation                                                                 5
      Asset Allocation 2020                                                            6

      Investment Opportunities                                                         9
      Core Portfolio                                                                  10

      Core Investment Funds                                                           12

      Core ETFs & Trusts                                                              14

      Green Effects Fund                                                              16

      Stock Watch: Alphabet                                                           18

      Calibrating our discretionary portfolios
      positioning through the Coronavirus crisis                                      20

      Latest News                                                                    23
      Market Round-Up                                                                 24

      Performance Data                                                               27
      Investment Returns                                                              28

      Long Term Investment Returns                                                    29

      Bond Returns                                                                    30

                                   CANTOR FITZGERALD IRELAND INVESTMENT JOURNAL MAY 2020   3
WELCOME...
                           “It is not the strongest of the species that survives, not the most intelligent that survives. It is the one
                           that is the most adaptable to change.”

                           ― Charles Darwin

                           We are indeed living through a time of great              can gain exposure through our current EIIS eligi-
                           change, and I am delighted to say the team here           ble equity raise in Bio Marine, and in an elegant
    Gerard Casey,          at Cantor Fitzgerald Ireland is adapting very well,       and tax efficient structure. Founded in 2014, Bio-
    Director of Sales,     as we continue to enhance our level of client ser-        Marine is a bio-tech company which produces
    Cantor Fitzgerald      vice.                                                     marine proteins for nutrition and functional foods.
    Ireland
                                                                                     The Company commenced production in 2017
                           This is evident across both the high level of en-
                                                                                     from a custom-built plant in County Monaghan
                           gagement our broking and client service teams
                                                                                     and is now selling its product globally. Bio-Marine
                           are achieving with you, our clients, and very strik-
                                                                                     is well positioned to take advantage of Covid-19
                           ingly, the marked outperformance by our invest-
                                                                                     challenges, both from competitive stand point
                           ment teams.
                                                                                     (superior supply chain), and stable/increasing
                           We are very proud of how we have managed                  end demand. Please contact your broker or port-
                           performance so far this year. In the following            folio manager for further information.
                           pages, Pearse, David and Pramit will discuss how
                                                                                     We were also proud to launch our upgraded
                           their portfolios have adapted and will continue
                                                                                     client portal last weekend, providing access to
                           to adapt to the changing investing environment
                                                                                     all of your account information in one place and
                           we are navigating.
                                                                                     through a single login.
                           The key points of differentiation for our Invest-
                                                                                     Lastly, it is worth mentioning that Cantor Fitzger-
                           ment team are, the robust investment framework
                                                                                     ald Ireland was the only domestic broker acting
                           within which they operate – which allows dy-
                                                                                     as a lead in the most recent NTMA bond syndi-
                           namic and active asset and stock allocation, and
                                                                                     cate, which raised €6bn to help to bolster public
                           experience. These factors have been paramount
                                                                                     finances at a time of global uncertainty.
                           in achieving such significant outperformance
                           year-to-date.                                             The full breadth and consequence of the Covid-
                                                                                     19 Pandemic will not be fully quantifiable for
                           The dispersion between winners and losers in
                                                                                     some time yet, and while our working styles and
                           such extreme market conditions is vast. This
                                                                                     investment outlook are subject to change as facts
                           month we focus on one of the big winners,
                                                                                     change, our commitment to our clients and to
                           Google parent company 'Alphabet', a digital me-
                                                                                     our people remain constant.
                           dia behemoth which has itself adapted and di-
                           versified through growth and acquisition in re-           We encourage you to reach out to your broker
                           cent years. The article really brings into focus how      or portfolio manager with any concerns or ques-
                           integrated the company’s products are in all of           tions you may have, we stand ready to help.
                           our lives, and the pace of digital adoption that is
                           being experienced at the moment.
                                                                                     Gerard Casey
                           Another major area of resilience and outperfor-
                                                                                     Director of Sales, Cantor Fitzgerald Ireland
                           mance has been in the food supply and ingredi-
                           ents chain. A theme to which to which our clients

4     CANTOR FITZGERALD IRELAND INVESTMENT JOURNAL MAY 2020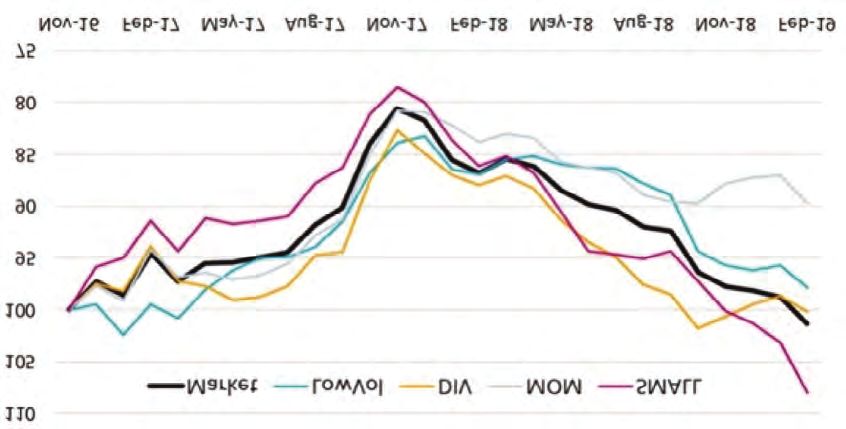
Asset
Allocation
                                May 2020

     Asset Allocation 2020                        6

CANTOR FITZGERALD IRELAND INVESTMENT JOURNAL MAY 2020   5
ASSET ALLOCATION

    ASSET ALLOCATION 2020
                                April 2020
                                Following the worst quarter for global equities since 2008, equities rebounded for their best month
                                in more than 10 years, rising by 11.1% in euro terms. Over the course of the month, the extreme
                                measures to contain the spread of the virus in Europe saw hospital admissions declining in Italy and
                                more importantly the numbers requiring ICU admissions falling. New hospital admissions in New York
                                also began to move lower. Expectations for the beginning of a gradual return to normal grew. China
    Pearse MacManus,            has already begun this process, with restrictions being eased. Elsewhere, the extreme stress in global
    Chief Investment Officer,
                                funding markets continued to abate. Credit spreads have tightened dramatically, helped by the US
    Merrion Investment
                                Federal Reserve’s decision to venture into the high yield credit market, another landmark decision to
    Managers
                                add to the many interventions that global central banks have made. Implied volatility has fallen.
                                Further evidence of the rapid bounce back in Chinese activity came as leading corporates in sectors
                                from luxury goods to staples confirmed the pick-up we had seen in the on-the-ground economic
                                data (traffic, steel consumption, auto sales etc). This bodes well for the West’s eventual reopening.
                                Two European travel and leisure companies highlighted how strong forward bookings are as people
                                rebook rather than cancel, setting the stage for a demand squeeze in H2 as pent-up demand of H1
                                meets natural demand of H2. Technology stocks continued to lead the market higher as they reported.
                                They confirmed seeing short-term benefits from this crisis (streaming subscriptions accelerating, online
                                credit card spend in the US +50 percent, gaming devices sold out, use of data increasing) and also
                                cementing their long-term position as the integral infrastructure of the next decade.
                                Just how much progress the leading healthcare companies in the US and around the world are making
                                to providing a definitive solution to this healthcare crisis became more evident over the month. Gilead’s
                                early trial of its Remdesivir drug showed a profound positive effect in treating those in ICU and a
                                second, wider trial showed even better results. Johnson & Johnson announced they will be able to
                                produce 1bln+ doses of their vaccine by early 2021 and Abbot will roll out 20mln tests a month next
                                month for anti- bodies. Four studies have also shown there is strong potential that the countries most
                                affected by Covid-19 are those without a universal BCG vaccination programme.
                                On the negative side the oil price move was one for the history books as the front-month contract,
                                that is oil priced in West Texas due for delivery now, traded not only negative but as low as -$40 for a
                                few hours. With short term oil storage in the US close to capacity financial speculators were left to
                                face the reality that oil futures contracts involve delivery of a commodity with nowhere to put it. The
                                situation was exacerbated by a proliferation of retail investors being exposed through ETFs and funds
                                which track front month energy prices as well as a high-profile scandal in an Asian commodity trading
                                house. Prices have recovered somewhat for now. The solid performance of the equity market in the
                                light of this turmoil (and subsequent potential credit issues) is to be noted, especially in light of the
                                continuous calls for “pull backs” after the recent record-breaking rally.

                                Positioning
                                We remain at the upper end of our asset allocation range. The changes we have made over the last
                                2 months were triggered by the signals coming from our three-pillar investment process. There was
                                a 6-month build up that culminated in a 1-month global asset market crash. We entered the crisis at
                                the lower end of the range in growth assets which meant we were able to exploit the opportunities
                                presented by the market crash - investing in equities (moving from underweight to overweight),
                                changing the equity mix in the portfolios (from defensive to cyclical whilst also adding further to high
                                quality equities and structural growth stories) and investing in corporate credit and periphery bonds.
                                These are a combination of strategic and tactical changes. Strategically, equities are attractive, but
                                risk management around certain levels will lead to tactical changes to asset allocation, as always. This
                                highlights the proactive nature of our process, pointing out areas in the market where excessive
                                positioning/risks have built up and avoiding them.

6     CANTOR FITZGERALD IRELAND INVESTMENT JOURNAL MAY 2020
Outlook
Despite the rapid short-term bounce back in some assets our constructive view and positioning remains
unchanged. China continues to show the way for a steady but slow economic normalisation post
Covid-19. Various activity indicators we monitor improve over the last month. Some corporate
commentary recently has been probably more sanguine than economic surveys would have predicted
with CEOS from global semi-conductor and materials companies in particular surprising with both the
current level of activity and their outlook for the near term. The main economies in Europe have put
plans in place for the slow re-opening of their economies in early May. Further stimulus measures were
announced for example with Germany considering a “cash for clunkers” style programme whilst in the
US the first round of the government stimulus payments arrived in bank accounts. This was met with
a surge in online spending, which rose by over 80% year on year. Against all this April has seen the
largest net selling of equities in 6 years according to one large US institution to leave their Hedge Fund
clients with the lowest exposure to equities in a decade.
In summary, growth has collapsed, but the key question is not how bad it will be but for how long it
will extend. Stimulus has been huge. Monetary authorities in 2008 didn’t even have the tools they
have now have, so it took a long time to first create them, then deploy them – this time, the tools have
been deployed very rapidly. In addition, fiscal stimulus is being promoted globally, in the order of 5-
10% of GDP, rather than the lurch towards fiscal austerity that characterised the last crisis, which in turn
reduced the ability of fiscal policy to mitigate the economic damage. All the ingredients for a significant
recovery are there. Whilst in the near-term equities will be heavily driven by moves in credit, news-flow
around Covid-19 cases and economic data, for medium term investors equity valuations are now on
your side for the first time in years.

Merrion Investment Managers Core Funds
Name                                Risk Rating (1 - 7)        Sedol            Currency          TER %

Merrion Multi-Asset 30 Fund                    4             !"#$%&'               EUR            0.68%

Merrion Multi-Asset 50 Fund                    4             !"#$%%(               EUR            0.68%

Merrion Multi-Asset 70 Fund                    5             !"#$%)*               EUR            0.68%

Merrion Investment Managers Multi-Asset Fund Performance
Name                             1 Month %     3 Month %    YTD %       1 Year %     *3 Year %   *5 Year %

Merrion Multi Asset 30              5.2            -0.7       1.2         4.0              2.8      1.9

Merrion Multi Asset 50              7.4            -2.3      -0.2         3.4              2.7      2.2

Merrion Multi Asset 70              9.5            -4.1      -1.9         2.7              3.0      2.3

*Annualised Gross Returns
Source: MIM 31/3/2020.

The Merrion Multi-Asset (MMA) funds were launched in July 2015. The information includes simulated
performance for the MMA funds prior to that date, based on the asset allocation and returns of the
Merrion Managed Fund, reweighted for the MMA simulated performance.

   WARNING: These figures are estimates only. They are not a reliable guide to future performance.

      WARNING: Past performance is not a reliable guide to future performance. The value of your
                             investment may go down as well as up.

                                              CANTOR FITZGERALD IRELAND INVESTMENT JOURNAL MAY 2020            7
RESEARCH &
                  INVESTMENT
                  INSIGHTS
    Our expert team regularly produces a series of publications, profiling key investment
                                 insights and opportunities

          Daily Note                                                                 Weekly Trader
                                         Investment Forum

                                     Online forum for market news,
   Market commentary               investment insights and a series of                  Our view on
outlining critical economic               informative articles.                      equity markets for
& company developments                                                                the coming days

          Sign up today to receive regular email updates
                marketingIreland@Cantor.com

                              www.cantorfitzgerald.ie/research
                       Twitter : @cantorIreland     LinkedIn : Cantor Fitzgerald Ireland
Investment
Opportunities
                                    May 2020

       Core Portfolio                                 10
       Core Investment Funds                          12
       Core ETFs & Trusts                             14
       Green Effects Fund                             16
       Stock Watch: Alphabet                          18
       Calibrating our discretionary portfolios
       positioning through the Coronavirus crisis     20

    CANTOR FITZGERALD IRELAND INVESTMENT JOURNAL MAY 2020   9
DISCRETIONARY STRATEGIES
CORE PORTFOLIO 2020
May 2020
Equity markets recouped a large portion of their February/March declines during April as the continued
support from global central banks and governments helped reduce market volatility.
During the month the Core Portfolio gained 10.12% compared to a gain of 9.36% for the portfolio
benchmark. For the year-to-date the portfolio is showing a decline of 12.99% while the portfolio
benchmark is showing a decline of 13.13%
David Beaton,
Chief Investment This recovery in the portfolio performance has been driven by its exposure to the strongest performing
Officer market sectors namely Technology, Pharmaceuticals and Gold.
Amongst the technology holding there were strong gains during the month for PayPal Holdings
(+28.8%), Amazon (+27.3%), Microsoft (+14.0%) and SAP (+6.0%)
In the pharmaceutical sector there were positive performances from Sanofi (+11.3%) and Pfizer (+17.9%)
while there were strong gains for the gold exposed holdings of Newmont Corp (+31.8%) and the
Invesco Physical Secured Gold ETF (+6.0%).
In the Consumer Staples holdings there were mixed performances with Danone registering a gain of
7.9% while Glanbia declined by 1.9% despite issuing a positive trading update.
Amongst the Consumer Discretionary names held in the portfolio there were strong performances by
McDonalds (+13.8%), Dalata Hotel Group (+20.2%) and Carnival (+21.1%).
Also, in the Communications Services there were mixed performances with Alphabet (+16.3%) and
Verizon Communications (+8.4%) registering strong gains while BT Group was unchanged for the
month.
In the Industrial sector there were positive performances by DCC (+12.9%) and Fedex (+4.8%) however
there were modest declines for infrastructure group Vinci (-0.9%) and renewable group Siemens Gamesa
Renewables (-1.1%)
Other notable performances during the month came from the JPMorgan Emerging Markets Investment
Trust (+10.6%) along with Smurfit Kappa Group (+11.3%).
Finally, following a tumultuous month for oil, the only oil holding in the portfolio Royal Dutch Shell,
finished the month -3.7% after the company surprised markets by reducing its quarterly dividend.
While the portfolio continues to show a negative performance year-to-date, it is marginally
outperforming the underlying portfolio benchmark. This is due to the exposure to the strongest
performing market sectors of Technology, Pharmaceuticals and Gold, along with strong performances
from other individual stock names in sectors such as Consumer Staples, Consumer Discretionary and
Industrials.
10 CANTOR FITZGERALD IRELAND INVESTMENT JOURNAL MAY 2020Core Portfolio at the 30th April 2020
Price Total Return Fwd P/E Div Yield
Stocks Weightings
30/4/2020 Year to Date FY1 (x) FY1
Alphabet Inc 1346.7 0.5% 26.26 0.0% 2.00%
Verizon Communications Inc 57.45 -4.4% 12.11 4.3% 5.00%
BT Group* 116.05 -39.7% 4.99 12.9% 5.00%
Dalata Hotel Group Plc 2.97 -42.3% 40.68 0.0% 2.00%
Amazon.Com Inc 2474 33.9% 68.40 0.0% 4.00%
McDonald'S Corp 187.56 -4.5% 32.18 2.7% 3.00%
Carnival 15.9 -68.4% 22.26 0.0% 3.00%
Glanbia Plc 9.68 -4.0% 11.65 2.7% 4.00%
Danone 63.26 -14.4% 17.19 3.3% 3.00%
Royal Dutch Shell Plc* 1286.4 -41.5% 29.17 4.7% 3.00%
Allianz Se 168.88 -22.7% 10.14 5.8% 4.00%
ING Groep Nv 5.008 -53.1% 6.30 0.0% 4.00%
Sanofi 89.19 -0.5% 14.24 3.6% 3.00%
Pfizer Inc 38.36 -1.1% 13.25 4.0% 5.00%
Vinci Sa 74.7 -24.5% 20.57 3.2% 4.00%
Siemens Gamesa Renewable Energy 13.57 -13.2% 31.34 0.4% 3.00%
DCC Plc 5658 -13.5% 16.00 2.5% 4.00%
Fedex Corp 126.77 -15.7% 13.24 2.1% 3.00%
SAP Se 108.94 -9.5% 22.16 1.5% 4.00%
Paypal Holdings Inc 123 13.7% 38.21 0.0% 4.00%
Microsoft Corp 179.21 13.9% 31.19 1.1% 3.00%
Smurfit Kappa Group Plc 28.62 -16.5% 13.05 0.0% 3.00%
Newmont Corp 59.48 37.3% 28.25 1.6% 3.00%
Invesco Physical Gold ETC 165.13 11.8% 0.00 0.0% 3.00%
Kennedy Wilson Holdings Inc 14.15 -35.5% 10.97 6.6% 4.00%
Engie 9.904 -31.2% 11.44 0.0% 5.00%
Greencoat Renewables Plc 1.13 -3.4% 19.48 5.5% 4.00%
JPMorgan Emerging Markets Trust 889 -15.9% 17.50 2.2% 3.00%
Current Price as at 30/4/2020. Source: Bloomberg. *SIP = Since Inclusion in Portfolio
Cantor Core Portfolio Return -12.99%
Benchmark Return -13.13%
Relative outperformance 0.14%
WARNING: Past performance is not a reliable guide to future performance. The value of your
investment may go down as well as up.
CANTOR FITZGERALD IRELAND INVESTMENT JOURNAL MAY 2020 11INVESTMENT OPPORTUNITIES
INVESTMENT FUNDS
Our Core Funds range is a selection of funds that our investment committee feels could compliment
portfolios and enhance diversification. The Core Funds range offers investment options across
multiple asset classes and markets. Funds selected have undergone a comprehensive screening
process by our investment committee and are reviewed regularly.
Niall Sexton,
Core Investment Funds
Portfolio Equity Funds
Construction Name
Morningstar
Risk Rating (1 - 7) Currency TER % Yield %
Analyst Rating!
Global Equity Income
Veritas Global Equity Income
5 EUR 1.06 3.41
Global Equity Income
Merrion Global Equity Income
5 EUR 0.60 0.00
Global Equity Growth
Fundsmith Global Equity Feeder
5 EUR 1.05 0.55
Global Equity - Ethical Investing
Green Effects
5 EUR 1.28 0.00
European Equity
Threadneedle European Select
6 EUR 0.83 0.00
US Equity
Merian North American Equity
6 EUR 0.89 0.00
Bond Funds
Name Risk Rating (1 - 7) Currency TER % Yield %
Corporate Bond
PIMCO GIS Global Investment Grade Credit
3 EUR 0.49 3.46
Government Bond
BNY Mellon Global Bond
4 EUR 0.65 0.00
High Yield
HSBC Euro High Yield Bond
4 EUR 1.35 2.49
Diversified Bond
Templeton Global Total Return
4 EUR 1.40 8.77
Alternative Funds
Name Risk Rating (1 - 7) Currency TER % Yield %
Multi - Asset Allocation
M&G Dynamic Allocation
4 EUR 0.95 0.00
Merrion Multi Asset 30 - 4 EUR 0.68 0.00
Merrion Multi Asset 50 - 4 EUR 0.68 0.00
Merrion Multi Asset 70 - 5 EUR 0.68 0.00
Absolute Return
Invesco Global Targeted Return - 3 EUR 0.86 0.00
Source: Bloomberg. Prices as of 30/4/2020.
12 CANTOR FITZGERALD IRELAND INVESTMENT JOURNAL MAY 2020Fund Performance
Equity Fund Performance
Name 1 Month % 3 Month % YTD % 1 Year % 3 Year % 5 Year %
Global Equity
Veritas Global Equity Income 10.61 -13.53 -12.94 -5.00 0.86 2.25
Global Equity
Merrion Global Equity Income 9.51 -10.35 -10.56 -7.45 1.88 -
Global Equity Growth
Fundsmith Global Equity Feeder 10.07 -5.86 -2.71 5.26 11.55 12.83
Global Equity - Ethical Investing
Green Effects 11.07 -4.76 -0.50 9.30 5.17 5.93
European Equity
Threadneedle European Select 8.02 -9.04 -8.75 1.78 4.22 3.70
US Equity
Merian North American Equity 14.59 -9.52 -6.00 -0.42 4.59 6.83
Bond Fund Performance
Name 1 Month % 3 Month % YTD % 1 Year % 3 Year % 5 Year %
Corporate Bond
PIMCO GIS Global Investment Grade Credit 4.00 -5.33 -3.63 0.66 1.19 1.89
Government Bond
BNY Mellon Global Bond 1.77 2.44 5.61 11.24 4.15 3.14
High Yield
HSBC Euro High Yield Bond 5.81 -4.78 -4.72 -1.29 1.14 2.18
Diversified Bond
Templeton Global Total Return 0.11 -6.91 -7.62 -12.43 -5.60 -3.00
Alternative Fund Performance
Name 1 Month % 3 Month % YTD % 1 Year % 3 Year % 5 Year %
Multi - Asset Allocation
M&G Dynamic Allocation 5.96 -11.91 -13.32 -8.95 -2.62 -0.09
Merrion Multi Asset 30 5.20 -0.70 1.20 4.00 2.80 1.90
Merrion Multi Asset 50 7.40 -2.30 -0.20 3.40 2.70 2.20
Merrion Multi Asset 70 9.50 -4.10 -1.90 2.70 3.00 2.30
Absolute Return
Invesco Global Targeted Return 0.65 -1.66 -0.29 0.70 -1.60 -0.35
Source: Bloomberg. Prices as of 30/4/2020.
WARNING: Past performance is not a reliable guide to future performance. The value of your
investment may go down as well as up.
CANTOR FITZGERALD IRELAND INVESTMENT JOURNAL MAY 2020 13INVESTMENT OPPORTUNITIES
ETFs & TRUSTs
Our Core ETF and Investment Trust range is a selection of active and passive collective funds which
are listed on primary exchanges. This range offers a selection of the listed investment options
available across multiple asset classes and markets.
Core ETFs & Trusts
Niall Sexton, Equity ETFs & Trusts
Portfolio Name SEDOL Currency TER % Yield % UCITS
Construction
Global Equity
Analyst
iShares MSCI World UCITS ETF B297PF5 EUR 0.50 1.80 Yes
iShares Global STOXX 100 Select Dividend ETF B401VZ2 EUR 0.46 5.27 Yes
European Equity
iShares Euro STOXX 50 ETF 7018910 EUR 0.10 3.45 Yes
SPDR® S&P Euro Dividend Aristocrats UCITS B7KHKP4 EUR 0.30 3.85 Yes
UK Equity
City of London Investment Trust Plc 0199049 GBp 0.44 5.66 No
US Equity
SPDR S&P 500 UCITS ETF B6YX5T0 USD 0.09 1.72 Yes
SPDR® S&P U.S. Dividend Aristocrats UCITS ETF B6YX5V2 USD 0.35 2.56 Yes
Emerging Market Equity
JPMorgan Emerging Markets Investment Trust Plc 0341895 GBP 1.02 1.79 No
Bond ETFs & Trusts
Name SEDOL Currency TER % Yield % UCITS
Corporate Bond
iShares Euro Corporate Bond Ex-Financials ETF BSKRK39 EUR 0.20 1.13 Yes
Government Bond
iShares Core Euro Government Bond ETF BVG75S4 EUR 0.09 0.63 Yes
High Yield
iShares Euro High Yield Corporate Bond ETF B66F475 EUR 0.50 4.57 Yes
Commodity ETFs & Trusts
Name SEDOL Currency TER % Yield % UCITS
Precious Metals
Invesco Physical Gold ETC B599TV6 USD 0.19 0.00 No
Commodity
ETFS 1 Month Brent ETF B0CTWC0 USD 0.49 0.00 No
Source: Bloomberg. Prices as of 30/4/2020.
14 CANTOR FITZGERALD IRELAND INVESTMENT JOURNAL MAY 2020Fund Performance
Equity Performance
Name 1 Month % 3 Month % YTD % 1 Year % 3 Year % 5 Year %
Global Equity
iShares MSCI World UCITS ETF 9.57 -10.94 -10.78 -1.67 4.61 5.16
iShares Global STOXX 100 Select Dividend ETF 4.70 -22.51 -23.49 -17.61 -3.80 -0.59
European Equity
iShares Euro STOXX 50 ETF 5.22 -19.24 -21.88 -14.22 -3.39 -1.03
SPDR® S&P Euro Dividend Aristocrats UCITS 8.06 -20.32 -21.82 -15.03 -3.67 0.61
UK Equity
City of London Investment Trust Plc 6.23 -17.96 -21.17 -15.19 -2.49 1.19
US Equity
SPDR S&P 500 UCITS ETF 10.93 -8.60 -7.57 3.28 8.46 9.02
SPDR® S&P U.S. Dividend Aristocrats UCITS ETF 9.06 -14.28 -15.58 -8.51 2.69 6.58
Emerging Market Equity
JPMorgan Emerging Markets Investment Trust Plc 8.68 -10.71 -15.92 -6.92 7.14 9.01
Bond Performance
Name 1 Month % 3 Month % YTD % 1 Year % 3 Year % 5 Year %
Corporate Bond
iShares Euro Corporate Bond Ex-Financials ETF 3.75 -3.48 -2.42 -0.34 1.21 1.43
Government Bond
iShares Core Euro Government Bond ETF 0.75 -1.60 0.72 4.95 3.10 1.98
High Yield
iShares Euro High Yield Corporate Bond ETF 5.16 -9.98 -10.32 -7.35 -0.88 0.75
Commodity Performance
Name 1 Month % 3 Month % YTD % 1 Year % 3 Year % 5 Year %
Precious Metals
Invesco Physical Gold ETC 5.63 7.23 11.77 32.33 10.02 7.32
Commodity
ETFS 1 Month Brent ETF -6.98 -56.86 -62.56 -62.32 -18.37 -20.86
Source: Bloomberg. Prices as of 30/4/2020.
WARNING: Past performance is not a reliable guide to future performance. The value of your
investment may go down as well as up.
CANTOR FITZGERALD IRELAND INVESTMENT JOURNAL MAY 2020 15INVESTMENT OPPORTUNITIES
GREEN EFFECTS FUND FACTSHEET
MAY 2020
Fund Objectives
The objective of the fund is to achieve long term capital growth through a basket of ethically screened stocks. The fund invests in a
wide range of companies with a commitment to either supporting the environment or demonstrating a strong corporate
responsibility ethos. Sectors such as wind energy, recycling, waste management, forestry and water-related businesses all feature
prominently within the fund. The fund can only invest in the constituents of the Natural Stock Index (NAI) which was set up in 1994
and currently consists of 30 global equities.
Key Information GREEN EFFECTS FUND NAV SINCE INCEPTION
Morningstar Rating ★★★
€250
Fund Inception Oct 2000
€200
NAV €237.08
Minimum Investment €5,000 €150
Dealing Frequency Daily €100
Investment Manager Cantor Fitzgerald Ireland Ltd €50
Custodian Northern Trust
€0
Administrator Northern Trust
Sales Commission 3%
Source: Cantor Fitzgerald Ireland Ltd Research
TER % 1.39%
Investment Mgt Fee 0.75% ESMA RISK RATING
*Prices as of 30/4/2020
Source: Bloomberg & Cantor Fitzgerald Ireland Ltd Research Lower Risk 1 2 3 4 5 6 7 Higher Risk
Fund & Share Class Information Typically Lower Rewards Typically Higher Rewards
Fund Size €76.5m
LARGEST SECTOR EXPOSURE %
Fund ISIN IE0005895655
Alternative Energy 11.15%
Fund Sedol 0589565 Engineering 10.07%
Bloomberg GEFINVL ID Forestry 9.73% r
Medical Devices 8.99% r
Domicile Ireland Electric Vehicles 7.63%
Recycling 6.66%
Structure UCITS Fund Consumer goods 4.98% t
Healthcare 4.89% y
Historic Yield 0 1 2 3 4 5 6 7 8 9 10 11 12
*Fund Yield 1.35%
GEOGRAPHIC EXPOSURE %
Fund yield is historic based on full year 2017 dividend
PAN-EUROPE 36.61%
rope
income received. The fund does not distribute income to
AMERICAS 32.14%
icas
investors. All dividend income is reflected within the NAV
ASIA 14.78%
Asia
price of the fund.
EUROPE 14.57%
rope
Australia 0.29%
ralia
Total number of holdings South Africa 1.61%
frica
Number of holdings 30 0 5 10 15 20 25 30 35
Market Capitalisation Exposure CURRENCY EXPOSURE %
Large: > €3bn 60% USD 30.85%
USD
GBP 14.79%
EUR
Medium: €500m - €3bn 37% JPY 14.78%
JPY
Small: < €500m 3% EUR 14.57%
GBP
DKK 8.70%
NOK
SEK 8.19%
SEK
NOK 4.92%
DKK
ZAR 1.61%
BRL
0 5 10 15 20 25 30 35
16 CANTOR FITZGERALD IRELAND INVESTMENT JOURNAL MAY 2020Top 15 Positions Sector Exposure Compared to a Traditional Global
SMITH & NEPHEW 8.99% Equity Fund
VESTAS 8.14% The fund does not invest in banks, oils, mining, metals or large cap technology stocks. From a
SVENSKA CELLULOSA 7.66% performance and relative returns perspective this is something that all investors should bear
in mind when considering investing in the fund. The overriding investment theme from a
TESLA INC 7.63% sectoral perspective remains that of alternative energy, water, waste management and similar
MOLINA 4.89% companies with a strong corporate social responsibility (CSR) focus in both their culture and
work practices.
MAYR MELNHOF 4.86%
KINGFISHER 4.84% Fund Manager Comment
TOMRA SYSTEMS 4.60% April was a particularly strong month with the NAV price ending at €237.08 which was a gain
KURITA 4.27% of +11.1%. Year to date that leaves the fund return marginally negative at -0.50%. The fund
held circa 15% in cash during January and February and following the sharp correction during
SHIMANO 3.82%
March and early April that cash weighting has been reduced to circa 6%. Holdings in Smith &
ACCIONA 3.72% Nephew (Medical Devices), Kingfisher (Home Improvement), Stericycle (Medical Waste
Recycling), Mohlina Healthcare (US Healthcare), Tesla (Electric Autos) and Mayr Melnhof (Paper)
ORMAT 3.01%
were increased. A number of companies within the fund reported earnings during the month
RICOH 2.94% with the highlight being Tesla on 29th April. The electric auto maker (circa 9% of the fund on
EAST JAPAN RAILWAY CO. 2.80% 28/4) reported first-quarter earnings of $1.24 per share and revenue of $5.99 billion, both of
which beat out Wall Street's estimates. The stock price has recovered strongly from the lows
KADANT 2.69% of late March and following the move above $860 per share the fund reduced exposure by
Source: Cantor Fitzgerald Ireland Ltd Research circa 1%. For the month the holding in Tesla added circa 3.8% to the fund NAV. Other notable
contributors to the fund price move on the month were Tomra Systems which added 1.5%,
Fund Sector Exposure vs MSCI World Smith & Nephew 1.0% and Vestas 0.7%.
Sectors GE MSCI
Consumer Discretionary 15% 13%
Performance As of 30/4/2020.
Consumer Staples 10% 10% 1 Month YTD 1 Year 3 Year* 5 Year*
Energy 0% 6%
Green Effects 11.1 -0.5 9.3 5.2 5.9
Financials 0% 17%
Health Care 16% 13% MSCI World € 11.3 -9.9 -1.0 5.5 6.1
Industrials 33% 11%
S&P 500 € 13.2 -6.9 3.4 8.9 9.7
Information Technology 6% 16%
Telecomunications Services 0% 3% Euro STOXX 50 5.4 -21.2 -14.0 -3.1 -0.7
Open Ended Fund 1% 0%
Utilities 7% 3% Source: Cantor Fitzgerald Ireland Ltd Research, Bloomberg and Northern Trust.
Materials 4% 5%
Real Estate 2% 3% Annual Returns
Cash 5% 0%
Source: Cantor Fitzgerald Ireland Ltd Research 2000 2001 2002 2003 2004 2005 2006 2007 2008 2009 2010
2.40% -11.25% -30.00% 9.71% 14.38% 23.95% 22.52% 6.42% -38.47% 31.28% 13.47%
2011 2012 2013 2014 2015 2016 2017 2018 2019 2020
-19.61% 16.02% 19.87% 18.42% 15.72% 6.62% 6.8% -5.91% 23.34% -0.50%
Source: Cantor Fitzgerald Ltd Research, Bloomberg and Northern Trust
email: greeneffects@cantor.com
WARNING: Past performance is not a reliable guide to future performance. The value of your investment may go down as well as up.
CANTOR FITZGERALD IRELAND INVESTMENT JOURNAL MAY 2020 17INVESTMENT OPPORTUNITIES
STOCKWATCH
ALPHABET
Alphabet, the parent company of Google, is a global technology company. Its core business is an
advertising model built around several technology tools which have become almost indispensable in
modern life. The business is also continuously investing in new technologies to build on its connection
to the consumer and pushing the boundaries of the internet age. As a result of its success and
integration into the average person’s daily activities, it is increasingly becoming the source of
government oversight, which will likely be management’s next hurdle.
Alphabet’s primary business generates revenue pay to other platform operators to run Google
from advertising, reflecting c. 84% of group search as a default search option, namely Apple.
revenues. Alphabet’s advertising business lever- Increasing TAC costs were another source of
ages a range of online and mobile applications, concern for investors in 2018, which have again
referred to as "Google Properties". Google Prop- begun to show signs of stabilising at c. 18% of
erties includes, familiar products and service, advertising revenues.
Search, Gmail, Google Maps, Google Play and
Not only is Google a high growth business, it is
YouTube. The remaining 16% of revenues are
also a highly profitable business. The business
generated from Google’s other revenues, which
generated an operating margin of 19.4% in Q1
include Android’s (smartphone operating plat-
2020. Capital expenditures in the business are
form) Apps and Digital Content, Cloud, Hardware
generally recognised in the income statement,
and YouTube subscriptions. Google also has a
with the current years R&D spend expected to
small division called “other bets”, which includes
be close to 2019’s number of €12.2bn or 16.2%
a collection of research and development prod-
of revenues (compared to 15.6% for FY18). The
ucts including Waymo (autonomous cars), X
unchanged level of capex reflects the company’s
(secretive research division investigating appli-
intention to hire fewer employees in the first
cations across robotics and artificial intelligence
half of the current year. The balance sheet is
(AI)) and investment vehicles (GV (Google Ven-
exceptionally strong with extremely high cash
tures) & Google Capital).
levels, minimal debt and high shareholder
Google continues to impress investors as it equity.
grows its top line by c. 20% annually. Revenue
While advertising revenues have slowed in
growth had been trending lower from 2018
recent weeks, other areas of the company’s
into 2019, having fallen from highs of 26% year
portfolio of businesses are benefitting from the
over year in Q1 18 to 17% in Q1 19, causing in-
lockdown. In particular, its YouTube division
vestors to question whether the model remained
which experienced a strong increase in usage,
attractive. Growth rates recovered back to long-
saw advertising revenues increase 33% from
term averages of 19% in 2019, broadly in line
Q1 2019. Also, the groups Cloud division, which
with its 5-year average growth rate of 19.5%.
accounts for 14% of group revenue, saw its
In its most recent set of results for Q1 2020 rev- revenues increase by 56% from Q1 2019.
enue growth dipped to just over 15% as the
One of the primary risks associated with Google
impact of weaker advertising revenues as a
are antitrust investigations and patent and in-
result of Covid-19 impacted. While the company
tellectual property rights. Antitrust violations
did caution that advertising revenues would
relate to the infringements on competition law.
slow further in Q2 2020, we expect a strong re-
The European Commission has fined Google
bound in the second-half of the year as economic
on three occasions, for various infringements
activity rebounds.
of EU competition law. The three fines, all of
Traffic acquisition costs (TAC) are the fees Google which are subject to appeals, amount to €8.2bn
18 CANTOR FITZGERALD IRELAND INVESTMENT JOURNAL MAY 2020($9.5bn). The first fine relates to the display and debate for some time. Alphabet is the subject
ranking of shopping search results and ads of several patent and intellectual property rights
from 2015 saw a fine of €2.4bn. The second, re- lawsuits, which could result in substantial mon-
lates to provisions in Google’s Android-related etary damages, costly royalty or licensing agree-
distribution agreements, amounted to €4.3bn ments, or orders preventing certain features,
in 2016. And the final decision relates to con- functionalities, products, or services.
tractual provisions in agreements that Google
The shares are unchanged year-to-date but are
had with AdSense for Search (AFS) partners,
trading approximately 12% from both their
which amounted to €1.5bn in 2016.
February 2020 high and consensus price targets.
Competition authorities in Brazil, Argentina, At current levels the shares are trading on 30x
India and Korea have investigations ongoing. 2020 earnings and while this is well above its 5
The biggest risk on the antitrust front will be if year average of 20x, the potential for a strong
the US begin investigating similar matters. The rebound in advertising revenue in the second
size and volume of personal data that Alphabet half of 2020 provides the potential for a further
and other large technology companies hold expansion in revenues and earnings.
on consumers have been subject to political
ALPHABET SHARE PRICE
Source: Bloomberg
Warning: Past performance is not a reliable guide to future performance. The value of your
investment may go down as well as up
CANTOR FITZGERALD IRELAND INVESTMENT JOURNAL MAY 2020 19DISCRETIONARY STRATEGIES
CALIBRATING DISCRETIONARY PORTFOLIO
POSITIONING THROUGH THE CORONAVIRUS
CRISIS
As lockdowns start to ease across Europe, and Q1 company results/outlooks are not as bad as feared,
perhaps equity markets bottomed out a few weeks ago around March 23rd, but it will take a few
months to see whether we did see the bottom, or has the rally of the past few weeks been a false rally
within a bear market and we return again to those very low market levels. What we do know is that
the fall between late February to late March was the most rapid ever while the recovery since March
23rd has also been sharp and rapid. The chart below, courtesy of Goldman Sachs captures this well
(orange is current 2020 market, blue line is average of bear markets since 1970, and shaded light blue
Pramit Ghose, area is 10th – 90th percentile range of these bear markets).
Global Strategist
155 10th/90th Percentile
Average
Current
145
135
125
115
105
-9m -6m -3m +3m +6m +9m
95
1 year before Equity Bear Market End 1 year after
For investors who can look out 12 to 18 months and longer, history in the form of the Spanish Flu of
1918-1919 offers a positive outlook. There were three waves of the Spanish flu throughout 1918 and
1919; March 1918 for a few months, October to December 1918, and a final wave in the spring of
1919 – after that the virus more or less disappeared, probably due to improved treatments, or a
mutation into a less lethal form. During this pandemic, in which some 500m people were infected (a
third of the world’s population then) and death estimates range from 20m to 50m [Source: Wikipedia
and Stanford], there were similar lockdowns and economic disruptions and sharp drops in demand
as the current COVID-19 one.
So you might be surprised at the performance of the US equity market (and equity styles within the
US market) over this period. Markets had peaked in late 1916, but then dropped about 20% into late
1917 due to concerns around World War 1. After that, as the war came to an end, markets started to
recover, with a relatively modest c.5% dip in the spring of 1918 as the first wave of the Spanish Flu hit.
Thereafter, despite the two further pandemic waves, markets continued to recover, and by February
1919 had recovered all the losses since the late 1916 peak.
Warning: Past Performance is not a reliable guide to future performance
20 CANTOR FITZGERALD IRELAND INVESTMENT JOURNAL MAY 2020World War 1 and the Spanish Flu
Source: Robeco (Market = US equity market, LowVol = low volatility shares, Div = Dividend yield shares, MOM = Momentum shares, Small = smallcap shares)
If we were to follow a similar pattern, assuming as with the Spanish Flu that after 12 to 15 months the
Coronavirus is under control and life heading back to ‘normality’ albeit with some significant lifestyle
changes, then we could be looking at equity markets re-attaining their February 2020 levels (some 25%
higher than current levels) around early/mid 2022. It’s a not unrealistic outcome if we get the virus under
control and a vaccine available by mid 2021. If equity markets get back to within 10% of the February
2020 levels by early 2022, then, with dividends (yes, there are still plenty being paid!), one is looking at
about a mid-teens return, still attractive versus zero or negative on € deposits or high quality Euro
sovereign bonds.
The short-term is probably more difficult to gauge. We’ve had a rebound, the markets seem more relaxed
about the path of lockdown easing and economic recovery than perhaps reality. Any setbacks in
lockdown easing, mortality rates, or a re-infection scenario, could lead to another sharp setback. History
suggests market setbacks are likely in the path to recovery, and the two most recent significant bear
markets, the Tech bear market in 2000 – 2003 and the Financial Crisis bear market in 2007 to 2009, had
a zigzag path to recovery. See chart below, courtesy of Bank of America:
3400
3200
3000
VIX peak
S&P 500
2800 2002 path
2600 Current path
2400 1987 path
2008 path
2200
2000
16-Apr-20
26-Mar-20
28-May-20
20-Aug-20
10-Sep-20
2-Jan-20
13-Feb-20
5-Mar-20
7-May-20
23-Jan-20
18-Jun-20
9-Jul-20
30-Jul-20
Source: BofA Global Research. The VIX peaked in 19-Oct-87, 5-Aug-02, 20-Nov-08, and 16-Mar-20.
Warning: Past Performance is not a reliable guide to future performance
CANTOR FITZGERALD IRELAND INVESTMENT JOURNAL MAY 2020 21DISCRETIONARY STRATEGIES
CALIBRATING DISCRETIONARY PORTFOLIO
POSITIONING THROUGH THE CORONAVIRUS
CRISIS CONTINUED
One could argue the current market (blue) is sort of tracking the 2008 path (orange), which would
suggest another downleg over the summer (as do the 1987 and 2002 paths).
Of course, nobody knows the likely short-term path of financial markets. And managing client
expectations through this period is difficult. Investors look out 18 to 24 months and see the recovery
potential as outlined earlier, and naturally want us to ensure their funds with us participate and benefit
from the recovery potential. But they also see how everyday life has been affected by the lockdowns
and, if they haven’t lost their jobs/had to restructure/close down their businesses, have certainly got
friends who have. And we are all pushing out our expectations of travel and going to
bars/restaurants/concerts. So they are naturally concerned the markets have another downleg or two
in the path to recovery, and so want us to protect their assets. That leaves us with the difficult path of
managing downside risk while simultaneously positioning portfolios to benefit from upside potential.
Hence the title of this article…’calibrating portfolio positioning’. The medium-term view looking out
to late 2021 looks reasonably attractive as asset prices have declined significantly. The financial market
risks of the virus have been recognised and understood, even if uncertainty remains, investors are
(naturally) cautious and risk averse, usually a good time to invest.
The short term, however, remains very uncertain, but it seems like the world is looking out to a recovery
phase from the coronavirus, governments and the monetary authorities have acted quickly to mitigate
extreme financial stresses, hence in our view the likelihood of markets dropping 20% sharply has
reduced. Of course we will have volatility throughout the coming months as we get setbacks in the
virus recovery phase; we would actually like some setbacks in the markets (but not the virus recovery
path) to be able to continue to calibrate portfolios to less defensive positioning.
Averaging-in new cashflows and pro-cyclical stock positions is a patience game – it has the best
risk/reward ratio in terms of calibrating portfolio positioning, improving upside potential while still
maintaining reasonable portfolio protection. As renowned US investor Howard Marks wrote recently:
‘conditions have changed such that caution is no longer an imperative’.
Warning: Past Performance is not a reliable guide to future performance
22 CANTOR FITZGERALD IRELAND INVESTMENT JOURNAL MAY 2020Latest News
May 2020
Market Round-Up 24
CANTOR FITZGERALD IRELAND INVESTMENT JOURNAL MAY 2020 23LATEST NEWS
MARKET ROUND-UP
Ed Murray, Senior Portfolio Manager
APRIL 2020
PMI data hits record lows
The latest data we’ve seen is stark and projections make the impact of the Global Financial Crisis (GFC)
pale in significance. The recent collapse in Services PMI’s points to a larger and faster shock to global
economies. The potential impact remains unknown, which increases the uncertainty across all asset
Ed Murray, classes and their fair values.
Senior Portfolio
Manager European Services PMIs see record contraction in April 2020
COUNTRY COMMENT MARCH READINGS APRIL READINGS
Eurozone All time low 29.7 13.5
Ireland 3rd lowest on record 32.5 TBC
France Record contraction 27.4 10.4
Germany Record drop 31.7 15.9
UK Record fall 34.5 12.9
US Record fall 40.9 27.4
2 years of digital transformation in 2
months… Microsoft CEO Satya Nadella
While markets have been volatile, the
technology sector has outperformed the market.
The Nasdaq index was up 15% in the month, its
strongest monthly performance since 2000,
demonstrating strong demand for the tech
sector, as investors re-position their portfolios in
this new world and identify the winners. The big
winners so far are Amazon, Microsoft, Alphabet, US Oil collapses into negative territory
Apple and Netflix.
US oil prices turned negative for the first time on
History in the making record in April, after oil producers ran out of
Fine Gael & Fianna Fail, two of Irelands largest space to store the oversupply of crude left by the
political parties are getting closer to forming a coronavirus crisis, triggering an historic market
coalition government. While they have very collapse which left oil traders reeling.
similar policies, the historical split between these China begins to re-open
two parties still reverberates throughout Irish
households. The combination of these two There is further evidence of the rapid bounce
parties is not enough to get a majority, opening back in Chinese activity. The luxury goods
up the door for the Green Party to take a seat at company LVMH said sales in mainland China
the table. increased 50% yoy in April, after a 15% drop in
1Q, as consumers “flock back to stores after the
corona virus lockdown”. Consumer Staples like
P&G and L’Oreal are reflecting similar trends, and
confirmed the pick-up we had seen in economic
data on the ground (traffic, steel consumption,
auto sales etc). This bodes well for markets on
the west's eventual reopening.
Warning: Past performance is not a reliable guide to future performance. The value of your investment my go down as well as up
24 CANTOR FITZGERALD IRELAND INVESTMENT JOURNAL MAY 2020New & improved
Client Portal
Your portfolio
at your fingertips
Access all of your account information through a single login
View information updates in the Notifications Centre
Easy to use, intuitive user interface
For more information contact your broker or our Client Services team
www.cantorfitzgerald.ie/cantorportal/
Twitter : @cantorIreland LinkedIn : Cantor Fitzgerald Ireland
Cantor Fitzgerald Ireland Ltd is regulated by the Central Bank of Ireland. Cantor Fitzgerald Ireland Ltd is a member firm of the Irish Stock Exchange and the London Stock Exchange.R
CANTOR FITZGERALD IRELAND
MULTI-ASSET FUND RANGE
The Merrion Investment Managers Multi-Asset Range of funds is designed to suit investors with different risk appetites.
KEY FEATURES
MULTI-ASSET MULTI-ASSET MULTI-ASSET
• Actively managed investment process
• Diversification across a range of assets
• Ability to deliver strong returns with
reduced volatility in times of market stress
30 50 70
20%-40% in
Growth assets
40%-60% in
Growth assets
60%-80% in
Growth assets
• Long term fundamental holdings with short 80%-60% in 60%-40% in 40%-20 in
term tactical opportunities Defensive Assets Defensive Assets Defensive Assets
PERFORMANCE
The table shows what these funds have typically returned over 4, 5 and 6 years (increasing the time period as the risk of the fund
increases). These returns have been delivered despite the many crises that financial markets have faced over the last 20+ years.
SUMMARY STATISTICAL RETURNS (since inception - March 2020)
MEDIUM TERM INVESTMENT HORIZON MMA30 (4yr)* MMA50 (5yr)* MMA70 (6yr)
Annualised Rolling Return: Average 5.59% p.a.* 6.12% p.a.* 8.51% p.a.
* Include both actual returns from 21 July 2015 to 31st March 2020, and simulated returns prior to 21 July 2015.
PERFORMANCE COMPARED WITH SIMILAR FUNDS & THE GLOBAL EQUITY MARKET
MMA30 Average* MMA50 Average* MMA70 Average* MSCI ACWI
YTD -3.80% -8.30% -7.10% -12.90% -10.50% -16.40% -19.50%
1 Yr 0.20% -3.80% -1.50% -6.40% -3.10% -8.20% -9.20%
Returns gross of annual management charge
*Average of selection of equivalent funds available on the Irish market from other providers (Irish Life, Aviva, LGIM, Friends First, New Ireland, Zurich)
Warning: These figures are estimates only. They are not a reliable guide to future performance. The value of your
investment may go down as well as up.
For further information or to arrange a meeting contact:
DUBLIN 01 633 3633 | CORK 021 422 2122 | LIMERICK 061 436 500
www.cantorfitzgerald.ie
Cantor Fitzgerald Ireland Ltd is regulated by the Central Bank of Ireland. Cantor Fitzgerald Ireland Ltd is a member firm of the Irish Stock Exchange and the London Stock Exchange.Performance
DATA
May 2020
Investment Returns 28
Long Term Investment Returns 29
Bond Returns 30
CANTOR FITZGERALD IRELAND INVESTMENT JOURNAL MAY 2020 27PERFORMANCE DATA
INVESTMENT RETURNS
Equities
Index 31/03/20 30/04/20 % Change % ytd Change 52 Week High Date
ISEQ 5153.65 5603 8.7% -22.0% 7,386 10/01/2020
FTSE 5671.96 5901.21 4.0% -21.8% 7,727 30/07/2019
DAX 9935.84 10861.64 9.3% -18.0% 13,795 17/02/2020
Eurostoxx50 2786.9 2927.93 5.1% -21.8% 3,867 20/02/2020
Stoxx600 (Europe) 320.06 340.03 6.2% -18.2% 434 19/02/2020
Nasdaq (100) 7813.499 9000.509 15.2% 3.1% 9,737 19/02/2020
Dow Jones 21917.16 24345.72 11.1% -14.7% 29,569 12/02/2020
S&P500 2584.59 2912.43 12.7% -9.9% 3,394 19/02/2020
Nikkei 18917.01 20193.69 6.7% -14.6% 24,116 17/01/2020
Hang Seng 23603.48 24643 4.4% -12.6% 30,082 03/05/2019
China (Shanghai Composite) 2750.296 2860.082 4.0% -6.2% 3,127 14/01/2020
India 29468.49 33717.62 14.4% -18.3% 42,274 20/01/2020
MSCI World Index 1852.73 2052.85 10.8% -13.0% 2,435 12/02/2020
MSCI BRIC Index 268.31 289.43 7.9% -14.9% 354 20/01/2020
Currencies
Currency Pair % Change % ytd Change 52 Week High Date
EuroUSD 1.1031 1.0955 -0.7% -2.3% 1.1495 09/03/2020
EuroGBP 0.88823 0.86984 -2.1% 2.8% 0.9501 19/03/2020
GBP/USD 1.242 1.2594 1.4% -5.0% 1.3514 13/12/2019
Euro/AUD 1.79935 1.6823 -6.5% 5.3% 1.9802 19/03/2020
Euro/CAD 1.55142 1.52759 -1.5% 4.9% 1.5993 19/03/2020
Euro/JPY 118.64 117.42 -1.0% -3.6% 124.6600 03/05/2019
Euro/CHF 1.06041 1.05776 -0.2% -2.6% 1.1440 07/05/2019
Euro/HKD 8.5491 8.4919 -0.7% -2.8% 8.9261 09/03/2020
Euro/CNY 7.7931 7.7285 -0.8% -1.1% 7.9805 09/03/2020
Euro/INR (India) 82.7849 81.6455 -1.4% 1.9% 85.0320 09/03/2020
Euro/IDR (Indonesia) 17906.34 16194.9 -9.6% 4.1% 18,207.2700 01/04/2020
AUD/USD 0.6131 0.6512 6.2% -7.2% 0.7082 19/07/2019
USD/JPY 107.54 107.18 -0.3% -1.3% 112.2300 20/02/2020
US Dollar Index 99.048 99.016 0.0% 2.7% 102.9920 20/03/2020
Commodities
Commodity % Change % ytd Change 52 Week High Date
Oil (Crude) 20.48 18.84 -8.0% -69.1% 63.73 08/01/2020
Oil (Brent) 22.74 25.27 11.1% -61.7% 73.40 20/05/2019
Gold 1577.18 1686.5 6.9% 11.2% 1,747.36 14/04/2020
Silver 13.974 14.9697 7.1% -16.1% 19.65 04/09/2019
Copper 222.8 234.4 5.2% -16.2% 289.85 16/01/2020
CRB Commodity Index 370.2 353.23 -4.6% -12.0% 420.13 01/05/2019
DJUBS Grains Index 27.0837 25.4635 -6.0% -13.0% 32.38 17/06/2019
Gas 1.64 1.949 18.8% -11.0% 2.91 05/11/2019
Wheat 568.75 524.25 -7.8% -6.2% 589.00 22/01/2020
Corn 340.75 320 -6.1% -17.5% 478.00 18/06/2019
Bonds
Issuer Yield Change % ytd Change 52 Week High Date
Irish 5yr -0.167 -0.283 -0.12 -9.3% 0.20 18/03/2020
Irish 10yr 0.069 0.047 -0.02 -60.5% 0.60 18/03/2020
German 2yr -0.689 -0.76 -0.07 26.5% -0.57 25/03/2020
German 5yr -0.653 -0.762 -0.11 61.1% -0.37 19/03/2020
German 10yr -0.471 -0.586 -0.12 216.8% 0.05 03/05/2019
UK 2yr 0.139 0.017 -0.12 -96.9% 0.80 03/05/2019
UK 5yr 0.212 0.09 -0.12 -85.0% 0.95 03/05/2019
UK 10yr 0.356 0.231 -0.13 -71.9% 1.22 03/05/2019
US 2yr 0.2455 0.1956 -0.05 -87.5% 2.37 03/05/2019
US 5yr 0.3799 0.3624 -0.02 -78.6% 2.38 03/05/2019
US 10yr 0.6695 0.6393 -0.03 -66.7% 2.57 03/05/2019
Source for all tables above: Bloomberg and Cantor Fitzgerald Ireland Ltd Research.
28 CANTOR FITZGERALD IRELAND INVESTMENT JOURNAL MAY 2020PERFORMANCE DATA
LONG TERM INVESTMENT RETURNS
Asset Class Performances (returns in Local Currency)
Equities
2007 2008 2009 2010 2011 2012 2013 2014 2015 2016 2017 2018 2019 2020
MSCI World Index 9.8% -40.2% 30.9% 12.5% -4.9% 16.7% 27.5% 2.9% -1.9% 5.3% 20.1% -10.4% 25.2% -13.0%
MSCI Emerging Market Index 39.7% -53.1% 78.7% 19.4% -18.2% 18.7% -2.3% -4.6% -17.2% 8.6% 34.3% -16.6% 15.4% -17.0%
China 98.0% -64.9% 82.6% -12.8% -20.2% 5.8% -3.9% 52.9% 10.5% -12.3% 6.6% -24.6% 22.3% -6.2%
Japan -10.0% -41.1% 21.1% -1.3% -15.6% 25.6% 59.4% 7.1% 9.1% 0.4% 19.1% -12.1% 18.2% -14.6%
India 48.8% -51.8% 78.5% 19.1% -23.6% 28.0% 9.8% 30.1% -5.6% 1.8% 27.9% 6.7% 13.8% -18.4%
S&P500 5.6% -37.0% 26.4% 15.1% 2.1% 16.0% 32.4% 11.4% 0.2% 9.5% 19.4% -6.2% 28.9% -9.9%
Eurostoxx50 10.4% -41.8% 27.0% -1.8% -13.1% 19.6% 22.7% 1.2% 4.5% 0.7% 6.5% -14.3% 24.8% -21.8%
DAX 22.3% -40.4% 23.8% 16.1% -14.7% 29.1% 25.5% 2.7% 9.6% 6.9% 12.5% -18.3% 25.5% -18.0%
ISEQ -24.7% -65.1% 29.8% -0.1% 2.6% 20.4% 35.7% 15.1% 31.2% -4.0% 8.0% -22.1% 31.1% -22.0%
Commodities
2007 2008 2009 2010 2011 2012 2013 2014 2015 2016 2017 2018 2019 2020
Gold 31.3% 5.5% 24.0% 29.7% 10.2% 7.0% -28.3% -1.5% -10.5% 8.6% 13.7% -2.1% 18.9% 11.2%
Brent Oil 54.2% -51.4% 70.9% 21.6% 13.3% 3.5% -0.3% -48.3% -36.4% 52.4% 17.7% -19.5% 22.7% -61.7%
Crude Oil 57.2% -53.5% 77.9% 15.1% 8.2% -7.1% 7.2% -45.9% -31.3% 45.0% 12.5% -24.8% 34.5% -69.1%
Copper 5.9% -53.6% 137.3% 32.9% -22.7% 6.3% -7.0% -16.8% -24.0% 17.4% 31.7% -20.3% 6.3% -15.8%
Silver 15.4% -23.8% 49.3% 83.7% -9.8% 8.2% -35.9% -19.5% -11.3% 15.8% 7.2% -9.4% 15.3% -16.9%
CRB Commodity Index 14.1% -23.8% 33.7% 23.6% -7.4% 0.4% -5.7% -4.1% -14.6% 12.9% 2.2% -5.4% -1.9% -12.0%
Currencies
2007 2008 2009 2010 2011 2012 2013 2014 2015 2016 2017 2018 2019 2020
Euro/USD 10.5% -4.3% 2.0% -6.6% -3.2% 1.8% 4.1% -12.1% -9.7% -3.1% 14.1% -4.5% -2.2% -2.3%
Euro/GBP 9.1% 30.0% -7.2% -3.3% -2.8% -2.6% 2.2% -6.5% -5.0% 15.7% 4.1% 1.2% -5.9% 2.8%
GBP/USD 1.3% -26.5% 10.2% -3.3% -0.4% 4.6% 1.9% -6.0% -4.9% -16.3% 9.5% -5.5% 4.1% -5.0%
US Dollar Index -8.3% 6.1% -4.2% 1.5% 1.5% -0.5% 0.4% 12.7% 8.9% 3.6% -9.9% 4.3% 0.3% 2.7%
Source for all tables above: Bloomberg and Cantor Fitzgerald Ireland Ltd Research
Warning: Past performance is not a reliable guide to future performance.
CANTOR FITZGERALD IRELAND INVESTMENT JOURNAL MAY 2020 29PERFORMANCE DATA
INDICATIVE PERFORMANCE FIGURES &
MATURITY DATES MAY 2020
Cantor Fitzgerald Capital Protected Products
Cantor Fitzgerald Capital Protected Products Underlying Indicative Indicative Indicative Option A Option B Option A Option B
Asset Initial Current Underlying Asset Participation Participation Indicative Indicative
(Ticker) Strike Level Performance Rate Rate Performance Performance
EUROSTOXX 50 DOUBLE GROWTH NOTE* SX5E 2986.73 2927.93 -1.97% 200% 0.00% N/a
US $ Dividend Aristocrats Bond III SPXD8UE 2255.84 2185.97 -3.10% 100% 220% 0.00% 0.00%
US $ Dividend Aristocrats Bond IV SPXD8UE 2206.04 2185.97 -0.91% 80% 200% 0.00% 0.00%
US $ Dividend Aristocrats Bond V SPXD8UE 2336.40 2185.97 -6.44% 50% 170% 0.00% 0.00%
US $ Dividend Aristocrats Bond VI SPXD8UE 2357.33 2185.97 -7.27% 50% 140% 0.00% 0.00%
PROTECTED ABSOLUTE RETURN STRATEGIES* SLGLARA 12.05 11.43 -5.20%
CARMPAT 615.33 621.16 0.95%
ETAKTVE 128.74 134.14 4.19%
Weighted Basket -0.02% 120% 0.00% N/a
GLOBAL REAL RETURN NOTE* BNGRRAE 1.27 1.28 0.50% 150% 0.75% N/a
PROTECTED MOMENTUM BOND* MSQTDFAA 1.46 1.37 -6.32% 200% 0.00% N/a
PROTECTED MOMENTUM BOND II* MSQTDFAA 1.46 1.37 -6.39% 200% 0.00% N/a
PROTECTED MOMENTUM BOND III* MSQTDFAA 1.52 1.37 -9.60% 200% 0.00% N/a
PROTECTED BEST SELECT BOND* SGMDBSFE 155.51 143.63 -7.64% 200% 0.00% N/a
PROTECTED BEST SELECT BOND II* SGMDBSFE 152.86 143.63 -6.04% 200% 0.00% N/a
PROTECTED BEST SELECT BOND III* SGMDBSFE 151.87 143.63 -5.42% 200% 0.00% N/a
PROTECTED BEST SELECT BOND IV* SGMDBSFE 148.10 143.63 -3.02% 200% 0.00% N/a
PROTECTED BEST SELECT BOND V* SGMDBSFE 143.95 143.63 -0.22% 200% 0.00% N/a
PROTECTED BEST SELECT BOND 6* SGMDBSFE 148.01 143.63 -2.96% 200% 0.00% N/a
PROTECTED BEST SELECT BOND 7* SGMDBSFE 149.98 143.63 -4.23% 200% 0.00% N/a
PROTECTED BEST SELECT BOND 8* SGMDBSFE 147.95 143.63 -2.92% 200% 0.00% N/a
PROTECTED BEST SELECT BOND 9* SGMDBSFE 150.42 143.63 -4.51% 180% 0.00% N/a
PROTECTED STAR PERFOMERS BOND* BNPIAFST 130.53 133.33 2.14% 180% 3.86% N/a
PROTECTED STAR PERFOMERS BOND II* BNPIAFST 130.91 133.33 1.85% 170% 3.14% N/a
PROTECTED STAR PERFOMERS BOND III* BNPIAFST 133.58 133.33 -0.19% 170% 0.00% N/a
PROTECTED STAR PERFOMERS BOND IV* BNPIA2MT 166.28 164.35 -1.16% 200% 0.00% N/a
PROTECTED STAR PERFOMERS BOND V* BNPIA2MT 165.75 164.35 -0.84% 200% 0.00% N/a
PROTECTED STAR PERFOMERS BOND VI* BNPIA2MT 166.02 164.35 -1.00% 200% 0.00% N/a
PROTECTED STAR PERFOMERS BOND 7* BNPIA2MT 168.56 164.35 -2.50% 200% 0.00% N/a
PROTECTED STAR PERFOMERS BOND 8* BNPIA2MT 168.78 164.35 -2.62% 200% 0.00% N/a
PROTECTED STAR PERFOMERS BOND 9* BNPIA2MT 168.28 164.35 -2.34% 200% 0.00% N/a
Strike and Maturity Dates for Cantor Fitzgerald Bonds:
Bond Strike Date Maturity Date
Protected Absolute Return Strategies 24/03/16 31/03/21
US $ Dividend Aristocrats Bond III 26/03/18 06/03/23
US $ Dividend Aristocrats Bond IV 31/05/19 08/05/23
US $ Dividend Aristocrats Bond V 26/07/19 03/05/23
US $ Dividend Aristocrats Bond VI 22/11/19 29/10/24
EuroSTOXX 50 Double Growth Note 24/03/16 09/04/21
Global Real Return Note 29/04/16 12/07/21
Protected Momentum Bond 27/09/19 27/09/24
Protected Momentum Bond II 22/11/19 06/12/24
Protected Momentum Bond III 24/04/20 31/01/25
Protected Best Select Bond 15/06/18 22/06/23
Protected Best Select Bond II 14/08/18 21/08/23
Protected Best Select Bond III 26/09/18 03/10/23
Protected Best Select Bond IV 02/11/18 09/11/23
Protected Best Select Bond V 21/12/18 02/01/24
Protected Best Select Bond 6 27/02/19 05/03/24
Protected Best Select Bond 7 23/04/19 30/04/24
Protected Best Select Bond 8 14/06/19 21/06/24
Protected Best Select Bond 9 16/08/19 23/08/24
Protected Star Performers Bond 27/09/16 30/09/22
Protected Star Performers Bond II 16/12/16 21/12/22
Protected Star Performers Bond III 16/03/17 22/03/22
Protected Star Performers Bond IV 24/05/17 30/05/22
Protected Star Performers BondV 26/07/17 02/08/22
Protected Star Performers BondVI 20/09/17 27/09/22
Protected Star Performers Bond 7 24/11/17 01/12/22
Protected Star Performers Bond 8 21/12/17 28/12/22
Protected Star Performers Bond 9 09/03/18 16/03/23
Source for all tables above: Bloomberg.
30 CANTOR FITZGERALD IRELAND INVESTMENT JOURNAL MAY 2020You can also read