Know our Whenua Aotearoa, New Zealand - iLearn Education
←
→
Page content transcription
If your browser does not render page correctly, please read the page content below

Copyright ©
               © 2022
                 2022 iLearn Education. All
                                        All rights
                                            rights reserved.
     Copyright        iLearn Education.            reserved.   1.

Know our Whenua
 Aotearoa, New Zealand
Copyright
                  Copyright ©
                            © 2022
                              2022 iLearn Education. All
                                                     All rights
                                                         rights reserved.
                                   iLearn Education.            reserved.   2.

                       Outline
         Multi-level, cross-strand, mathematics
         activity, covering Levels 1-5 of the NZC.

Students who have a Maths-Whizz account will use their username
 and password to login to the supplementary interactive exercises.

For Students without a current Maths-Whizz account please email
info@ilearn.co.nz for the username and password for access to the
           whizz supplementary interactive activities.

                   NZ Geography
                         ▪ Volcanoes
                         ▪ Road Trip

        Ethnicity and Population
       Weather and Atmosphere
                               ▪ Rainfall
                               ▪ Ozone
Copyright © 2022 iLearn Education. All rights reserved.         3.

              NZ Geography - Volcanoes
                     Statistics - Tables and Graphs
                    Geometry - Compass directions

                             Maths-Whizz Links:
                                           Level 1
Solve a given problem by sorting, classifying and organising information in simple
                            ways, such as a block graph

                                          Level 2
          Recognise and use the four compass directions-N, S, E, and W
              Answer questions about information in a block graph

                                          Level 3
                         Drawing bar line graphs in 100’s
                          Reading bar line graphs in 10’s
                         Reading bar line graphs in 100’s

                                          Level 4
                         Use the eight compass directions
                Use the eight compass directions giving directions
                Learning about angles in a circle: compass points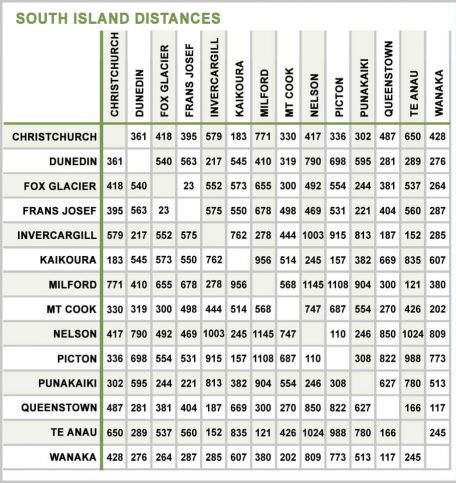
Copyright © 2022 iLearn Education. All rights reserved.   4.
      Fill in the names of the missing volcanoes

Auckland Volcanic Field
Copyright © 2022 iLearn Education. All rights reserved.              5.

Overall Aims:
In this activity students will be involved in researching data, drawing graphs,
completing tables and reading information from tables. They will also be looking
at compass directions.

Activity:
Your whanau have decided to visit all of the following active volcanoes.

1. Refer to the map to answer the following:
       a. Which is the volcano that lies furthest North?
       b. Which is the volcano that lies furthest South?
       c. Which is the volcano that lies furthest East?
       d. Which is the volcano that lies furthest West?
       e. Which volcano lies NW of White Island?
       f. Which Volcano lies SW of Ngauruhoe?
       g. Which Volcano lies SE of Mayor Island?
       h. Which volcano lies NE of Tongariro?

Questions:
Research and complete the table below of volcanoes on the North Island.

1. What is the highest volcano?
2. What is the difference between the highest and lowest volcanoes?
3. Which one most recently erupted?
4. How many years between the two most recent eruptions?

Volcano                                Elevation                            Last Erupted
Ngauruhoe
Mayor Island
Taranaki
Tarawera
Tongariro
Ruapehu
White Island

Graphing:
5. Draw a bar graph showing all volcanoes arranged from highest to lowest
(refer to student resource sheet for a blank graph).
Copyright © 2022 iLearn Education. All rights reserved.         6.

              NZ Geography - Road Trip
                   Geometry - Shapes, Tessellation
                      Measurement - Tables

                             Maths-Whizz Links:
                                           Level 1
    Use one or more shapes to make, describe and continue repeating patterns
Solve a given problem by sorting, classifying and organising information in simple
                            ways, such as a block graph

                                          Level 2
              Use the mathematical names for common 2-D shapes
               Sort 2-D shapes and describe some of their features
                                 Identifying 2D shapes
                                   Classify 2D shapes
                              Begin to name flat shapes
Copyright © 2022 iLearn Education. All rights reserved.               7.

Overall Aims:
In this activity students will be involved in looking at different shapes,
tessellations, and looking at efficiency of packing (shapes).

Activity:
Name the shape of each sign. If there is more than one shape in a sign identify all
of them. (resource colouring sheet available)
What do the signs mean?

                         DO NOT                           GIVE
STOP                      ENTER
                                                             WAY

    P
                                                                                RA

                                                                                     NG
                                                                                IL
                                                                                 SI
   120

                                                                                OS
                                                                                     RO
                                                                                CR
                        ONLY ONLY

                                                                                       AD

                              SCHOOL

                                                               SCHOOL
       MOTORWAY                                                  BUS
                                                                ROUTE
Copyright © 2022 iLearn Education. All rights reserved. 8.
Questions:
1. Write the name of the four animals. Find out the names of the countries you are
likely to see these signs in.
a.
b.
c.
d.
Tessellations:
A road sign maker wants to work out how much it will cost to produce each type of
sign. As such they want to have the minimum amount of wastage as possible. How
many of this shape could you fit onto an A4 page? (printable masters in the
‘Student Resource Sheet - Know our Whenua (land)’ document).
GIVE
100 STOP WAY
1. Draw a tessellation pattern from your selected shape.
When laying your shapes out on a piece of A4 paper...
2. Which shape created the most wastage?
3. Which shape creates the least wastage?
4. Extension - look at the maths behind efficiency of packing - areas of shapes
Let’s investigate the maths behind the efficiency of packing the shapes together.
- calculate total area of shapes laid out on your A4 paper.
- calculate the total area of an A4 page.
- calculate the percent of wastage in each scenario.Copyright © 2022 iLearn Education. All rights reserved. 9.
Road Trip - Places
Places to Visit
Measurement - Distance, Speed, Time, Tables
Geometry - Compass position
Statistics - Tables and Graphs
Number - Calculations, Percentages
Maths-Whizz Links:
Level 1
Solve a given problem by sorting, classifying and organising information in a
pictogram
Solve a given problem by sorting, classifying and organising information in simple
ways, such as a block graph
Level 2
Drawing simple frequency tables
Interpret frequency tables
Level 3
Construct frequency tables for grouped discrete data
Level 4
Use two-way tables for discrete data
Construct frequency tables with given equal class intervals for sets of continuous data
Timetables
More complex timetables
Find the outcome of a given percentage decrease
Overall Aims:
In this activity students will be involved in finding places in NZ,
reading tables and finding optimal routes (minimising travel
distances), reading information from tables, and doing speed,
distance and time calculations. They will also look at the
construction of tally charts, using the tally chart to gain information,
and then transferring information on the tally chart into a histogram.Copyright © 2022 iLearn Education. All rights reserved. 10. Activity: Visit the following places: Christchurch Queenstown Nelson Punakaiki Franz Joseph Glacier Invercargill Milford Dunedin Kaikoura Wanaka Questions: 1. Plan your trip so that you cover the shortest total distance to travel to all 10 places. 2. In what order do you visit the places if you start in Nelson? (Extension Students - start in Christchurch)
Copyright © 2022 iLearn Education. All rights reserved.            11.

In terms of distance...
3. What is the longest day (in terms of distance travelled)?
4. What is the shortest day (in terms of distance travelled)?
5. What is the average distance travelled?

Distance, speed and time
6. If you are in Christchurch and it takes you 4 hours and 12 minutes to get to x,
travelling at an average of 80km/hr - looking at the table of distances above, what
town would you end up in?

7. From Christchurch if you travelled at an average of 80 km/hr and went to Mt
Cook, based on this data table how long would it take you?

8. From Christchurch, if you travelled to Wanaka, and it took you 6 hours, what
would your average speed be?

9. If you leave Franz Josef at 9am and you stop for an hour for lunch at Punakaiki,
and you travel at an average speed of 80 km/hr, and arrive at your destination at
4:38pm, what town do you end up in?

Cost of petrol?
10. If your car uses on average, 7L/100km, and you pay an average of $3 per litre of
petrol, what will your fuel costs for the trip (just for travelling between the centres
- not including extra sightseeing trips during the holiday).

11. Compare the cost of travelling by bus, car and plane between Nelson and
Queenstown?
       a. Which is the most expensive?
       b. Which is the cheapest?
       c. The most expensive is ??% more expensive than the cheapest (calculate the
       percentage).
       d. The cheapest is ??% cheaper than the most expensive (calculate the
       percentage).

12. If you travelled from Christchurch to Punakaiki.
        a. What is the quickest way to get from Christchurch to Punakaki?
        b. What is the highest point you will reach on the trip (and how high is it)?

13. If you were able to travel from Milford to Wanaka …
        a. And you were able to travel in a straight line, how far is this?
        b. And you had to travel by road, how far is this?
Copyright © 2022 iLearn Education. All rights reserved. 12.
Taumata whakatangi hangakoauau o tamatea turi
pukakapiki maunga horo nuku pokai whenua kitanatahu
Activity:
During your trip, you decide to visit ‘Taumata whakatangi hangakoauau o tamatea
turi pukakapiki maunga horo nuku pokai whenua kitanatahu’, famous for being
the place in NZ with the longest name.
1. Where is this place? Mark it on the map.
2. Construct a tally chart showing the frequency
of each letter appearing.
Letter Tally Total
a
e
g
...
...
3. How many letters in the place name?
a. How can you find this information from your tally chart?
4. Which is the most common letter in the place name?
5. Which is the least common letter?
6. Construct a histogram, graphing
all the letters. Arrange the letters
(on the horizontal/x axis) in
alphabetical order.Copyright © 2022 iLearn Education. All rights reserved. 13.
Ethnicity and Population
Statistics - Graphs, Tables
Number - Percentages
Maths-Whizz Links:
Level 1
Solve a given problem by sorting, classifying and organising information in a
pictogram
Solve a given problem by sorting, classifying and organising information in simple
ways, such as a block graph
Level 2
Drawing simple frequency tables
Interpret frequency tables
Answer questions about information in a block graph
Level 3
Construct frequency tables for grouped discrete data
Drawing bar line graphs in 100’s
Reading bar line graphs in 10’s
Reading bar line graphs in 100’s
Construct pie charts for categorical data
Interpret pie charts
Level 4
Use two-way tables for discrete data
Find the outcome of a given percentage decrease
Use ICT to generate and interpret pie charts
Overall Aims:
In this activity students will be involved in reading information from
a table and applying it to a pie graph and calculating percentage
increases. They will then take information from a table and use it to
create a histogram, then read information from the histogram.Copyright © 2022 iLearn Education. All rights reserved. 14.
Activity:
There are six major ethnic groups often listed in New Zealand: European, Māori,
Pacific peoples, Asian, MELAA (Middle Eastern / Latin American / African), and
‘Other ethnicity’- 2018 Census
Match the
Ethnic Group Ethnicity %
letter
Pacifica 8.1
Middle Eastern/
Latin American/ 1.5
African
European 70.2
Asian 15.1
Maori 16.5
Other ethnicity 1.2
Extension Activity: a b c d e f
- Population growth from 2018-2021
https://en.wikipedia.org/wiki/List_of_New_Zealand_urban_areas_by_population
Place Population 2021 Population 2018 Percentage Growth
Auckland 1,463,000 1,346091
Rotorua 58,400 54,204
Tauranga 155,200 136,713
Queenstown 15,450 13,533
Whangarei 54,300 50,784
Wellington 215,900 201,786
Dargaville 4,950 4,794
Tokoroa 14,300 13,210
Omokoroa 3,890 3,210
Christchurch 380,600 258,062
Whangamata 4,410 4,074
Rolleston 24,700 17,352
Morrinsville 8,410 7,758
Greymouth 8,310 7,965Copyright © 2022 iLearn Education. All rights reserved. 15. Questions: 1. Calculate the percentage population growth from 2018 to 2021. 2. Which is the fastest growing town/city? 3. Create a histogram showing each centre and their growth - order biggest growth to smallest (%). What is the fastest growing city/town in NZ? Graphing: 4. Graph the places and their populations. 5. Which place has the highest population? 6. Which place has the smallest population? 7. What is the average population of all of these places? 8. (Extension) What other factors could affect the population data that could influence results and need to be taken into account? https://en.wikipedia.org/wiki/List_of_cities_in_New_Zealand
Copyright © 2022 iLearn Education. All rights reserved.       16.

             Weather and Atmosphere
                                       Rainfall

               Measurement - Tables and Graphs
    Statistics - Data and Graphs, Statistical Enquiry Cycle

                            Maths-Whizz Links:
                                         Level 3
               Interpreting complex line graphs (comparisons)
                                 Drawing line graphs
                              Interpreting line graphs
                 Construct simple line graphs for time series

                                         Level 4
   Construct linear functions arising from real-life problems and plot their
corresponding graphs; discuss and interpret graphs arising from real situations
                              Interpreting line graphs
                              Interpreting line graphs
                           Interpret simple line graphs
Copyright © 2022 iLearn Education. All rights reserved. 17.
Overall Aims:
In this activity students will be involved in looking critically at information as
part of a PPDAC investigation. A question is posed and students are encouraged
to take the data, analyse it and use critical evaluation to come up with their own
conclusions.
Activity:
July 2022 rained a lot! Is NZ getting wetter over the years?
Rainfall in NZ - Dec/Jan/Feb (DJF), Mar/Apr/May (MAM), June/July/Aug (JJA)
and Sept/Oct/Nov (SON) - 1901 - 2022
climateknowledgeportal
Period 1901-1930 1931-1960 1961-1990 1991-2020
Dec Mar June Sept Dec Mar June Sept Dec Mar June Sept Dec Mar June Sept
Season Jan April July Oct Jan April July Oct Jan April July Oct Jan April July Oct
Feb May Aug Nov Feb May Aug Nov Feb May Aug Nov Feb May Aug Nov
Rainfall/ 231.51 396.55 415.78 426.23 246.27 396.77 430.75 410.34 222.65 402.26 432.43 413.13 215.43 392.34 436.70 412.30
mm
1. Draw a line graph showing the information in the table.
2. Over the past 100 years, is NZ getting wetter, drier, or remaining about the same?
3. Predict what the Summer rainfall (DJF) will be for the period 2021-2040.Copyright © 2022 iLearn Education. All rights reserved. 18.
Ozone
STEM - research and critical thinking
Statistics - Statistical Enquiry Cycle
Maths-Whizz Links:
Level 3
Interpreting complex line graphs (comparisons)
Interpreting line graphs
Level 4
Interpreting line graphs
Interpreting line graphs
Interpret simple line graphsCopyright © 2022 iLearn Education. All rights reserved. 19. Overall Aims: In this activity students will be involved in looking critically at information as part of a PPDAC investigation. A question is posed and students are encouraged to take the data, analyse it and use critical evaluation to come up with their own conclusions. Activity: What is Ozone, what is the Ozone layer, why is it important, and what are the effects of holes in this layer? Ozone is a gas that forms a naturally occurring layer in the upper atmosphere (stratosphere), protecting Earth from the sun’s ultraviolet (UV) light. The ozone hole is an area of reduced stratospheric ozone. It forms in spring over Antarctica because of ozone-depleting substances produced from human activities. Ultraviolet light is what causes sunburn and some forms of cancer, so protection from this is very important. Weather reports on TV will now often quote a ‘UV Index’, a number which tells us how long we should be staying out in the sun, and when to make sure we cover up and put on suncream. The hole(s) in the Ozone layer tend to be over the North and South Poles, and as NZ lies quite away South of the equator (closer to the South Pole), the Ozone hole over Antarctica is of particular interest to us in NZ as we wouldn’t want the hole to get so big it extends over our country. Here is an interesting animation that shows how the Ozone hole has changed over the past 40 years https://earthobservatory.nasa.gov/world-of-change/Ozone Check out this interactive graph showing how the Ozone hole has changed over the last 40 years. https://ourworldindata.org/grapher/antarctic-ozone-hole-area?country=~OWID_ WRL
Copyright © 2022 iLearn Education. All rights reserved.       20.

Stats on Ozone hole…
1. Is it getting bigger or smaller?
         a. Over the past 5 years
         b. Over the past 10 years
         c. In the 20 years from 1980 to 2000?
         d. What appears to be happening to the Ozone layer from around the year
         2000 onwards? Why do you think this might be?

The chemical formula for Ozone is O3
2. Research ozone and find out the shape of the molecule.
3. Draw a picture of an ozone molecule.
4. Make a model of an ozone molecule (hint: if you use marshmallows and
toothpicks, you can eat the ozone when you are finished!)
You can also read