Koi (Cyprinus rubrofuscus) Seek Out Tactile Interaction with Humans: General Patterns and Individual Differences - MDPI
←
→
Page content transcription
If your browser does not render page correctly, please read the page content below
animals
Article
Koi (Cyprinus rubrofuscus) Seek Out Tactile Interaction with
Humans: General Patterns and Individual Differences
Isabel Fife-Cook and Becca Franks *

                                          Department of Environmental Studies, New York University, New York, NY 10003, USA; ifc219@nyu.edu
                                          * Correspondence: krf205@nyu.edu

                                          Simple Summary: To assess the possibility of forming stable and trusting relationships between
                                          humans and fishes, we documented the interactions between a familiar human experimenter and
                                          seven koi (Cyprinus rubrofuscus). Analyses of video data shows that overall, koi spent more time than
                                          expected in close proximity to the human and even sought out physical contact. Moreover, individual
                                          fish displayed unique interaction patterns, with some frequently engaging in tactile interaction
                                          and others only periodically or rarely doing so. By demonstrating that koi will voluntarily interact
                                          with humans and that individual differences play an important role in interaction style, this study
                                          provides the first evidence that individuated human–fish relationships may be possible, which has
                                          powerful implications for how we think about, treat, protect, and provide care for fish.

                                          Abstract: The study of human–animal interactions has provided insights into the welfare of many
                                          species. To date, however, research has largely focused on human relationships with captive mam-
                                          mals, with relatively little exploration of interactions between humans and other vertebrates, despite
                                          non-mammals constituting the vast majority of animals currently living under human management.
                                With this study, we aimed to address this gap in knowledge by investigating human–fish interactions

                                          at a community garden/aquaponics learning-center that is home to approximately 150 goldfish
Citation: Fife-Cook, I.; Franks, B. Koi
                                          (Carassius auratus) and seven adult and two juvenile koi (Cyprinus rubrofuscus). After a habituation
(Cyprinus rubrofuscus) Seek Out
                                          period (July–September 2019) during which time the fish were regularly provided with the oppor-
Tactile Interaction with Humans:
                                          tunity to engage with the researcher’s submerged hand, but were not forced to interact with the
General Patterns and Individual
Differences. Animals 2021, 11, 706.
                                          researcher, we collected video data on 10 non-consecutive study days during the month of October.
https://doi.org/10.3390/ani11030706       This procedure produced 18~20-min interaction sessions, 10 during T1 (when the experimenter first
                                          arrived and the fish had not been fed) and eight during T2 (20–30 min after the fish had been fed to
Academic Editor: Leslie Irvine            satiation; two sessions of which were lost due equipment malfunction). Interactions between the
                                          researcher and the seven adult koi were coded from video based on location (within reach, on the
Received: 31 January 2021                 periphery, or out of reach from the researcher) and instances of physical, tactile interaction. Analyses
Accepted: 26 February 2021                revealed that overall, koi spent more time than expected within reach of the researcher during both
Published: 5 March 2021                   T1 (p < 0.02) and T2 (p < 0.03). There were also substantial differences between individuals’ overall
                                          propensity for being within-reach and engaging in physical interaction. These results show that koi
Publisher’s Note: MDPI stays neutral      will voluntarily interact with humans and that individual koi display unique and consistent patterns
with regard to jurisdictional claims in
                                          of interaction. By providing quantitative data to support anecdotal claims that such relationships
published maps and institutional affil-
                                          exist around the world, this research contributes to the ongoing discoveries highlighting the pro-
iations.
                                          found dissonance between how humans think about and treat fish and who fish actually are, thereby
                                          emphasizing the necessity of stronger moral and legal protections for fishes.

                                          Keywords: human–animal interaction; human–animal relationship; Cyprinus rubrofuscus; koi; carp;
Copyright: © 2021 by the authors.
                                          aquatic veterinary science; ornamental fish; captive animal welfare; fish welfare; animal protection;
Licensee MDPI, Basel, Switzerland.
                                          empathy; positive welfare; environmental enrichment; personality; cognition
This article is an open access article
distributed under the terms and
conditions of the Creative Commons
Attribution (CC BY) license (https://
creativecommons.org/licenses/by/
4.0/).

Animals 2021, 11, 706. https://doi.org/10.3390/ani11030706                                               https://www.mdpi.com/journal/animals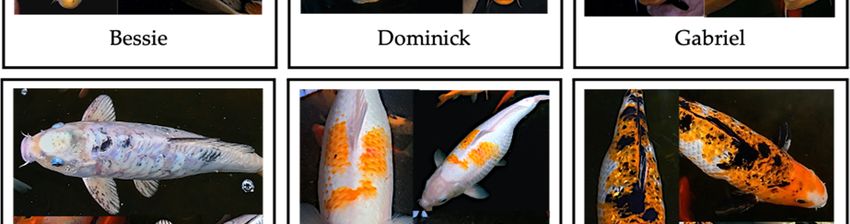
Animals 2021, 11, 706                                                                                             2 of 19

                        1. Introduction
                              Human–animal interaction (HAI) is an umbrella term used to describe any form of
                        interaction, relationship or bond between a human and nonhuman [1]. HAI research is
                        inherently multidisciplinary, consisting of a diverse body of literature from many academic
                        fields including anthropology, biology, psychology, sociology, ecology, ethology and vet-
                        erinary medicine with applications across a wide range of contexts [2]. Historically, HAI
                        research has focused primarily on the relationship between companion animal ownership
                        and human health, the therapeutic effects of structured human–animal interactions (e.g.,
                        Animal Assisted Interventions), and the consequences of poor stockmanship on farmed an-
                        imal production [1]. More recently, HAI literature has seen a marked increase in contextual
                        diversity, with a growing body of work focused on impacts of HAI on animal welfare [3]
                        as well as the conception of an interdisciplinary literature exploring the mutual benefits of
                        human–animal bonds and relationships [3,4], a development consistent with the mounting
                        interest in positive animal welfare within the broader scope of animal welfare science [5–7].
                        Despite this progress, the species diversity of HAI research has remained relatively low,
                        maintaining a focus on mammals and some birds to the exclusion of the vast majority of
                        animals who do not fall under these classifications.
                              One such understudied taxonomic group is the Osteichthyes, a diverse class of aquatic
                        vertebrates colloquially known as “bony fishes” or simply “fish”. Osteichthyes are used by
                        humans for a wide variety of reasons (including food, recreation, ornamentation, scientific
                        research, and companionship) and on an enormous scale. According to the Food and Agri-
                        culture Organization (FAO), an estimated 0.98 and 2.85 trillion individuals are killed for
                        human consumption each year, making fish the most consumed taxa on the planet [8]. Ze-
                        brafish (Danio rerio) are popular model organisms increasingly used in studying vertebrate
                        development and gene function in laboratories around the world [9,10] and freshwater fish
                        are currently the most populous pet in the US, with an estimated 139.5 million individuals
                        currently living in homes across the country [11]. Though historically perceived as “lesser
                        vertebrates”, recent research has established that fish are not only sentient but capable of so-
                        phisticated emotional and cognitive processes [12,13], emphasizing the ethical significance
                        of researching, legislating and reinforcing welfare standards for fishes living in captivity.
                        Despite this necessity for fish welfare research, it was not until recently that scientists began
                        to investigate fish welfare systematically [14]. Even now, however, the existing fish research
                        remains largely focused on mitigating negative consequences of captivity with a paucity of
                        literature exploring psychological and social welfare of fishes [15].
                              Amongst the many families of Osteichthyes used by humans, cyprinids (commonly
                        referred to as carps) are by far the most populous both in number and diversity of use [16].
                        Cyprinids are the largest family of vertebrates with over 1300 extant species [17], many of
                        which are farmed and fished for food (e.g., common carp (Cyprinus carpio)), used as model
                        organisms in biomedical research (e.g., zebrafish (Danio rerio)), and bred for ornamental
                        purposes (e.g., “fancy carp” such as goldfish (Carassius auratus) and koi (Cyprinus rubro-
                        fuscus; correctly referred to as Nishikigoi but henceforth referred to simply as “koi”)). Koi
                        originated in East Asia and, after thousands of years of selective breeding for striking
                        coloration patterns, have become a widely popular ornamental species [18,19]. Today, koi
                        are widely available in most countries and remain popular additions to water gardens and
                        home aquaria around the world. Yet, like other fish, no research to date has investigated
                        human–koi interactions.
                              Human–animal interactions can impact the welfare of captive animals in a multitude
                        of ways. Nonhuman animals can suffer as the result of negative human contact (e.g.,
                        inflicting pain [20–23], inducing fear and anxiety [24–27]) or poor management (e.g., failing
                        to provide adequate cognitive and emotional stimulation in captivity leading to boredom
                        and loneliness [28–30]). Nonhuman animals can also benefit from positive human contact
                        that provides pleasant sensory stimulation [31,32] and promotes improved cognitive func-
                        tion through positive reinforcement training [31,32]. Experiencing or expecting positive
                        HAI such as prosocial interactions can also lead humans to improve how they treat ani-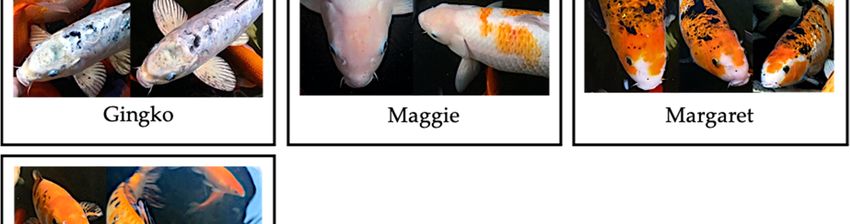
Animals 2021, 11, 706 3 of 19
mals directly under their care [33,34]. Moreover, emotional bonds between humans and
companion animals can have a profound positive effect on animal welfare, with humans
providing comfort in stressful situations and offering social companionship [2,35,36]. Fi-
nally, HAIs can also affect animal welfare indirectly by influencing human perceptions and
attitudes [37–43]. For example, affiliative HAIs such as engaging in playful behavior [44],
interacting physically [45] and observing pro-social behaviors between conspecifics in
naturalistic settings [46], can foster empathy in humans, which can then increase public
support for stricter welfare standards and conservation efforts [47].
The growing body of evidence emphasizing the diversity of ways in which HAIs impact
the welfare of nonhuman animals has led a number of influential ethologists to propose
integrating HAI into animal welfare evaluations and monitoring schemes [48–50], including
the recently updated five domains model of animal welfare [51]. These developments and
discoveries make the absence of knowledge about HAIs for many important and heavily
impacted species particularly concerning.
The present study aimed to approach this literature gap by examining the interactions
or lack thereof between a familiar human experimenter and seven koi residing in a mixed-
species pond at a community garden. The first step in determining what role HAIs may play
in fish welfare and protection is establishing whether voluntary human–fish interactions
are possible. We hypothesized that the possibility for positive human–fish interactions
would be evidenced by fish voluntarily approaching and interacting with the human
experimenter. Alternatively, if the fish were fearful of or indifferent to humans, we expected
to find evidence of avoidance or random swimming patterns. We were also interested in
determining whether individual differences (i.e., personalities) played a role in driving
human–fish interactions, in which case, we expected to find stable patterns of interaction
style across time. Alternatively, if human–fish interactions were mainly driven by external,
environmental cues (e.g., fear of humans or general attraction to novelty/disturbance), we
expected to find group-level patterns dominating their behavioral variability, with little to
no difference in individual koi behavior. To test these hypotheses, we filmed human–fish
interactions over the course of a month and coded the videos for (i) the fishes’ proximity to
the researcher’s submerged hand and (ii) instances of fish engaging in voluntary tactile
interaction with the researcher.
2. Materials and Methods
2.1. Location and Subjects
Data collection took place at Oko Farms, a small-scale community-managed aquapon-
ics learning center located in Brooklyn, NY. Oko Farms is the permanent home of ~150
goldfish (Carassius auratus) and 9 koi (Cyprinus rubrofuscus). The fish varied in size, age,
breed and background, with the goldfish primarily purchased from commercial pet stores
or surrendered by citizens in groups or individually and the koi purchased from various
retailers and private suppliers. The youngest fish living at Oko Farms were goldfish fry
who were born in the spring of 2019. The oldest fish were 5 adult koi who were purchased
between 5 months and 2 years of age and have lived on the farm since 2014. Thus the
7 koi in this study ranged from at least 2 years to at least 6 years of age. We focused on the
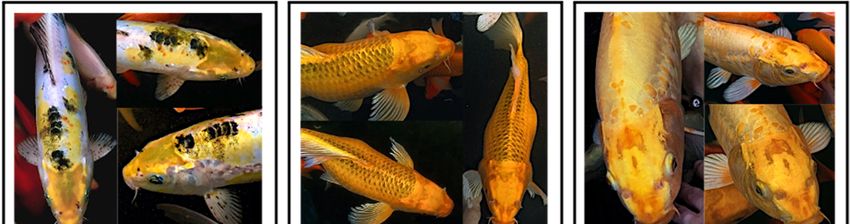
behavior of the 7 adult koi (see Figure 1 and Table 1) because they were the most readily
identifiable individuals in the tank and were present for the entire acclimation period
(the two juvenile koi were not included in the study as they arrived after the onset of the
acclimation period).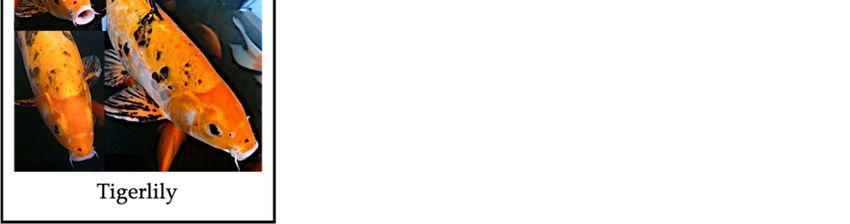
Animals 2021, 11, 706                                                                                                                               4 of 19
       Animals 2021, 11, x                                                                                                                4 of 19

                        Figure 1. Participants. From left to right: Bessie, Dominic, Gabriel, Gingko, Maggie, Margaret, Tigerlily.
                 Figure 1. Participants. From left to right: Bessie, Dominic, Gabriel, Gingko, Maggie, Margaret, Tigerlily.
                                                                 Table 1. Fish profiles.
                                                                 Table 1. Fish profiles.
             Name     Sex                Length                                      Distinguishing Features
  Name        Sex Length                           Primarily grey with lemon    Distinguishing      Features
                                                                                    yellow coloration     on the head and back above lateral
             Bessie    M               40–45 cm
                                                   line and  before  dorsal  fin. Partially  scaled.
                                      Primarily grey with lemon yellow coloration on the head and back above lateral line and before
  Bessie     M 40–45 cm                            Deep yellow-orange      butterfly koi with dark scale outlines. Mass on left side of
                                      dorsal fin. Partially scaled.
           Dominick   M                55–60 cm
                                                   abdomen, left eye is disfigured and nonfunctional. Fully scaled.
                                      Deep yellow-orange butterfly koi with dark scale outlines. Mass on left side of abdomen, left eye is
 Dominick M 55–60 cm                               Yellow-gold body tapering to a deeper shade of squash towards the face with
        Gabriel    M                  disfigured
                                       55–60 cm and nonfunctional. Fully scaled.
                                                   white tipped pectoral and dorsal fins. Partially scaled.
                                      Yellow-gold body tapering to a deeper shade of squash towards the face with white tipped pectoral
  Gabriel     M 55–60 cm                           White with orange markings on either side of the dorsal fin above the lateral line
             Maggie    F              and  dorsal
                                       50–55  cm fins. Partially scaled.
                                                   and anterior to the dorsal fin across the medial line. Fully scaled.
                                      White with orange    markings
                                                   Primarily   orangeon   either
                                                                        and  blackside  of the
                                                                                     above     dorsal
                                                                                            lateral    finand
                                                                                                    line    above thebelow.
                                                                                                               white  lateral Partial
                                                                                                                              line and  anterior to the
                                                                                                                                      piebald.
  MaggieMargaret
          F    50–55 cm
                      F                50–55fin
                                              cmacross the medial line. Fully scaled.
                                      dorsal
                                                   Mouth is disfigured but functional. Fully scaled.
                                      Primarily orange   and black
                                                   Primarily         above lateral
                                                               light grey-blue   with line andcrescent-shaped
                                                                                        dark    white below. Partial   piebald.
                                                                                                                  markings  alongMouth   is disfigured
                                                                                                                                    the medial
 MargaretGingko
           F    50–55 cm
                       M               45–50  cm
                                      but functional.  Fully scaled.
                                                   line and dark freckles across body and fins. Partially scaled.
                                                   Primarily
                                      Primarily light          orange
                                                       grey-blue   withabove   lateral line and white
                                                                        dark crescent-shaped      markings underbelly.
                                                                                                               along theBlack markings
                                                                                                                         medial          ondark
                                                                                                                                  line and
  Gingko Tigerlily
            M 45–50 cm
                     M                 50–55 cm
                                      freckles across body
                                                   body   andand  fins.
                                                               fins.    Partially
                                                                     Orange   head scaled.
                                                                                      and operculum with white mouth. Partially scaled.
                                      Primarily orange above lateral line and white underbelly. Black markings on body and fins. Orange
 Tigerlily     M     50–55 cm
                                      head and operculum with white mouth. Partially scaled.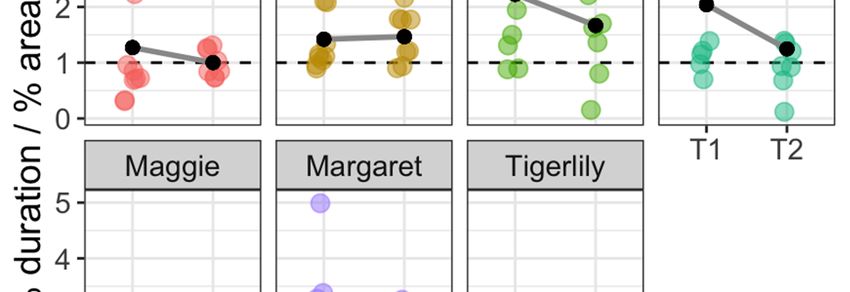
Animals 2021, 11, 706                                                                                            5 of 19

                        2.2. Animal Care
                        2.2.1. Housing
                             All fish are housed in a below-ground tank protected by a greenhouse connected to
                        outdoor grow beds. The total water volume of the flow-through aquaponics system is
                        roughly 15,000 gallons with approximately 4000 gallons in the holding tank, 2500 of which
                        are physically accessible to the fish who participated in this study. The holding tank is
                        roughly 7.5 ft wide, 12 ft long and ranges between 3 and 4 feet deep. The tank is lined with
                        pond-liner and barren apart from four aerators in each corner of the tank.

                        2.2.2. Feeding
                             Fish were fed between 9 and 16 oz of commercial carp feed 2–3× per day by either the
                        primary researcher or the farm operator. On study days, the fish were not fed for at least
                        two hours prior to the primary interaction period, after which they were fed the prescribed
                        amount according to the predetermined feedings schedule. Feed time and amount were
                        recorded and updated daily. Feed intake decreased over the course of the study as a result
                        of decreasing water temperatures due to seasonal changes.

                        2.2.3. Maintenance
                              Staff members observe the fish and test water quality at least once per day. The water
                        is tested using an API freshwater master test kit and the parameters (temperature, pH, total
                        ammonia, nitrite and nitrate) are recorded on a daily basis. Over the course of the study,
                        the parameters remained relatively stable aside from the temperature, which dropped in
                        conjunction with seasonal changes. Ammonia ranged between 0 and 0.5 ppm, nitrite at
                        0 ppm and nitrate between 0 and 10 ppm. Temperature ranged between 70 and 60 F over
                        the course of the study and pH ranged between 7 and 7.2.

                        2.3. Study Timeline
                        2.3.1. Habituation Period (July 2019–October 2019)
                              The habituation period involved socializing the fish to the presence of humans for
                        ~3 h per day, 5 days a week, resulting in a total of approximately 190 h of socialization over
                        the course of 3.5 months. When entering the fishes’ environment, one of three researchers
                        sat beside the tank with one or both hands submerged in the water up to the elbows. The
                        tank is large enough that by sitting at the side of the tank, the fish could remain well
                        away from our submerged hands while still allowing curious animals the opportunity to
                        approach. Researchers strove to limit sudden movements or loud noises that may frighten
                        the fish and kept their faces within sight of the fish whenever possible. It should be stressed
                        that, during this period, researchers did not instigate physical contact with any of fish but
                        rather allowed the fish to choose whether or not they were interested in interacting. If fish
                        instigated physical interaction (e.g., touching, mouthing, etc.) the researchers returned
                        contact (e.g., gently stroking the fish’s forehead, wiggling fingers, etc.).
                              Though at the onset of the study, all fishes were accustomed to the presence of humans
                        outside their tank, the fishes were unaccustomed to the presence of a human hand in their
                        environment for extended periods of time. Furthermore, the main experience the fishes
                        had with a human entering their environment was of being netted, a process known to be
                        aversive to fish [52–55]. In order to counteract the learned fear response to humans in their
                        environment, we fed the fish by hand throughout the month of July and into early August,
                        at which point the fish readily approached us on sight with no sign of aversion. At this
                        point we ceased hand feeding but continued to interact normally while providing the fish
                        access to our submerged hands throughout the remainder of the acclimation period.

                        2.3.2. Study Period (4 Weeks between October and November 2019)
                            The data collection portion of the study was carried out on 9 days over the course of
                        4 weeks from 8 October to 5 November. Each observation period involved an approximately
                        twenty-minute session during which the researcher (the same individual for the entire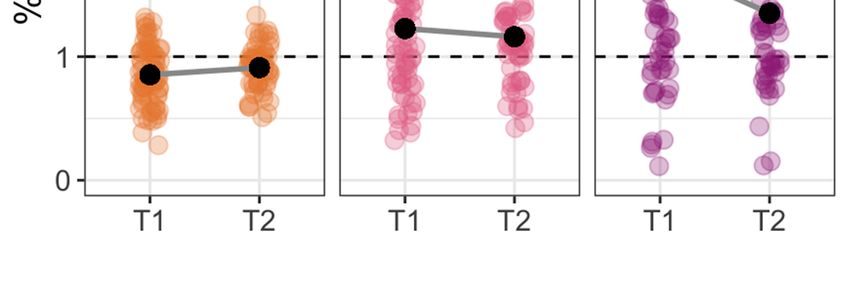
2.3.2. Study Period (4 Weeks between October and November 2019)
The data collection portion of the study was carried out on 9 days over the course of
Animals 2021, 11, 706 6 of 19
4 weeks from 8 October to 5 November. Each observation period involved an approxi-
mately twenty-minute session during which the researcher (the same individual for the
entire data collection portion) knelt next to the tank, submerged her hand in water and
data collection
remained portion)
attentive knelt
to the fish.next to thewere
Sessions tank, filmed
submerged
usingher
anhand
iPhone in water andon
mounted remained
a light
attentive
pole to thenext
propped fish.toSessions
the lip ofwere
thefilmed
tank. using an iPhone mounted on a light pole propped
next to the lip of the tank.
2.4. Data Collection and Analysis
2.4. Data Collection and Analysis
Video Data
Video Data
Videos were filmed on an iPhone XR with a 12 MP wide-angle camera (A1984, Apple)
Videos were filmed on an iPhone XR with a 12 MP wide-angle camera (A1984, Apple)
attached to a phone mount adapter (Cell Phone Tripod Mount Adapter, PHONE-CLAMP,
attached to a phone mount adapter (Cell Phone Tripod Mount Adapter, PHONE-CLAMP,
Fotodiox Inc., New York, NY, USA) screwed into an adjustable light stand (Heavy-Duty
Fotodiox Inc., New York, NY, USA) screwed into an adjustable light stand (Heavy-Duty
Light Stand Black 13′,0 LS-13HBI, Impact) positioned above the holding tank. At the end of
Light Stand Black 13 , LS-13HBI, Impact) positioned above the holding tank. At the end
each study session, videos were uploaded onto the researcher’s personal computer (Mac-
of each study session, videos were uploaded onto the researcher’s personal computer
Book Pro Retina, 13”, Early 2015, A1502, Apple), backed up on an external hard drive (WD
(MacBook Pro Retina, 13”, Early 2015, A1502, Apple), backed up on an external hard drive
1TB Black My Passport for Mac Portable External Hard Drive, WDBJBS0010BSL-NESN,
(WD 1TB Black My Passport for Mac Portable External Hard Drive, WDBJBS0010BSL-
Western Digital, Kingston, NY, USA) and uploaded to a private YouTube account.
NESN, Western Digital, Kingston, NY, USA) and uploaded to a private YouTube account.
Behavioral
Behavioral analyses
analyses were
were performed
performed by by uploading
uploading videos
videos into
into BORIS
BORIS (Behavioral
(Behavioral
Observation
Observation Research Interactive Software, version 7.10.2) [56] which was used
Research Interactive Software, version 7.10.2) [56] which was used to
to extract
extract
data using the coding scheme outlined in the following section. Cumulative
data using the coding scheme outlined in the following section. Cumulative duration duration cal-
culations were performed in BORIS and the resulting data downloaded as
calculations were performed in BORIS and the resulting data downloaded as a spreadsheet. a spreadsheet.
SketchUp
SketchUp3d 3d (version
(version 20.0.362)
20.0.362) modeling
modelingsoftware
softwarewaswasused
used toto calculate
calculate the
the area
area of
of the
the
tank and standardize the location
tank and standardize the location data. data.
2.5.
2.5. Coding
CodingScheme
Scheme
Videos codedaccording
Videos were coded accordingtotothe
the animals’
animals’ relative
relative proximity
proximity to researcher
to the the researcher
(des-
(designated
ignated by theby researcher’s
the researcher’s estimated
estimated reach)reach) and physical
and physical interactions
interactions with the with the re-
researcher:
searcher: within
within reach, reach, periphery,
periphery, and outerand
areaouter area (see
(see Figure Figure2).2, Table 2).
2, Table
Figure2.2.Visual
Figure Visualrepresentation
representation of
of location
location codes
codes used
used to
to standardize
standardize variable
variablezone
zonesize
size(see
(seeTable
Table2).
2).Graphics
Graphicsbyby
Isabel
Isabel
Fife-Cook.
Fife-Cook.
Table 2. Behavioral categories and definitions. Location codes calculated using SketchUp 3D modeling software and used
to standardize variable zone size.
Location Definition Mean Area % Total Area
Area of the tank designated by the arc created by the researcher using her
Within Reach submerged arms full range of motion in all directions without 0.4 m2 8%
leaning forward.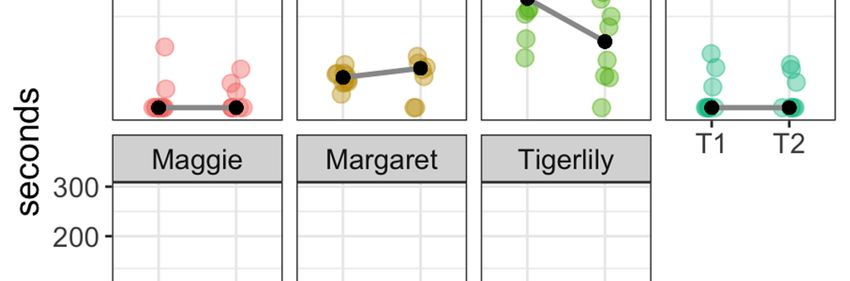
Animals 2021, 11, 706                                                                                                         7 of 19

                                                                 Table 2. Cont.

     Location                                            Definition                                     Mean Area   % Total Area
                        Periphery began at the boundary of within reach and extending
                        approximately one arm’s length beyond the within reach area in all
    Periphery                                                                                            1.15 m2        22%
                        directions. In this location, the researcher’s hand was likely still within
                        sight of the fish while also remaining out of immediate reach.
                        Included all areas of the tank outside of the previously defined locations
    Outer Area                                                                                           3.1 m2         70%
                        (including areas that are out of sight in video data, see Figure 2).
                        Any form of tactile interaction between human hand and fish, initiated by
                        the fish (mouthing, brushing, bumping, etc.) A series of tactile interactions
                        were designated as a single period of interaction as long as the fish
     Physical
                        instigated physical interaction at least once over the course of 3 s and did      N/A          N/A
    Interaction
                        not move away from the researcher. If interactions occurred more than 3 s
                        apart and/or the fish moved away from the researcher between
                        interactions, they were coded as individual periods.

                                     2.6. Statistical Analyses
                                           To assess overall patterns of behavior, we used multilevel modeling (also known as
                                     hierarchical models or mixed-effects models, which are a more flexible version of repeated
                                     measures ANOVA), to control for random effects of study day and repeated sampling of
                                     the same individual fish over time. This statistical approach is useful for accommodating
                                     unequal sample sizes while also correcting for pseudoreplication [57,58]. For hypothesis
                                     testing within the multilevel models, we used t-tests and Satterthwaite corrected degrees
                                     of freedom.
                                           To determine whether fish spent more time than expected in each area (within-reach,
                                     periphery, vs. outer-area) we calculated an “area-adjusted duration” for each fish within
                                     each area for each observation. Area-adjusted duration is the percent of time a fish spent
                                     in a location during an observation period divided by that location’s percent of total
                                     area (% duration/% area). If a fish moved randomly through the tank, their duration
                                     percentages would be equal to the area percentages, leading to an area-adjusted duration
                                     of 1. If a fish spent more time in a certain location than would be expected from a random-
                                     movement model, the area-adjusted duration would be greater than 1 (and it would be less
                                     than 1 if they spent less time than expected in a certain location).
                                           To test for overall patterns in location preference, we compared the area-adjusted
                                     durations for within-reach, periphery, vs. outer-area by using area-adjusted duration as the
                                     outcome variable and location as input variable (also known as the independent variable).
                                     We controlled for observation time period (T1 vs. T2) as a fixed-effect and study day and
                                     fish ID as random effects.
                                           All calculations, analyses, and visualizations were performed in R statistical soft-
                                     ware [59,60]. For data cleaning and visualization, we used the tidyverse package [61]. For
                                     statistical modeling we used the lme4 and lmerTest packages [62,63].

                                     3. Results
                                          Overall, the fish spent significantly more time than expected within-reach than
                                     they did in the periphery: area-adjusted duration was 0.37 (standard error [SE] = 0.07)
                                     higher for within-reach than periphery (t(310.28) = 5.06, p < 0.0001). They spent
                                     significantly more time than expected in the periphery than they did in the outer-
                                     area: area-adjusted duration was 0.32 (SE = 0.07) higher in periphery than outer-area
                                     (t(310.28) = 4.32, p < 0.0001). Logically, therefore, within-reach was also higher than
                                     outer-area (t(310.28) = 9.38, p < 0.0001; Figure 3). Examining the within-reach patterns
                                     in more detail, we found that while fish spent more time within reach during T1
                                     than T2 (t(316.90) = 2.52, p < 0.02), for both time periods, overall duration in the
                                     within-reach location was significantly higher than what would be expected from a
                                     random-movement model: T1 area-adjusted duration for the within-reach location was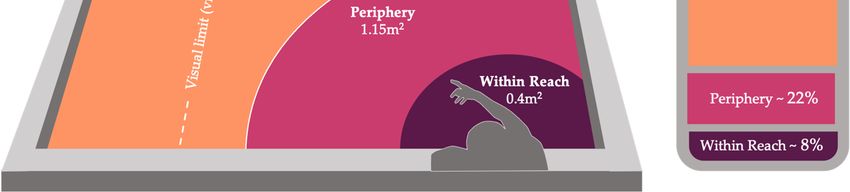
Animals 2021, 11, x 8 of 19
Logically, therefore, within-reach was also higher than outer-area (t(310.28) = 9.38, p <
Animals 2021, 11, 706 0.0001; Figure 3). Examining the within-reach patterns in more detail, we found that while 8 of 19
fish spent more time within reach during T1 than T2 (t(316.90) = 2.52, p < 0.02), for both
time periods, overall duration in the within-reach location was significantly higher than
what would be expected from a random-movement model: T1 area-adjusted duration for
1.75 (SE = 0.20; t(6)
the within-reach location p < 0.02)
= 3.69,was and=T2
1.75 (SE area-adjusted
0.20; t(6) = 3.69, pduration for the
< 0.02) and within-reach
T2 area-adjusted
location was 1.35 (SE: 0.11; t(6) = 3.11, p < 0.03; Figure 3).
duration for the within-reach location was 1.35 (SE: 0.11; t(6) = 3.11, p < 0.03; Figure 3).
Figure 3. Plot showing area adjusted duration in each of the three locations: Outer Area, Periphery
and Within Reach. During both T1 and T2, fish spent more time than expected within reach (p < 0.03).
Figure 3. Plot showing area adjusted duration in each of the three locations: Outer Area, Periphery
Each point represents
and Within Reach. Duringthe both
area-adjusted
T1 and T2,duration formore
fish spent one time
fish over the course
than expected of a single
within video.
reach (p <
T1 = study
0.03). sessions
Each point immediately
represents following arrival
the area-adjusted andfor
duration T2one= study sessions
fish over taken 20–30
the course min after
of a single
feeding.
video. T1The dotted
= study line atimmediately
sessions 1 indicates baseline
following (expected)
arrival andduration if movement
T2 = study is random.
sessions taken Plot
20–30 min
points higher than
after feeding. The 1dotted
indicate
linethat
at 1the fish spent
indicates more time
baseline than expected
(expected) duration in ifthe corresponding
movement location
is random.
Plot points
during higherof
the course than
the 1study
indicate thatwhile
session the fish spent
plot more
points time1 than
below expected
indicate that the in fish
the corresponding
spent less time
location during the course
than expected in the location. of the study session while plot points below 1 indicate that the fish
spent less time than expected in the location.
Fish showed strong individual differences within these patterns, however. Margaret
spentFish
the showed
most amountstrongof individual differences2.38
time within-reach: within
(SE these
= 0.40)patterns, however.
times more Margaret
than expected
spent the
during T1 most
(t(9) =amount
3.49, p (t(9)
= 0.48, T1 0.6, =Figure
0.24, p4).> 0.8) and 0.95 (SE = 0.10) times less than expected in T2
(t(7) = 0.48, p > 0.6, Figure 4).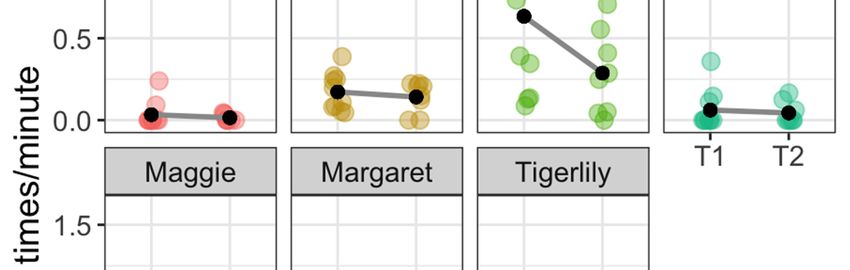
9 of 19
Animals 2021, 11, 706                                                                                                                      9 of 19

      Figure 4. Plot showing area adjusted duration for the within-reach location by fish. Each colored point represents the area
      adjusted duration for each fish over the course of a single session. Black dots represent the mean area-adjusted duration
      forFigure
          that fish4.during
                      Plot showing      area
                             that session     adjusted
                                          type:  T1 = studyduration
                                                              sessions for  the within-reach
                                                                        immediately                location
                                                                                        following arrival  andbyT2fish.  Each
                                                                                                                    = study     colored
                                                                                                                             sessions  taken
         point
      20–30  minrepresents      theThe
                   after feeding.   area   adjusted
                                       dotted  line at 1duration
                                                         indicates for  each(expected)
                                                                   baseline    fish overduration
                                                                                             the course   of a single
                                                                                                     if movement         session.
                                                                                                                    is random.     Black
                                                                                                                                 Plot points
         dotsthan
      higher   represent     the
                    1 indicate    mean
                               that       area-adjusted
                                    the fish spent more time duration     for that
                                                                than expected       fish
                                                                                in the     during thatlocation
                                                                                         corresponding   sessionduring
                                                                                                                    type:theT1course
                                                                                                                                = study
                                                                                                                                      of the
      study  session  while  plot points below   1 indicate that the fish spent  less time  than expected
         sessions immediately following arrival and T2 = study sessions taken 20–30 min after feeding. The in the location.
         dotted line at 1 indicates baseline (expected) duration if movement is random. Plot points higher
                                     Fish also showed strong individual differences in their tendency to seek out physical,
         than 1 indicate that the fish spent more time than expected in the corresponding location during
                               tactile interaction with the human experimenter. Gabriel’s rate of physical interaction was
         the course of the study  session
                               highest,     whilephysical
                                         seeking   plot points below
                                                           contact    1 indicate
                                                                   on average 0.63that
                                                                                    (SEthe  fishtimes
                                                                                        = 0.16)  spentper
                                                                                                       lessminute
                                                                                                            time than
                                                                                                                  during T1
         expected in the location.
                               and 0.29 (SE = 0.09) times per minute during T2, whereas other fish rarely engaged in this
                                    behavior (see Figure 5 and Table 3 for a breakdown of physical interaction rates by fish).
               Fish also showed strong individual differences in their tendency to seek out physical,
         tactile interaction with the human experimenter. Gabriel’s rate of physical interaction was
         highest, seeking physical contact on average 0.63 (SE = 0.16) times per minute during T1
         and 0.29 (SE = 0.09) times per minute during T2, whereas other fish rarely engaged in this
         behavior (see Figure 5 and Table 3 for a breakdown of physical interaction rates by fish).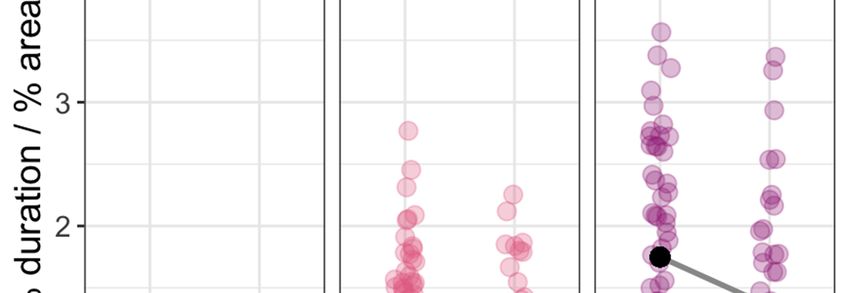
Animals 2021, 11, 706
x 10 of 19
Figure 5.
Figure Plot showing
5. Plot showingthe therate
rateofofphysical
physicalinteraction
interactionfor
foreach
eachfish.
fish.Each
Eachcolored
coloredpoint
pointrepresents
represents
the rate
the rate of
of Physical
Physical Interaction
Interaction for
for each
each fish
fish during
during aa single
singlestudy
studysession.
session.Black
Blackdots
dotsrepresent
representthe
the
mean physical interaction
mean interaction rate
rate for
for that
thatfish
fishduring
duringthat
thatsession
sessiontype:
type:T1T1==study
studysessions
sessionsimmediately
immedi-
ately following
following arrival
arrival and T2and T2 = study
= study sessions
sessions takentaken
20–3020–30 min feeding.
min after after feeding.
Table 3. Rate
Table 3. Rate of
of physical
physical interaction
interaction for
for each
eachfish:
fish:overall
overallmean
meanrate,
rate,and
andby
bysession-type
session-type(T1
(T1vs.
vs.T2).
T2).
Rate of Physical Interaction per Minute
Rate of Physical Interaction per Minute
Overall Rate Rate by Session Type
Fish Overall Rate Rate by(Mean
Session Type
Fish (Mean Times/Min) Times/Min)
(Mean Times/Min) (Mean Times/Min)
T1 0.03
T1 0.03
Bessie 0.02 T2 0.01
Bessie 0.02 T2 0.01
Diff Diff −0.02 −0.02
T1 T1 0.17 0.17
Dominick
Dominick 0.16 0.16 T2 T2 0.14 0.14
Diff Diff −0.03 −0.03
T1 T1 0.63 0.63
Gabriel
Gabriel 0.48 0.48 T2 T2
0.29 0.29
Diff −0.35
Diff −0.35
T1 0.06
T1 0.06
Gingko 0.05 T2 0.04
Gingko 0.05 T2 0.04
Diff −0.02
T1 Diff 0.24 −0.02
Maggie 0.18
T2 0.10Animals 2021, 11, 706 11 of 19
Table 3. Cont.
Rate of Physical Interaction per Minute
Overall Rate Rate by Session Type
Fish
(Mean Times/Min) (Mean Times/Min)
T1 0.24
Maggie 0.18 T2 0.10
Diff −0.14
T1 0.19
Margaret 0.14 T2 0.19
Diff −0.1
T1 0.06
Tigerlily 0.05 T2 0.03
Diff −0.02
The cumulative time fish spent in tactile contact with the experimenter also varied
strongly by individual. Gabriel spent a median of 49.1 (range: 10.2, 281) seconds in physical
contact with the human during T1 and a median of 18 (range: 0, 54.7) seconds during
T2. While all study fish initiated in at least some physical interaction, several had median
physical interaction durations of 0 (See Figure 6 and Table 4 for a breakdown of total
physical interaction durations by fish).
Table 4. Cumulative duration of physical interaction per session for each fish: overall median, and
by session-type (T1 vs. T2).
Cumulative Physical Interaction Within a Single Session (20 Min)
Duration Overall Duration by Session Type
Fish
(Median and Range in Seconds) (Median and Range in Seconds)
T1 0 (0, 15.2)
Bessie 0 (0, 15.2)
T2 0 (0, 6.14)
T1 3.75 (0.75, 7.62)
Dominick 4.4 (0, 75.9)
T2 6.39 (0, 75.9)
T1 49.1 (10.2, 281)
Gabriel 37.3 (0, 281)
T2 18 (0, 54.7)
T1 0 (0, 12)
Gingko 0 (0, 12)
T2 0 (0, 7.68)
T1 22.8 (7.75, 84.7)
Maggie 11.0 (0.34, 84.7)
T2 6.39 (0.34, 16.5)
T1 9.66 (1.27, 26.1)
Margaret 5.96 (0, 26.1)
T2 3.65 (0, 11.7)
T1 0 (0, 35.4)
Tigerlily 0 (0, 35.4)
T2 0.72 (0, 7.68)The cumulative time fish spent in tactile contact with the experimenter also varied
strongly by individual. Gabriel spent a median of 49.1 (range: 10.2, 281) seconds in phys-
ical contact with the human during T1 and a median of 18 (range: 0, 54.7) seconds during
T2. While all study fish initiated in at least some physical interaction, several had median
Animals 2021, 11, 706 12 of 19
physical interaction durations of 0 (See Figure 6 and Table 4 for a breakdown of total
physical interaction durations by fish).
Figure 6. Plot showing cumulative duration of physical interaction for each fish. Each colored point represents the
cumulative duration of physical interaction for the corresponding fish over the course of a single session. Black dots
Figure 6. Plot showing cumulative duration of physical interaction for each fish. Each colored
represent the median cumulative duration for that fish during that session type: T1 = study sessions immediately following
point represents the cumulative duration of physical interaction for the corresponding fish over
arrival and T2 = study sessions taken 20–30 min after feeding. Y-axis is on a square-root scale to accommodate the
the course of a single session. Black dots represent the median cumulative duration for that fish
skewed distribution.
during that session type: T1 = study sessions immediately following arrival and T2 = study ses-
sions taken 20–30 min after feeding. Y-axis is on a square-root scale to accommodate the skewed
distribution. 4. Discussion
The results of this study demonstrate that captive carp can and do seek out physical
contact with a familiar human and that they show individual differences in interaction
patterns. Though there is a wealth of data on the benefits of positive human–animal
relations, no previous work has explored their potential in a species of fish. The results
presented here thus provide a foundation for future work investigating the characteristics
and consequences of positive human–fish relations. The following sections present a
number of hypotheses regarding the findings of this study and discuss various promising
avenues for future research on human–fish interactions.
4.1. Reducing Stress through Socialization
Fear of humans can pose a significant threat to welfare for animals housed in perpetual
proximity to humans [26]. Fear of humans can be quickly learned and retained for long
periods of time [64]; for example, dairy calves who had been treated aversively quickly
learned to recognize and avoid the perpetrator, eventually generalizing the fear to all
handlers after repeated negative experiences [65]. Limiting human-induced fear and
anxiety is paramount to captive animal welfare as it can easily lead to chronic stress when
animals are unable to rectify or escape from the aversive stimuli [25]. Chronic stress, inAnimals 2021, 11, 706 13 of 19
turn, has been linked to poor health and behavioral abnormalities in a variety of captive
animals [66,67], including fishes [68–71].
Establishing positive associations with human contact has been shown to decrease
stress in a number of captive species across a variety of contexts [65,72,73], allowing for
easier handling and safer veterinary procedures [74] for both human and nonhuman
participants. The present results show that fish have the potential to form non-fear-based
relationships with humans, which has implications for their welfare. First, the presence of
such relationships may reduce overall stress compared to animals living with a fear-based
relationship with humans. Second, trusting relationships with humans may mitigate the
negative effects of stress associated with necessary handling and relocating animals, a
recognized welfare concern for captive fishes [25,52–54,75–77]. Future work is required to
explore these possibilities.
4.2. Human–Fish Interactions: A Potential Form of Enrichment for Captive Fishes?
The koi showed interest in pursuing physical interaction even after feeding to satiation,
suggesting that they may be motivated to seek physical interaction for reasons unrelated to
food seeking behavior.
4.2.1. Pleasant Sensory Experience
One potential explanation for the fishes’ interest in physical contact is that interact-
ing with a novel substance and texture (human skin) serves as a source of tactile and/or
sensory enrichment. Sensory stimulation is an important aspect of welfare for many an-
imals, including humans, for whom massage therapy reduces stress [78] by stimulating
the release of endorphins (opiates produced by the brain that trigger feelings of relaxation)
such as oxytocin and vasopressin [79]. Pleasant tactile interaction plays an important role
in developing positive human–animal relationships and can influence animal welfare in a
number of ways. For instance, exposure to pleasant human contact from a young age is a
reliable method of decreasing fear and stress in many farmed animal species, including
cows [80–82], sheep [83,84], chickens [85] and pigs [86–88]. Under certain circumstances,
pleasant tactile stimulation can also serve as a source of sensory enrichment for captive
animals [89], as supported by research on the effects of pleasant physical manipulation
on horses [90] and dogs [91]. In both cases, the animals’ heart rates dropped when be-
ing groomed by humans, mirroring the physiological response elicited by engaging in
allogrooming with conspecifics thus suggesting that tactile stimulation by humans may
also be perceived as rewarding.
Experiencing pleasure as the result of physical interaction with a receptive conspecific
partner is believed to be a fundamental and highly conserved element of both human and
nonhuman welfare. While touch in fishes has not yet been explored from an explicitly
welfare angle, there is biological and behavioral evidence to suggest that teleost fishes pos-
sess the physiological prerequisites necessary for experiencing pleasurable sensation [92].
Further research on sensory stimulation in fish may prove fruitful when designing enrich-
ment strategies [89], a hypothesis supported by research on sensory seeking behavior in
fish (e.g., [92–94]. For instance, Soares et al. [93] conducted a study on the effects of tactile
stimulation on the surgeonfish (Ctenochaetus striatus), a tropical reef species that regularly
visits cleaner wrasses (Labroides dimidiatus) to have ectoparasites removed. Previous studies
showed that cleanerfish are able to influence client fish decisions by physically touching
the surgeonfish with its pectoral and pelvic fins [94]. Soares et al. simulated this behavior
by exposing surgeonfish to mechanically moving cleanerfish models, which resulted in
significantly lower levels of cortisol in fish stimulated by moving models compared to
those exposed only to stationary models. These results show that physical contact alone is
enough to produce fitness-enhancing benefits. Furthermore, because the fish visited the
model by their own volition, it can be reasonably assumed that the tactile stimulation of
the cleanerfish model elicited a pleasurable reaction. This hypothesis is further supported
by evidence that cleanerfish routinely use tactile “massage” as a consolation or reward forAnimals 2021, 11, 706 14 of 19
disgruntled clients in the wild, indicating that the client fish finds this sensation inherently
pleasurable [94]. These studies not only support the notion that some fishes enjoy tactile
stimulation but also suggest that interspecies interactions—perhaps including such as
those between humans and fishes—may be rewarding as well.
4.2.2. Cognitive and Social Enrichment
A complimentary hypothesis as to why the fish spent more time than expected within
reach during both T1 and T2 is that their interest in interaction may be motivated by
curiosity, suggesting that fish-directed human interaction may serve as a means of cognitive
enrichment by presenting an opportunity to explore and exercise agency. Research on the
effects of boredom on captive animal welfare suggest that boredom is likely experienced
by a wide range of captive species and is generally perceived as aversive, particularly by
those living in barren conditions and lacking the agency necessary to remedy the situation,
and thereby leading to frustration and anxiety [28,30]. Cognitive stimulation is an effective
tool in staving off boredom and thus is increasingly recognized as an essential component
of animal welfare in captivity [28,95–97]. Human interaction can provide captive animals,
particularly those living in relatively barren environments, with a degree of arousal that
their living conditions fail to fulfill [40,98–100]. This work suggests the possibility that
fish-directed human interaction could serve as a source of cognitive stimulation for some
species of captive fishes. Future work is needed to explore this possibility.
4.3. Koi Personality, Sociality and Future Directions in Carp Welfare Research
Analyses of location and behavior data (see Figures 3–6) reveal that domestic carp
display distinct individual patterns of interaction, including duration of location behavior
and individual propensity for tactile interaction with the researcher. Gabriel showed both
the highest average rate and longest cumulative duration of physical interaction during
both T1 and T2, followed by Maggie and Margaret. Bessie, Tigerlily and Gingko showed
the lowest average rates of physical interaction (see Table 4 and Figure 6).
These results provide preliminary insight into the personalities of the seven fish who
participated in the study, particularly in their interest in seeking interaction and willingness
to take the risk of interacting. Interest in interacting, as defined by the relative amount
of time spent within reach and interacting physically, ranged substantially between indi-
viduals. For example, the comparatively low rates of physical interaction and time spent
within reach of the two least interactive fishes (Bessie and Tigerlily) signify a general lack
of interest in interaction, but also did not show a substantial avoidance of the researcher.
On the other hand, Gingko, whose rate and duration of physical interaction was similar to
those of Bessie and Tigerlily, spent substantially more time within reach than the other two
least interactive fishes, a behavior profile indicating attentiveness and interest but less in-
terest in initiating physical interaction. Dominick showed stable interaction patterns across
the board, with very little variation between T1 and T2 and a relatively low propensity to
linger within reach of the researcher when not interacting.
Investigating these individual behavior profiles can benefit fish welfare in several ways.
First, provided that the patterns are found to be relatively stable over time, they can serve
as a baseline by which to evaluate individual welfare. Recognizing and tracking patterns of
individual behavior is a useful tool in measuring welfare in zoo housed animals [101–103],
with significant changes in individual and/or group behavioral dynamics considered to
pose a potential welfare threat. While this approach is appropriate for certain conditions
(such as poor water quality), it may not be sufficient in detecting subtle signs of early
disease, many of which are critical to identify early in order to prevent major losses [104].
These community level patterns and associated affective states have been studied in other
species of fish (e.g., [105,106].) but never in koi. The individual behavioral patterns
observed in the study suggest that researchers, farmers and hobbyists may also be able
to use individual personality traits and their associated behavior patterns to better refine
welfare parameters for koi.Animals 2021, 11, 706 15 of 19
4.4. Human–Fish Interactions and Animal Protection—Promoting Human Empathy and
Compassion through Positive Interspecies Exchanges
As discussed briefly in the introduction, it has been well-documented that interactions
with non-human animals, when perceived as positive by the human participant, can have
a positive effect on humans’ perception of the species in question [34]. Human perceptions
and emotions influence actions and decisions and as such, improving human attitudes
towards a species can lead to improvements in their care and strengthen support for their
protection [47,107]. Given the relatively uncharitable public opinion towards fish in general
and lack of awareness around fish cognition, sentience and emotion [108–110], research
establishing the potential for positive human–fish interactions is particularly needed to
counteract baseline expectations and improve perceptions of fishes’ worth and moral
status. Additional work exploring human–fish interactions thus has the potential to have
significant downstream consequences for the welfare of fishes including increasing public
support for fish protection and regulations.
5. Conclusions
In this study, we investigated whether or not koi would voluntarily choose to interact
with a familiar human and, if so, whether individual behavior patterns could be identified.
We found that koi not only engaged with the human both before and after feeding but also
that the fish remained within reaching distance of the human more often than expected
based on a random motion model during all sessions. These results suggest that koi are
not solely motivated to interact with a familiar human in anticipation of a food reward
and that the baseline interest in interaction may be motivated by a desire to interact for its
own sake. Additionally, we found substantial, individual patterns of interaction behavior
and proclivity for interaction between the seven koi participating in the study, suggesting
that voluntary HAI may be used to investigate animal personality in conjunction with
traditional personality assessment paradigms. Overall, this study provides important
preliminary evidence that human–fish interaction research will be a fruitful area of future
inquiry. More work is needed in examining human-mediated enrichment opportunities for
fish, determining the qualitative nature of the human–fish interactions, and exploring the
implications of carp sociality and personality for their welfare in captivity.
Author Contributions: Conceptualization, B.F.; methodology, B.F. & I.F.-C.; software, B.F. & I.F.-C.;
validation, B.F. & I.F.-C.; formal analysis, B.F. & I.F.-C.; investigation, I.F.-C.; resources, B.F. & I.F.-C.;
data curation, B.F. & I.F.-C.; writing—original draft preparation, I.F.-C.; writing—review and editing,
B.F. & I.F.-C.; visualization, I.F.-C.; supervision, B.F.; project administration, B.F. & I.F.-C.; funding
acquisition, B.F. All authors have read and agreed to the published version of the manuscript.
Funding: Becca Franks gratefully acknowledges Open Philanthropy for funding support.
Institutional Review Board Statement: Not applicable.
Data Availability Statement: The data presented in this study are openly available in FigShare at
https://doi.org/10.6084/m9.figshare.14099459.v1 (accessed on 23 February 2021).
Acknowledgments: We thank Yemi Amu and the wonderful volunteers at Oko Farms for allowing
us to work with the fish and teaching us about aquaponics, Evelyn for helping us collect preliminary
data and Bessie, Dominick, Gabriel, Gingko, Maggie, Margaret and Tigerlily for participating in
the study.
Conflicts of Interest: The authors declare no conflict of interest.
References
1. Hosey, G.; Melfi, V. Human-Animal Interactions, Relationships and Bonds: A Review and Analysis of the Literature. Int. J. Comp.
Psychol. 2014, 27, 117–142.
2. Echeverri, A.; Karp, D.S.; Naidoo, R.; Zhao, J.; Chan, K.M.A. Approaching human-animal relationships from multiple angles: A
synthetic perspective. Biol. Conserv. 2018, 224, 50–62. [CrossRef]Animals 2021, 11, 706 16 of 19
3. Tarazona, A.M.; Ceballos, M.C.; Broom, D.M. Human relationships with domestic and other animals: One health, one welfare,
one biology. Animals 2020, 10, 43. [CrossRef] [PubMed]
4. Griffin, J.A.; Hurley, K.; McCune, S. Human-Animal Interaction Research: Progress and Possibilities. Front. Psychol. 2019, 10,
2803. [CrossRef] [PubMed]
5. Mellor, D.J. Moving beyond the “Five freedoms” by updating the “five provisions” and introducing aligned “animal welfare
aims”. Animals 2016, 6, 59. [CrossRef]
6. Mellor, D.J. Welfare-aligned Sentience: Enhanced Capacities to Experience, Interact, Anticipate, Choose and Survive. Anim. Open
Access J. 2019, 9, 440. [CrossRef]
7. Mellor, D.J. Enhancing animal welfare by creating opportunities for positive affective engagement. N. Z. Vet. J. 2014, 1–18.
[CrossRef]
8. FAO. World Fisheries and Aquaculture; FAO: Rome, Italy, 2018; ISBN 9789251305621.
9. Lidster, K.; Readman, G.D.; Prescott, M.J.; Owen, S.F. International survey on the use and welfare of zebrafish Danio rerio in
research. J. Fish Biol. 2017, 90, 1891–1905. [CrossRef]
10. Reed, B.; Jennings, M. Guidance on the housing and care of Zebrafish Danio rerio. Res. Anim. Dep. Sci. Group RSPCA 2011, 1,
1–27.
11. AVMA U.S. Pet Ownership Statistics|American Veterinary Medical Association. Available online: https://www.avma.org/
resources-tools/reports-statistics/us-pet-ownership-statistics (accessed on 20 December 2020).
12. Brown, C. Fish intelligence, sentience and ethics. Anim. Cogn. 2015, 18, 1–17. [CrossRef]
13. Brown, C.; Laland, K.; Krause, J. Fish Cognition and Behavior; Brown, C., Laland, K., Krause, J., Eds.; Wiley-Blackwell: Oxford, UK,
2011; ISBN 9781444342536.
14. Saraiva, J.L.; Castanheira, M.F.; Arechavala-López, P.; Volstorf, J.; Heinzpeter Studer, B. Domestication and Welfare in Farmed
Fish. In Animal Domestication; IntechOpen: London, UK, 2019.
15. Fife-Cook, I.; Franks, B. Positive welfare for fishes: Rationale and areas for future study. Fishes 2019, 4, 31. [CrossRef]
16. Castanheira, M.F. FishEthoBase: Cyprinus Carpio; Fair Fish International Association: Denens, Switzerland, 2020.
17. Billard, R. The Carp-Biology and Culture, 1st ed.; Springer: London, UK, 1999; ISBN 9781852331184.
18. Balon, E.K. About the oldest domesticates among fishes. J. Fish Biol. 2004, 65, 1–27. [CrossRef]
19. Daniel, W.M.; Morningstar, C.R.; Procopio, J. Cyprinus rubrofuscus Lacepède, 1803: U.S. Geological Survey; Nonindigenous Aquatic
Species Database: Gainesville, FL, USA, 2000.
20. Miller, L.; Patronek, G. Understanding the Effects of Maltreatment on Animal Welfare. In Animal Maltreatment; Oxford University
Press: Oxford, UK, 2016; pp. 197–233.
21. Sah, P.; Méndez, J.D.; Bansal, S. A multi-species repository of social networks. Sci. Data 2019, 6, s41597–s42019. [CrossRef]
22. Zulkifli, I. Review of human-animal interactions and their impact on animal productivity and welfare. J. Anim. Sci. Biotechnol.
2013, 4, 25. [CrossRef] [PubMed]
23. Stafford, K.J.; Mellor, D.J. Dehorning and disbudding distress and its alleviation in calves. Vet. J. 2005, 169, 337–349. [CrossRef]
24. Hemsworth, P.H.; Coleman, G.J.; Barnett, J.L.; Jones, R.B. Behavioural responses to humans and the productivity of commercial
broiler chickens. Appl. Anim. Behav. Sci. 1994, 41, 101–114. [CrossRef]
25. Rushen, J.; Taylor, A.A.; de Passillé, A.M. Domestic animals’ fear of humans and its effect on their welfare. Appl. Anim. Behav. Sci.
1999, 65, 285–303. [CrossRef]
26. Mota-Rojas, D.; Broom, D.M.; Orihuela, A.; Velarde, A.; Napolitano, F.; Alonso-Spilsbury, M. Effects of human-animal relationship
on animal productivity and welfare. J. Anim. Behav. Biometeorol. 2020, 8, 196–205. [CrossRef]
27. Tallet, C.; Rakotomahandry, M.; Herlemont, S.; Prunier, A. Evidence of Pain, Stress, and Fear of Humans During Tail Docking and
the Next Four Weeks in Piglets (Sus scrofa domesticus). Front. Vet. Sci. 2019, 6, 462. [CrossRef] [PubMed]
28. Meagher, R. Is boredom an animal welfare concern? Anim. Welf. 2019, 28, 21–32. [CrossRef]
29. Cacioppo, J.T.; Cacioppo, S.; Cole, S.W.; Capitanio, J.P.; Goossens, L.; Boomsma, D.I. Loneliness Across Phylogeny and a Call for
Comparative Studies and Animal Models. Perspect. Psychol. Sci. 2015, 10, 202–212. [CrossRef]
30. Burn, C.C. Bestial boredom: A biological perspective on animal boredom and suggestions for its scientific investigation. Anim.
Behav. 2017, 130, 141–151. [CrossRef]
31. Gourkow, N.; Phillips, C.J.C. Effect of cognitive enrichment on behavior, mucosal immunity and upper respiratory disease of
shelter cats rated as frustrated on arrival. Prev. Vet. Med. 2016, 131, 103–110. [CrossRef]
32. Deldalle, S.; Gaunet, F. Effects of 2 training methods on stress-related behaviors of the dog (Canis familiaris) and on the dog-owner
relationship. J. Vet. Behav. Clin. Appl. Res. 2014, 9, 58–65. [CrossRef]
33. Borgi, M.; Cirulli, F. Pet face: Mechanisms underlying human-animal relationships. Front. Psychol. 2016. [CrossRef]
34. Špinka, M. Social dimension of emotions and its implication for animal welfare. Appl. Anim. Behav. Sci. 2012, 138, 170–181.
[CrossRef]
35. Serpell, J.A. The Human-Animal Bond. In The Oxford Handbook of Animal Studies; Oxford University Press: Oxford, UK, 2017;
pp. 80–97.
36. Fox, C.; Merali, Z.; Harrison, C. Therapeutic and protective effect of environmental enrichment against psychogenic and
neurogenic stress. Behav. Brain Res. 2006, 175, 1–8. [CrossRef]You can also read