KUBERNETES AUTO-SCALING: YOYO ATTACK VULNERABILITY AND MITIGATION
←
→
Page content transcription
If your browser does not render page correctly, please read the page content below
The Interdisciplinary Center, Herzlia
            Efi Arazi School of Computer Science
                    M.Sc. program - Research Track

       Kubernetes Auto-Scaling:
YoYo attack vulnerability and mitigation
                                         by
                             Ronen Ben David

       M.Sc. dissertation, submitted in partial fulfillment of the requirements
        for the M.Sc. degree, research track, School of Computer Science,
                        The Interdisciplinary Center, Herzliya

                                 June 2021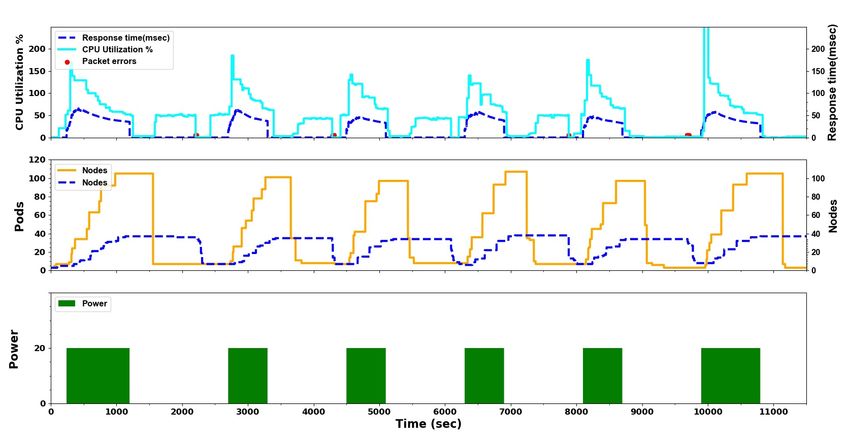
This work was carried out under the supervision of Prof. Anat Bremler-Barr from the Efi Arazi

School of Computer Science, The Interdisciplinary Center, Herzliya.

                                               2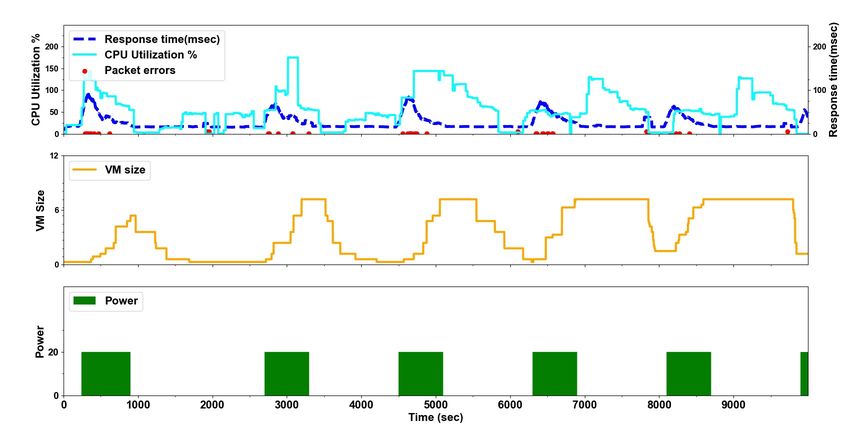
Abstract

   In recent years, we have witnessed a new kind of DDoS attack, the burst attack[6, 11],

where the attacker launches periodic bursts of traffic overload on online targets. Recent work

presents a new kind of Burst attack, the YoYo attack [4] that operates against the auto-scaling

mechanism of VMs in the cloud. The periodic bursts of traffic loads cause the auto-scaling

mechanism to oscillate between scale-up and scale-down phases. The auto-scaling mechanism

translates the flat DDoS attacks into Economic Denial of Sustainability attacks (EDoS), where

the victim suffers from economic damage accrued by paying for extra resources required to

process the traffic generated by the attacker. However, it was shown that YoYo attack also

causes significant performance degradation since it takes time to scale-up VMs.

In this research, we analyze the resilience of Kubernetes auto-scaling against YoYo attacks.

As containerized cloud applications using Kubernetes gain popularity and replace VM-based

architecture in recent years. We present experimental results on Google Cloud Platform,

showing that even though the scale-up time of containers is much lower than VM, Kubernetes

is still vulnerable to the YoYo attack since VMs are still involved. Finally, we evaluate ML

models that can accurately detect YoYo attack on a Kubernetes cluster.

                                              3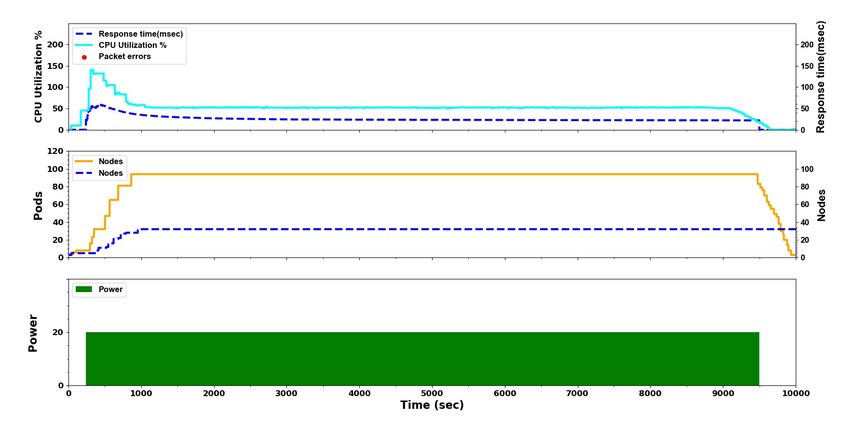
Contents

1 INTRODUCTION                                                                                        5

2 KUBERNETES                                                                                          8

  2.1   Kubernetes Background . . . . . . . . . . . . . . . . . . . . . . . . . . . . . . . . .       8

  2.2   Kubernetes Autoscaling . . . . . . . . . . . . . . . . . . . . . . . . . . . . . . . . .      9

        2.2.1   The Horizontal Pod Autoscaler (HPA) . . . . . . . . . . . . . . . . . . . . .        10

        2.2.2   The Cluster Autoscaler (CA) . . . . . . . . . . . . . . . . . . . . . . . . . .      11

  2.3   Kubernetes Pricing Models . . . . . . . . . . . . . . . . . . . . . . . . . . . . . . . .    12

3 YOYO ATTACK                                                                                        14

4 EXPERIMENT ANALYSIS                                                                                17

  4.1   GKE Parameter Settings . . . . . . . . . . . . . . . . . . . . . . . . . . . . . . . . .     18

  4.2   Experiment Results . . . . . . . . . . . . . . . . . . . . . . . . . . . . . . . . . . . .   19

        4.2.1   Comparing the YoYo attack to the Classic attack . . . . . . . . . . . . . . .        20

        4.2.2   YoYo attack: Kubernetes Vs. VM . . . . . . . . . . . . . . . . . . . . . . . .       22

5 YOYO ATTACK DETECTION                                                                              25

  5.1   Model Setup and Formulation . . . . . . . . . . . . . . . . . . . . . . . . . . . . . .      26

        5.1.1   XGBoost Classification Algorithm . . . . . . . . . . . . . . . . . . . . . . . .     26

                                                  4
5.1.2 Methodology & Data Engineering . . . . . . . . . . . . . . . . . . . . . . . . 27
5.1.3 XGBoost Optimization . . . . . . . . . . . . . . . . . . . . . . . . . . . . . . 28
5.2 Evaluation Results . . . . . . . . . . . . . . . . . . . . . . . . . . . . . . . . . . . . 30
5.2.1 XGBoost Classifier Evaluation . . . . . . . . . . . . . . . . . . . . . . . . . 30
6 RELATED WORK 31
7 CONCLUSIONS 32
1 INTRODUCTION
The burst attack is a new trend in DDoS attacks. In a burst attack, the victim is attacked with
recurring high-volume traffic bursts, lasting from a few seconds up to several minutes, while the
total duration of the attack can span hours and even days [11, 24]. In 2017, it was reported that
42% of organizations experienced such attacks [9]. Burst attacks have become feasible due to
recent improvements in botnet technologies that allow them to be perpetrated in a scheduled and
synchronized manner. A burst attack, when carried out correctly, is cost effective to the attacker,
who can divert the attack traffic between multiple end-point targets, leveraging a high degree of
resource control. Moreover, it confused conventional DDoS mitigation and detection solution [6].
Recent work presents a new kind of Burst attack [4], the YoYo attack, that operates against web
services implemented as native cloud applications using VMs. We note that cloud applications are
5resilient to many of the classic DDoS (i.e.,attackers operate a flat vector attacks) due to their high
bandwidth pipe, built-in anti-spoofing mitigation in the load-balancers, and the common use of a
content distribution network (CDN). Amazon lists the auto-scaling mechanism such as using AWS
layer DDoS mitigation as one of the best practices for dealing with Distributed Denial of Service
(DDoS) [3] attacks that target web applications. In flat DDoS attack the auto-scaling mechanism
translates a DDoS attack into an Economic Denial of Sustainability attack (EDoS), incurred by
paying the extra resources required to process the bogus traffic of the attack. However, there is no
performance damage, since the extra machines handle the extra traffic.
The YoYo attack [4] operates against the auto-scaling mechanism of VMs in the cloud. The
periodic bursts of traffic loads cause the auto-scaling mechanism to oscillate between scale-up and
scale-down phases. The YoYo attack causes significant performance degradation in addition to
economic damage. During the repetitive scale-up process, which usually takes up to a few minutes,
the cloud service suffers from a substantial performance penalty. When the scale-up process finishes,
the attacker stops sending traffic and waits for the scale-down process to start. When the scale-
down process ends, the attacker begins the attack again, and so on. Moreover, when the scale-up
process ends, there are extra machines, but no extra traffic. Thus, the victim pays unwittingly for
extra machines that are not utilized.
A recent trend in cloud applications is to use containers, adding an additional virtualization
layer by loading multiple containers on a single VM. Containers are light-weight with lower space
6and time overhead than VMs. Thus, the question arises whether containerized applications are
less vulnerable to the YoYo attack. One might speculate that this is the case due to their short
scale-up and scale-down times while the performance penalty is proportional to scale-up time, and
the economic penalty is proportional to scale-down time.
In this paper, we analyze Kubernetes, the most common container orchestration engine for con-
tainerized applications. We show that the YoYo attack can still have a huge impact. This is due to
the Kubernetes cluster architecture, which combines two levels of virtualization, Pods (container
level) and Nodes (VM level), and uses a two-stage auto-scaling mechanism: Pods are scaled first
until they fill allocated nodes and trigger new node allocations. The root observation is that the
increase in the number of nodes increases the economic damage of the attack but also the perfor-
mance damage, since it takes time to scale up Node. In Section 2 we present a model of Kubernetes
auto-scaling mechanism. We then present a formal model of YoYo attack on Kubernetes in Sec-
tion 3. In Section 4 we evaluate YoYo attack on Google Cloud infrastructure. We compared the
damage caused by the attack, economic and performance wise, while conducting YoYo attack on
Google Cloud Engine (GCE) that is VMs based, and YoYo attack on Google Kubernetes Engine
(GKE) that is containers based. We show, that Kubernetes, with the fast Pod scale-up reduces
the performance damage, but does not eliminate it. We also evaluate the classic DDoS attack on
Kubernetes and show that the YoYo attack is more cost effective to the attacker than a flat DDoS
attack.
7In Section 5, we propose a detection mechanism of YoYo attack on Kubernetes, based on
machine-learning technique. Previous machine learning based techniques in the literature [12, 20]
are not applicable to YoYo attack, since they rely mainly on traffic bandwidth and attempt to
assign a score that reflects the severity of the attack. Our solution suggests the XGBoost classifier
to detect a YoYo attack on a Kubernetes cluster. We show high accuracy results based on a
comprehensive analysis using that model, exploiting unique data (i.e., response time, Pod count,
Node count and CPU load) acquired from the Kubernetes cluster.
2 KUBERNETES
2.1 Kubernetes Background
Kubernetes is an open-source container orchestration engine for automating the management and
deployment of containerized applications. In this paper, we focus on Google Kubernetes Engine
(GKE), but note that other implementations of Kubernetes in the cloud, such as AKS(Azure) and
EKS(AWS), share the same behavior. We describe the Kubernetes basic mechanism, focusing on
the aspects relevant to auto-scaling. Kubernetes is a cluster of machines, called Nodes, that are
used to run user workloads called Pods. A Pod is the basic compute unit. It has one or more
containers running together, according to specific configuration parameters such as network uti-
lization, storage, CPU utilization, memory and container image name. Nodes are virtual machines
8in the cloud environment, and usually several Pods run on the same Node.
Applications use a simple Kubernetes Controller called Deployment, which provides declarative
updates for Pods. Each Pod gets its own IP address. In a Deployment where Pods are created and
destroyed dynamically, the set of Pods running at one moment might differ from the set of Pods
running that application a moment later. However, when there is a requirement to track Pods and
their IP address, Kubernetes defines a Service, which is a logical set of Pods and a policy (aka
microservice). The set of Pods targeted by a Service is determined by a selector. When a Node is
closed, all the Pods that run in the context on the Nodes are also closed. Pods can run in standalone
configuration but are usually grouped by Controllers. The Controller is responsible for maintaining
the correct number of Pods for every replication. For simplicity, we demonstrate the impact of the
YoYo attack on a deployment object and a deployment controller. Deployment objects represent a
set of multiple, identical Pods (that can be parts of multiple Nodes). Deployments are well-suited
for stateless applications. We note that there are other types of objects, such as StatefulSets, which
are designed for stateful applications.
2.2 Kubernetes Autoscaling
The GKE autoscaling is done by two components, the Horizontal Pod Autoscaler that automat-
ically scales the number of Pods and works on the application abstraction layer, and the Cluster
Autoscaler that automatically resizes the number of Nodes in a given Node pool and works on the
9infrastructure layer. Kubernetes also defines the Vertical Pod Autoscaler (VPA) that automatically
sets the resource request and limit values of containers based on usage. VPA is not in the scope of
this work.
2.2.1 The Horizontal Pod Autoscaler (HPA)
The HPA is responsible for automatically scaling the number of Pods [16]. The controller periodi-
cally adjusts the number of Pods needed based on the observed metric to the target configured by
the user. Each scale rule is defined by a threshold, scale interval and action, s.t. if the threshold
p p
exceeds the duration of the scale interval, the action will be performed. We denote by Iup \Idown
the scale interval for scale-up and scale-down of a Pod. Note that the default values (correct to the
p p
time of writing this paper) are 1 minute for Iup and 5 minutes for Idown . The most common metric
for a threshold is the relative CPU utilization, measured as the actual CPU usage of a Pod divided
by the CPU requested by the Pod. Note that the different metrics are measured on a service level.
Let P be the number of Pods, let Utarget be the relative target CPU of the Pod, defined as the
recent CPU divided by the CPU requested by the Pod, and let Ui be the relative CPU utilization
of the Pod i measured across the last 1 minute. Note that the relative CPU utilization can have a
value higher than 100%, since the Pod CPU usage is configured in milli CPU units. Thus, 200 milli
CPU is equal to 0.2 CPU, and if in peak time the Pod uses 500 milli CPU, then Ui = 250%. We
define the Average Relative CPU Utilization (Current CPU Utilization Percentage in Kubernetes
10terminology [15]) as:
P
1≤i≤P Ui
(1)
P
Note that, similar to relative CPU utilization, the average CPU utilization can be higher than
100%. The goal of the HPA is that the value will be close to the target value, in our case CPU
utilization, Utarget . In order to avoid oscillation, the HPA triggers scaling actions only if the value
is below 0.9 or above 1.1 of the target value (i.e., 10% tolerance) [16]. Thus, the target number of
Pods is:
P
1≤i≤P Ui
d e (2)
Utarget
We note that other possible metrics are the relative memory and storage. The HPA uses
an internal service called a metric server to periodically test the metrics of the cluster and act
accordingly (scale-up/scale-down) [16]. After a scaling decision is made, it takes relatively little
time until the Pod is ready to function. We call this time the Warming time and we denote it by
p p
Wup . Similarly, we also have Wdown , the time until the Pod is destroyed. We observed very fast
warming time, less than 30 seconds, and downtime of 5 seconds.
2.2.2 The Cluster Autoscaler (CA)
The CA interacts with the HPA and the metric server. It monitors and populates pending (newly
created) Pods and releases idle Nodes after the Pods are closed. Specifically, the CA checks every
1110 seconds for pending Pods that cannot be allocated in existing Nodes due to the lack of computer
resources. If such Pods are found, it initiates the creation of new Nodes to which the pending
Pods are scheduled. The number of Pods in the Nodes is according to the machine type of the
Nodes and the deployment configuration [10]. The machine type is configured by the system
administrator (per Node pool), and the system allocates as many Pods as possible to a Node. The
bound on the minimum and maximum number of Nodes in a cluster can be configured. A minimal
Kubernetes cluster needs 3 Nodes for scalability and high availability and can scale up to thousands
n n
of Nodes [13]. We denote by the Iup \Idown the scale interval for scale-up and scale-down of Nodes
n n
and the warming time of Nodes by Wup and Wdown . We observed interval scale-up of 10 seconds,
and interval scale-down of 10 minutes, which corresponded to a scale-up warming time of 2 minutes
and scale-down warming time of around 2 minutes. We note that none of these parameters can be
configured and are set by the Kubernetes infrastructure.
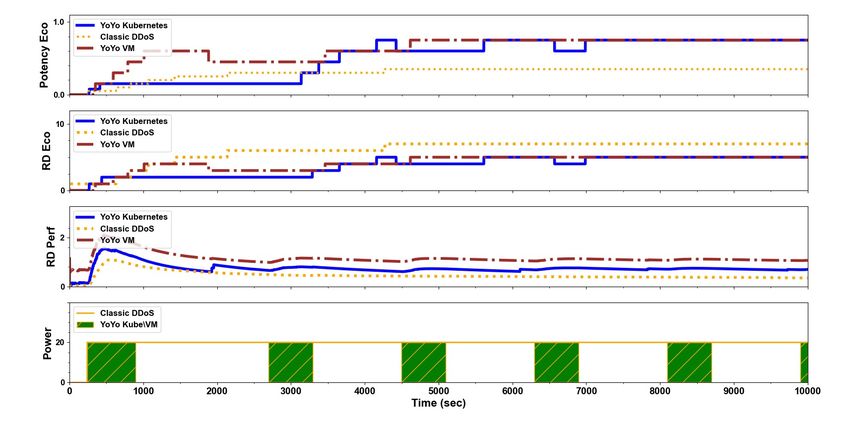
The Kubernetes autoscaling mechanism is well illustrated in figures 1. It shows nicely how the
cluster scales-up Nodes and Pods to manage a flat DDoS attack.
2.3 Kubernetes Pricing Models
As Kubernetes has become the leading container orchestration tool in the market, major Cloud
vendors have developed different pricing models to support their customers in order to leverage
Kubernetes from the TCO (total cost of ownership) perspective. Cost analysis is crucial to un-
12Figure 1: Classic DDoS attack with power k=20 on Kubernetes.
derstanding the economic damage of a YoYo attack on a Kubernetes cluster. We have selected
Google Kubernetes engine platform as our choice to analyze YoYo attack experiments. However,
our analysis and conclusions are relevant to Kubernetes technology in general. The cost of running
a Kubernetes Cluster in GKE is mainly a function of the number of Node instances. Customers
are billed for each of those instances according to the Compute Engine’s pricing, until the Nodes
are deleted. These Node instances are billed on a per-second basis with a one-minute minimum
usage cost regardless of the container workload in that instance. In addition, there is an hourly flat
fee for cluster management, irrespective of cluster size and topology, whether it is a single-zone,
multi-zone or a regional cluster. Amazon EKS has a similar pricing model where customers using
13Amazon EC2 will pay for EC2 Node instances. Amazon established an alternative pricing model
for their customers called AWS Faragate where the customers are charged per vCPU workload,
meaning per resource [1].
In a Faragate Kubernetes cluster, the instance hours are proportional to the number of Pods in
the cluster and other resources allocated to those Pods. Therefore, the cost of attack is derived from
the performance damage accrued, and the load of requests that the cluster can process concurrently
is influenced by the number of Pods and their elasticity.
3 YOYO ATTACK
Figure 2: YoYo attack with power k=20 on Kubernetes
14We follow the notation of the original YoYo attack [4] and adapt it to the Kubernetes model.
Consider a Kubernetes environment that includes autoscaling with identical service machines be-
hind a load balancer. Requests arrive with average rate of r requests per unit time, and the load
balancer distributes them to Np Pods that are divided between Nn Nodes in the steady state. Let
R be the number of Pods that can be in one node. The number of Pods in a Node is determined
by the Node machine type; a stronger machine will have a higher number of Pods.
The YoYo attack is composed of n cycles, and each cycle duration is T , comprised of an on-
attack period, denoted as ton , and an off-attack period, denoted as tof f . Thus T = ton + tof f . We
define the power of the attack as the extra load on the cluster. Let k be the power of the attack and
r the average request rate per second in a steady state. We assume that in the on-attack period,
the attacker adds fake requests k times more than the rate in the steady state (i.e. a total rate of
(k + 1) · r), while in the off-attack period tof f , the attacker does not send any traffic. See Table
1 for notation summary. The following is the best strategy from the adversary side: We assume
that the attacker aims to optimize the economic damage of the attack, with the main goal of being
active as little as possible while still scaling up to extra k · Nn nodes. A secondary goal is to cause
performance damage.
Autoscaling will occur as a result of Pod creation, which automatically activates the creation
of new Nodes. Two conditions must be met in order to activate autoscaling: First, the extra load
of k · r should burden the system such that the threshold for Pod scaling is fulfilled, regardless
15of the criterion (e.g., CPU utilization, traffic). Second, ton should be greater than or equal to the
p p
scale-interval of the Pods: Iup . That is, ton ≥ Iup . To maximize the performance damage, the value
of ton should be set such that the attack continues the load up until all Pods are active and it loads
the largest possible number of Nodes set in the cluster. Node loading occurs throughout ton since
there are not enough activated Pods to meet the performance criterion.
p p n n
That is, ton = Iup + Wup + Iup + Wup .
p n
Note that the dominant values are Iup , which is around 1 minute, and Wup , which is around 2
minutes. Therefore an optimal ton is around 4 minutes. Moreover, most of the parameters use the
system default configuration, but some of them can be modified. As such, the attacker will know
most of these parameters and can take advantage of them to optimize the attack. The tof f should
be large enough such that all the Pods and Nodes perform scale-down as this is how we maximize
the run time of the Nodes and cause extra spending. The mechanism first scales down all Pods,
p p p n
after which it triggers the scale-down of the Nodes. Hence, tof f = Idown + Wdown + Idown + Wdown .
p n
Note that the dominant values are Idown of 5 minutes and Idown of 10 minutes. Thus, the optimal
tof f is around 18 minutes.
An illustration of the YoYo attack can be seen in figures 2. It shows nicely how the cluster
oscillates its auto-scaling mechanism bases on Pods and Nodes to manage bursts of escalated
traffic.
16Table 1: Notation values of parameters given according to the experiments in Section 4.
Parameter Definition Configuration given by Value
r Average requests rate per second of legitimate clients System usage
Np Initial number of Pods 4
Nn Initial number of Nodes System administrator 4
R Number of Pods per Node 3
p p
Iup \Idown Threshold interval for scale-up and scale-down for a Pod 1min\5min
n n
Iup \Idown Threshold interval for scale-up and scale-down for a Node 10sec\10min
p p
Wup \Wdown Warming time of scale-up and scale-down for a Pod Kubernetes infrastructure 30sec\5sec
n n
Wup \Wdown Warming time of scale-up and scale-down for a Node 2min\2min
k The power of the attack
n Number of attack cycles Attacker
T Cycle duration 10\20
ton \tof f Time of on-attack phase and off-attack phase. T = ton + tof f
4 EXPERIMENT ANALYSIS
In this section, we present a proof of concept of the YoYo attack on Google Kubernetes engine
(GKE). Our environment in GKE consists of a simple HTTP server wrapped with a Docker con-
tainer, front-end side stateless without back-end. Each container is wrapped into a Pod. We ran
the Pods with the Deployment Controller, which is well-suited for stateless applications.
174.1 GKE Parameter Settings
We set the HPA utilization target parameter, Utarget , to 50%. The container runs a Web server
where each connection requires high CPU consumption. Each request to the Web server will
perform some computation on the dynamic input of that query. We used Google Stackdriver and
the Kubernetes "watch" command to monitor cluster parameters while collecting logs using the
Kubernetes Core API about Pods, Nodes, Relative CPU Utilization and the response time. We
used Apache JMeter [2] to simulate the load on the cluster. We evaluated the performance and
economic damage throughout the attack. Our Cluster Autoscaler boundaries were set to a minimum
of 3 Nodes. For the Node machine, we use an N1-Standard-1 CPU, and we started the experiment
with 4 Nodes. In this configuration there are 3 Pods per Node (R = 3). At the beginning of the
experiment there are 4 Nodes and 3 Pods (Nn = 4 , Np = 3). Hence, the system has enough
Nodes to populate newly created Pods (at least more than Nn ∗ R − Np Pods). This is a common
technique that allows a fast response to a limited overload, while paying for extra Nodes. We set
the power of the attack k, to 20. We set the on-attack time to ton = 10 minutes and the off attack
time to tof f = 20 minutes; a substantial number of experiments showed these values to be the
best (although not optimal bullet proof) for the YoYo attack and can demonstrate YoYo attack
characteristics.
18Figure 3: YoYo attack on Google Cloud Engine, VM Group.
4.2 Experiment Results
Figure 2 illustrates this attack: There are three sub-graphs sharing the x-axis, that shows the
attack time series in seconds. The bottom sub-graph shows the ton /tof f attacks (on attacks are
in filled green rectangles) using the Power unit. The middle sub-graph describes the expansion of
Pods (orange line) that the victim loads throughout the attack. The dotted blue line represents
the number of nodes provisioned to accommodate the Pods. The number of Pods increases up to
120 and the number of Nodes increases to 32 as a result of the increase in CPU utilization. When
the attack ends the cluster autoscaling keeps Pods in the idle state for 5 more minutes and the
19Nodes remain active for 10 additional minutes after all Pods are terminated. The top sub-graph
describes both the average relative CPU utilization in cyan solid line. The CPU Utilization graph
follows the equation 1, and as explained, the value can be larger than 100%. The HPA aims for a
value of Utarget = 50, and the scaling decision is made according to these values. The dashed blue
line in the sub-graph shows an average response time to answer requests in the cluster.
In some cases when nodes are deleted we experienced transient disruption interpreted as packet
errors and marked in red dots. This phenomenon is due to the fact that our workload consists
of a controller with a single replica, whose Pod might be rescheduled to a different node when its
current node was deleted. This can be solved by configuring critical Pods not to be interrupted.
4.2.1 Comparing the YoYo attack to the Classic attack
In order to understand the effect of the YoYo attack on Kubernetes as compared to a traditional
DDoS attack, we executed a constant power attack experiment (k = 20). Figure 1 illustrates a
classic DDoS attack that employs the same power of attack on the cluster as in the YoYo attack.
The three sub-graphs share a common x-axis which, as in Figure 2, shows the attack time series in
seconds. Likewise, the y-axis of each sub-graph is as described in Figure 2.
We define Dpattack (k), the performance damage caused by an attack as a function of k, the
power of the attack, and assess it as the average extra response time to answer requests during the
total attack time. We note that this is a simplified assumption, since the actual impact on client
20performance is more complicated to analyze. We define the relative performance damage as the
ratio between the damage following the attack and the corresponding value measured at a steady
state.
Dpattack (k)
RDpattack (k) = attack . (3)
Dp (k = 1)
Similarly, we define relative economic damage as the ratio between the economic damage following
the attack and the corresponding value measured at a steady state.
Deattack (k)
RDeattack (k) = . (4)
Deattack (k = 1)
Deattack (k), is the economic damage caused by the attack, and assess it as the average extra Nodes
running in the system for the duration of the attack. We refer in Figure 4 to RDpattack (k) and
RDeattack (k) as the relative performance damage and relative economic damage correspondingly.
In the YoYo attack, the attack cost is directly affected by the power of attack k and by the ton
period relative to the attack cycle length. That is:
ton
Cost(k) = k · (5)
T
The cost of a classic DDoS attack is equal to the power of the attack, while the cost of the YoYo
attack is only a third of the cost of a classic attack.
Potency is a metric that measures the effectiveness of DDoS attack from the attacker side. It
is defined as the ratio between the damage caused by an attack and the cost of mounting such
21an attack. We denote Pe (k) as the Potency of the attack. An attacker would be interested in
maximizing the potency. We use the following definitions for cluster autoscaling (ca) attack:
RDe (k)
Pe (k) = (6)
Cost(k)
Figure 4 illustrates a comparison of the relative economic damage and the potency incurred by
the victim had it been attacked by the two attack types. Figure 4 shows that the classic DDoS
attack results in RDe = 7 whereas the YoYo attack results in RDe = 5. The top sub-graph shows
the potency comparison between the YoYo attack and the classic DDoS attack. In addition, the
YoYo attack causes iterative performance damages, incurred at the beginning of each iteration
starting at ton . The classic DDoS attack causes the least performance damage to a Kubernetes
cluster without any packet errors since Pods are not rescheduled and Nodes are not scaled-down.
The attack impact is mainly in the beginning of the attack while for the remainder of the attack
a Kubernetes cluster is fully resilient. We summarize the results in Table 2 and conclude that the
YoYo attack on Kubernetes is more cost effective for the attacker than a classic DDoS attack.
4.2.2 YoYo attack: Kubernetes Vs. VM
To emphasize that Kubernetes has better resilience than VM against YoYo attacks (performance
wise) but shares a similar vulnerability to economic damage, we repeated the experiments from
the original YoYo paper [4] and compared them to the experiments we conducted in this paper.
We built an instance of VM group in GCE and a load balancer based on a VM group template
22using machine type n1-standard-1 (1 vCPU, 3.75 GB memory) identical to the one we built for
the GKE cluster. The VM group instance is set with auto-scaling capability of up to 24 VMs and
adaptive scaling where all the machines that are ready to be scaled are scaled up at once. We used
same parameters used in the YoYo Kubernetes attack and ran it for n cycles of duration T. The
power of the attack was k = 20. Figure 3 illustrates YoYo VM attack which can be compared with
the YoYo Kubernetes attack illustrated in Figure 2. A key observation is that an attack on VM
group causes to an immediate slow response time and packet errors through the burst of loads.
That observation lasts until the scale-up process ends. This behavior repeats in every attack cycle.
YoYo VM attack results a relative performance damage RDp = 1.66. The relative performance
degradation recorded by a YoYo Kubernetes is significantly lower with almost no packet errors
(except the transient disruption due to Pods rescheduling). We can explain this since Kubernetes
loads Pods in seconds to absorb the increased traffic until enough additional Nodes are ready with
new Pods. Like in Kubernetes the attack cost is directly affected by the power of attack k and by
the ton period relative to the attack cycle length. Figure 4 shows that the YoYo VM attack results
almost the same relative economic damage and Potency as the YoYo attack causes to a Kubernetes
cluster. YoYo attack may cause relatively the same economic damage in the cloud to GCE VM
group as to a Kubernetes cluster, while the performance damage is more significant to a victim in
GCE VM group. We conclude that a VM group is less resilient to YoYo attacks than a Kubernetes
cluster.
23Table 2: Summary results: Classic DDoS:(k = 20), YoYo Kubernetes and YoYo VM
both:[ton = 10, tof f = 20],(k = 20)
Parameters Classic DDoS YoYo Kubernetes YoYo VM
20 20
Cost 20 3 3
Relative Economic Damage 7 5 5
Relative Performance Damage 0.75 1.15 1.66
Potency Economic 0.3 0.75 0.75
Figure 4: Measuring attack effectiveness: Classic DDoS Vs. YoYo on Kubernetes and VM.
245 YOYO ATTACK DETECTION
In this section we propose an enhanced detection technique designed to protect Kubernetes au-
toscaling from YoYo attacks. Detecting YoYo attack allows cloud vendors to mitigate the attack by
applying different strategies such as inline scrubbing or by holding cluster downscale of Nodes to
maintain the short response time on the expense of high economic damage. Unfortunately, we were
unable to access real life data from Kubernetes production clusters that can supply big data to feed
our model. Our research aims to analyze a live Kubernetes cluster reacting dynamically. Consid-
ering that, although our analysis is focused on ML methods evaluation and results high accuracy
detecting the YoYo attack, we can not guarantee at this point the same results on a production
Kubernetes cluster.
Time series data generated by the Kubernetes cluster are the primary foundations of the features
for our model (e.g., response time, pod count, node count and CPU load as you can see see in Figure
2). The input data contains hundreds of thousands discreet features (e.g., each value recorded is
considered a feature). We evaluated a deep neural network approach where a convolution neural
network (CNN) was concatenated with long short term memory (LSTM) module which is good
fit for a sequential data, followed by a linear layer to classify a YoYo attack. This deep neural
network requires a large amount of data and long training cycles, this method is not optimal to
sparse datasets. In order to match our unique input data to machine learning methods we used
a feature extraction principles. We found out that extracting statistical functions from the time
25series data (e.g mean, minimum, maximum,std,median) generating up to 20 features per sample
is ideal for our model to achieve excellent performance. We evaluated multiple machine learning
methods and selected the XGBoost [7] algorithm. XGBoost is a non linear classifier that works
well for our attack detection evaluation.
5.1 Model Setup and Formulation
5.1.1 XGBoost Classification Algorithm
XGBoost is a state of the art method that addresses the best speed and accuracy with limited
datasets. XGBoost is a classifier and a regressor based on the gradient boosting algorithm. It uses
an ensemble of decision trees. Each tree corrects the mistakes of the trees that came before it. It is
both fast and efficient, performing well on sparse data and on a wide range of predictive modeling
tasks.
We explain the XGBoost detection method [8] in a nut-shell. Rm is the space of regression trees.
Let q represent the structure of each tree that maps a sample to a corresponding leaf index. Let T
be the number of leaves in the tree. Each fk corresponds to an independent tree structure q and
leaf weights w. Each regression tree contains a continuous score on each leaf. The final prediction
for a given sample is the sum of predictions from each tree. The tree ensemble model is trained in
an additive mode and it greedily sums up the gradients on each leaf and then applies the scoring
26value to improve the target function, and brings the result to a minimum.
5.1.2 Methodology & Data Engineering
Our test-bed design for the YoYo attack on Kubernetes is documented in detail in Section 4
(Experiment analysis). We built our datasets on a live cluster, experimenting on labeled traffic
loads with the following two classes: Attack (1) and Regular (0). Class label Attack (1) represents
a YoYo attack as described above, and class label Regular (0) represents an average load on a site.
Testing and training datasets are a collection of balanced experiments of the two classes taken with
a range of parameters as describe in 3. Note, the default setting for the on-attack time to ton = 10
minutes and off-attack time to tof f = 20 minutes. The default settings for the YoYo attack is
k = 20 and for Regular load is k = 2. The collection is split randomly with 70%:30% ratio for
training and testing datasets. We are interested in learning the cluster autoscaling behavior when
the system is under attack and when the system is normally or highly but legitimate loaded. The
goal is to binary classify the situation. We mimicked normal and attack distributions loads by
setting HTTP connections using the popular JMeter v5.2 [2] network tool. Hence we started by
generating a workload that simulates YoYo attacks. To increase the dataset variance we populated
multiple parameters and values. We trained the model with multiple ton and tof f attacks, covering
in each attack or regular sample at least 3 cycles of duration T . Thus, our model requires at least
3 of cycles of duration T for inference. We configured threads ramp-up time (The ramp-up period
27defines the duration the full number of threads are loading) to control load scale-up in different
levels. Last, we used JMeter timers to set either a constant or random delay between requests in
the Regular class. We believe that using all of these parameters simulate similar conditions as best
as possible of a real distributed load on typical web applications. Table 3 represents the variance
of datasets created using experiments parameters.
Table 3: Dataset parameters for YoYo classifier.
ramp-up(sec) ton /tof f (min) Power(k) timers
Regular 30,60,120 continuous 1,3,5,7 constant,random
Attack 30,60,120 7/14, 10/20, 12/24 15,20,30 constant
5.1.3 XGBoost Optimization
We used Python Scikit-learn model selection interfaces such as RandomizedSearchCV and Grid-
SearchCV to optimized the XGboost parameters. The parameters of these estimators used to
optimized our selected method parameters by cross-validated search over parameter settings and
can apply scoring. The parameters we optimized using these methods are: number of estimator
trees (The more trees defined, the better are the estimates and longer is the computation time),
max depth (parameter to control over-fitting as higher depth will allow model to learn relations
28very specific to a particular sample. The absolute maximum depth would be N − 1, where N
is the number of training samples), max features and criterion (Impurity function: gini vs en-
tropy). We found by using cross validation estimator the following parameters values as the best
to achieve the highest performance: classweight = balanced, criterion = gini, max_depth = 1,
max_f eatures = auto, min_samples_leaf = 10, min_samples_split = 40, n_estimators = 10.
In addition, we executed the Explainable Boosting Machine package (EBM) to understand the most
explainable features for the classifications among the 20 selected features. Table 4 ranks each fea-
ture with a value between 0 and 10 where 0 is the least important feature for the model and 10 is
the most important feature.
Table 4: Importance absolute score for XGBoost features.
Feature name Mean Std Maximum Minimum Median
Response Time 6.0 6.0 8.8 0.0 7.8
Pods 9.3 9.8 9.5 0.0 7.2
CPU load 4.4 4.5 10.0 0.0 1.0
Nodes 9.2 9.2 9.8 5.5 9.3
295.2 Evaluation Results
In this section we summarize the results of our models as they perform on our dataset. We collected
experimental data from 21 samples of attacks and the same regular load as described above. We
provide the results of classification measures for accuracy, precision, recall, F1, false positives (FP),
false negatives (FN), true positives (TP) and true negatives (TN).
TP + TN
accuracy = (7)
TP + FP + TN + FN
TP
precision = (8)
TP + FP
TP
recall = (9)
TP + FN
precision · recall
F1 = 2 · (10)
precision + recall
5.2.1 XGBoost Classifier Evaluation
The XGBoost classifier has the most accurate results on our Datasets as you can see in table 5. We
evaluated multiple machine learning methods in addition to XGboost. Among them are: Logistic
regression, Random forest, Decision trees and a deep neural network based on CNN + LSTM.
XGBoost model is a perfect fit for experiments with either sparse data, it requires less performance
time (no epochs are required), and it suffers the least from over-fitting.
Our proposed classifier can achieve the highest accuracy score on the testing dataset, the XG-
Boost algorithm reaches an accuracy score of 95% (F1=0.94), while the CNN+LSTM, Logistic
30Regression, Decision Tree and Random Forest can achieve accuracy score which is less than 90%.
The running time of XGBoost and other classic machine learning algorithms is less than a second.
The running time of CNN+LSTM is much higher,it is counted in thousands seconds due to the
enormous number of epochs. Therefore, overall, our selected model has the best comprehensive
performance.
Table 5: Algorithms performance comparison.
Recall Precision Accuracy % Training Time(sec)
XGBoost 1.0 0.89 94% 0.33
CNN+LSTM 0.85 1.0 93% 3600
Random Forest 0.83 0.82 83% 0.15
Logistic Regression 0.78 0.78 85% 0.5
Decision Tree 0.83 0.89 84% 0.04
6 RELATED WORK
DDoS prevention is crucial to cloud computing environments [14]. Several works [3, 17] recommend
auto-scaling and Kubernetes specifically as a possible solution to mitigate DDoS attacks. Some
31works [23, 22] describe how a traditional DDoS attack can be transformed into an EDoS in the
cloud environment. Other works have tried to mitigate EDoS attacks [21, 19, 20, 8] using machine
learning classification techniques trying to limit a malicious bot. A recent work uses the XGBoost
classifier as a DDoS detection method [8] in an SDN based cloud. Other studies [5] research
containerized autoscaling but refer neither to cloud resilience nor DDoS mitigation. A recent work
[20] focused on resource patterns with cyclic trends with the aim of analyzing resource behavior
on micro-services using auto-aggressive statistical models on auto-scaling systems. Older works
attempt to prevent EDoS by directing suspicious traffic to a scrubber service and using client
puzzles to detect legitimate users by identifying suspicious traffic using a threshold policy (e.g.,
requests/sec)[18].
7 CONCLUSIONS
In this work we illuminate the potential of exploiting the auto-scaling mechanism to perform an
efficient attack on Kubernetes that impacts the cost and the quality of a service. We show that
Kubernetes is still vulnerable even with a light-weight containerized architecture. We also show
that YoYo VM attack results almost the same relative economic damage as the YoYo Kubernetes
attack. However, VM groups are still less resilient to YoYo attacks than Kubernetes clusters. In
addition we conclude that the YoYo attack on Kubernetes is more cost effective for the attacker
32than a classic DDoS attack. We believe that the auto-scaling mechanism alone is not enough, and
therefore we propose a unique approach based on XGBoost algorithm to detect YoYo attacks and
allow to mitigate the DDoS damage. We also show that XGBoost algorithm has an high accuracy
and a lower false positive rate. To the best of our knowledge this work is the first to detect DDoS
burst attacks on a Kubernetes cluster using a machine learning method, specifically with XGBoost.
Future works will aim to evaluate YoYo attacks on multiple applications from different tenants
running in the same Kubernetes cluster when only one of the applications is the target. Future
research may also evaluate the resilience of cloud mesh services running multi-tenant environments
to YoYo and similar DDoS attacks.
Acknowledgments
This research was supported by Google Cloud Research. We would like to thank also Daniel Bachar
and Assaf Sinvani for helpful discussions and thier help with the experiments setup.
References
[1] Amazon eks pricing. https://aws.amazon.com/eks/pricing/, 2018.
[2] The apache jmeterTM . https://jmeter.apache.org/, 2019.
33[3] Aws best practices for ddos resiliency,december 2019. https://d0.awsstatic.com/
whitepapers/Security/DDoS_White_Paper.pdf, 2019.
[4] A. Bremler-Barr, E. Brosh, and M. Sides. Ddos attack on cloud auto-scaling mechanisms. In
IEEE INFOCOM 2017 - IEEE Conference on Computer Communications, pages 1–9, May
2017.
[5] E. Casalicchio and V. Perciballi. Auto-scaling of containers: The impact of relative and
absolute metrics. In 2017 IEEE 2nd International Workshops on Foundations and Applications
of Self* Systems (FAS*W), pages 207–214, Sep. 2017.
[6] Eldad Chai. Ddos attacks: Hit and run ddos attack. https://www.imperva.com/blog/
hit-and-run-ddos-attack, 2013.
[7] Tianqi Chen and Carlos Guestrin. Xgboost: A scalable tree boosting system. In Proceedings of
the 22nd ACM SIGKDD International Conference on Knowledge Discovery and Data Mining,
KDD ’16, page 785–794, New York, NY, USA, 2016. Association for Computing Machinery.
[8] Z. Chen, F. Jiang, Y. Cheng, X. Gu, W. Liu, and J. Peng. Xgboost classifier for ddos attack
detection and analysis in sdn-based cloud. In 2018 IEEE International Conference on Big
Data and Smart Computing (BigComp), pages 251–256, 2018.
34[9] Catalin Cimpanu. Pulse wave new ddos assault pattern dis-
covered. https://www.bleepingcomputer.com/news/security/
\pulse-wave-new-ddos-assault-pattern-discovered/, 2017.
[10] Cluster autoscaler. https://cloud.google.com/kubernetes-engine/docs/concepts/
cluster-autoscaler, 2021.
[11] Amir Dahan. Behavioral burst-attack protection. https://blog.radware.com/security/
2018/02/burst-attack-protection, 2018.
[12] V. Deepa, K. M. Sudar, and P. Deepalakshmi. Detection of ddos attack on sdn control plane
using hybrid machine learning techniques. In 2018 International Conference on Smart Systems
and Inventive Technology (ICSSIT), pages 299–303, Dec 2018.
[13] Guidelines for creating scalable clusters. https://cloud.google.com/kubernetes-engine/
docs/concepts/scalability, 2020.
[14] B. Grobauer, T. Walloschek, and E. Stocker. Understanding cloud computing vulnerabilities.
IEEE Security Privacy, 9(2):50–57, March 2011.
[15] Kubernetes.io. Horizontal pod autoscaler. https://github.com/kubernetes/community/blob/
master/contributors/design-proposals/
autoscaling/horizontal-pod-autoscaler.md, 2017.
35[16] Kubernetes.io. Horizontal pod autoscaler. https://kubernetes.io/docs/tasks/
run-application/horizontal-pod-autoscale/, 2021.
[17] Rui Miao, Minlan Yu, and Navendu Jain. NIMBUS: cloud-scale attack detection and mitiga-
tion. In ACM SIGCOMM Computer Communication Review, 2014, volume 44, pages 121–122.
SIGCOMM, 2014.
[18] M. Naresh Kumar, P. Sujatha, V. Kalva, R. Nagori, A. K. Katukojwala, and M. Kumar. Mit-
igating economic denial of sustainability (edos) in cloud computing using in-cloud scrubber
service. In 2012 Fourth International Conference on Computational Intelligence and Commu-
nication Networks, pages 535–539, 2012.
[19] S. Nautiyal and S. Wadhwa. A comparative approach to mitigate economic denial of sustain-
ability (edos) in a cloud environment. In 2019 4th International Conference on Information
Systems and Computer Networks (ISCON), pages 615–619, 2019.
[20] R. Ravichandiran, H. Bannazadeh, and A. Leon-Garcia. Anomaly detection using resource
behaviour analysis for autoscaling systems. In 2018 4th IEEE Conference on Network Soft-
warization and Workshops (NetSoft), pages 192–196, June 2018.
[21] A. Shawahna, M. Abu-Amara, A. S. H. Mahmoud, and Y. Osais. Edos-ads: An enhanced mit-
igation technique against economic denial of sustainability (edos) attacks. IEEE Transactions
on Cloud Computing, 8(3):790–804, 2020.
36[22] Gaurav Somani, Manoj Singh Gaur, and Dheeraj Sanghi. DDoS/EDoS attack in cloud: af-
fecting everyone out there! In Proceedings of the 8th International Conference on Security of
Information and Networks, 2015, pages 169–176. ACM, 2015.
[23] S VivinSandar and Sudhir Shenai. Economic denial of sustainability (EDoS) in cloud services
using http and xml based DDoS attacks. International Journal of Computer Application 2012,
41(20), 2012.
[24] Igal Zeifman. Pulse wave ddos attacks:. https://www.imperva.com/blog/
pulse-wave-ddos-pins-down-multiple-targets/, 2019.
37תקציר המאמר
בשנים האחרונות ,אנו עדים לצורה חדשה של התקפות ממש"מ )מתקפת מניעת שירות מבוזרת( ,התקפות
חדשות אלו הן התקפות חוזרות של פרצים קצרים בהם התוקף משגר עומסי תעבורה רגעיים בפרץ קצר וחזק
על מספר מטרות אונליין בעת ובעונה אחת .בעבודה שנעשתה לאחרונה )אינפוקום (2017הוצגה מתקפה מסוג
יויו הפועלת על מנגנוני אוטוסקייל של מכונות וירטואליות בענן .פרצי התעבורה הרגעיים גורמים למנגנון
האוטוסקייל לנוע ממצב של סקייל-אפ כלומר הגדלת משאבי החישוב והגדלת כמות המכונות הוירטואליות
למצב של סקייל-דאון כלומר צמצום משאבי העיבוד והקטנת המכונות הוירטואליות .מנגנוני האוטוסקיילינג
בענן למעשה מתרגמים מתקפה שטוחה של מניעת שרותיות )בה עוצמת המתקפה קבועה לכל זמן המתקפה(
למתקפה כלכלית של סירוב שירותיות .במצב זה האתר המותקף ינזק גם ברמה הכלכלית כך שבנוסף לנזק
מהידרדרות בביצועי האתר וירידה באיכות השירות יצטבר נזק כלכלי .הנזק הכלכלי מתבטא בתשלום לספק
הענן על מכונות וירטואליות נוספות שיטענו ויהיו פעילות בשל תוספת התעבורה המזוייפת שגורם התוקף.
כבר הוכח בעבודה הקודמת שהתקפה הבנויה היטב מסוג יויו גורמת לנזק משמעותי בביצועיי המערכת בשל
העובדה שבכל טעינה של מכונה וירטואלית נגרמת האטה בזמני התגובה בשלה זמן הטעינה שעורך דקות
ספורות .במחקר זה אנו ננתח את עמידות מנגנון קוברנטיס שהיא ארכיטקטורה מודרנית בשרותי ענן להתקפות
מסוג יויו .ארכיטקטורת הקוברניטיס צוברת פופלריות רבה בשנים האחרונות .בשנה האחרונה פתרונות ענן
רבים עברו המרה ממכונות וירטואליות לקוברניטיס .במאמר זה אנו מציגים תוצאות ניסויים מעשיים שנעשו
על קלסטר קוברניטי בפלטפורמת הענן של גוגל .נראה ונוכיח שאמנם בקוברניטיס הנזק לביצועיי המערכת קטן
יותר מאשר במערכות מכונות וירטואליות הישנות .הנזק הכלכלי לעומת זו משמעותי ולכן קוברניטיס פגיע
למתקפה בנוייה היטב מסוג יויו .כמו כן נציג מודל למידת מכונה לזיהוי מדוייק של מתקפת יויו על קלסטר
בקוברניטיס.עבודה זו בוצעה בהדרכתו של פרופ' ענת ברמלר-בר מבי"ס אפי ארזי למדעי המחשב ,המרכז הבינתחומי,
הרצליה.בית-ספר אפי ארזי למדעי המחשב
התכנית לתואר שני ) - (M.Sc.מסלול מחקרי
.
הפגיעות של מערכות קוברניטיס למתקפת יויו,
זיהוי ומניעה
מאת
רונן בן דוד
עבודת תזה המוגשת כחלק מהדרישות לשם קבלת תואר מוסמך M.Sc.
במסלול המחקרי בבית ספר אפי ארזי למדעי המחשב ,המרכז הבינתחומי הרצליה
יוני 2021You can also read