Lake Tahoe West Science Summary of Findings Report
←
→
Page content transcription
If your browser does not render page correctly, please read the page content below
Lake Tahoe West Science
Summary of Findings Report
November 3, 2020
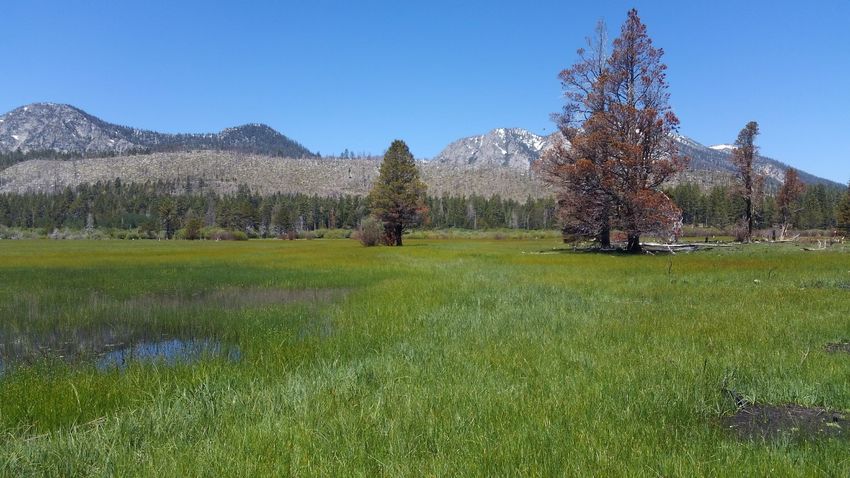
Cover Photo: Looking north to the Lake Tahoe West area from a prescribed burn at Baldwin meadow,
with the burned area from the Emerald wildfire of 2016.
Science Team Members
Jonathan W. Long, Patricia N. Manley, Angela Mariana Dobre and Erin Brooks (University of
M. White, Keith M. Slauson, Stacy A. Drury, Eric Idaho)
S. Abelson, Brandon M. Collins (USDA Forest
Sam Evans, Tim Holland, and Matthew Potts
Service Pacific Southwest Research Station)
(University of California at Berkeley)
Keith Reynolds (USDA Forest Service Pacific
Adrian Harpold and Sebastian Krogh Navarro –
Northwest Research Station)
(University of Nevada at Reno)
William Elliot and I. Sue Miller (USDA Forest
John Mejia (Desert Research Institute)
Service Rocky Mountain Research Station)
Chad Hoffman & Justin Ziegler (Colorado State
Rob Scheller and Charles Maxwell (North
University)
Carolina State University)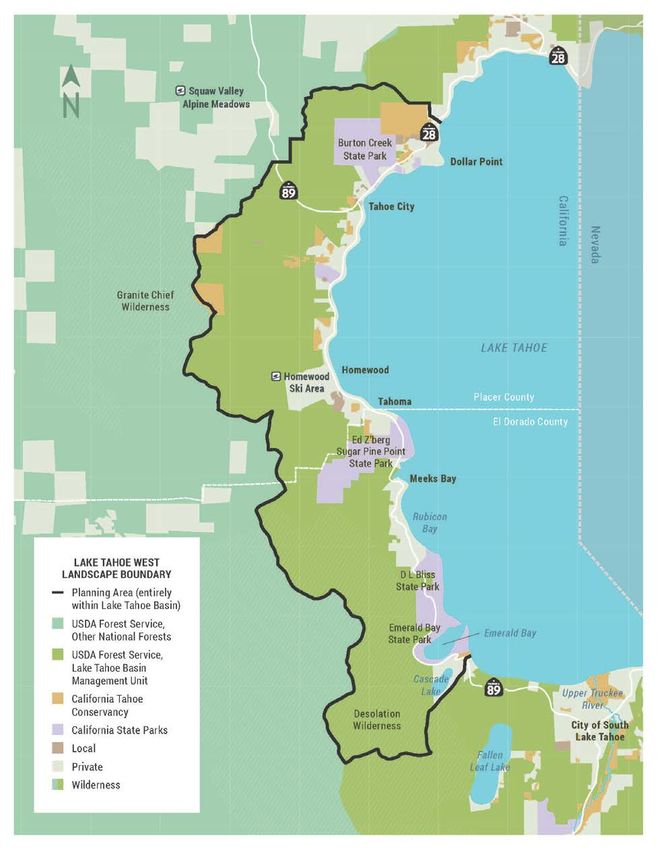
Abstract

As part of the Lake Tahoe West Restoration Partnership, a science team worked with resource managers
to evaluate effects of forest dynamics and management strategies on social and ecological values within
a 59,000-acre landscape in the western part of the Lake Tahoe basin in California. Forest growth and fire
dynamics were modeled across the landscape using the LANDIS-II platform over 100 years;
interconnected models were used to evaluate changes in wildlife habitat, water quality, and economics.
Additional modeling and some field monitoring were conducted to evaluate how treatments would
affect fire behavior, fuels, and snow hydrology within forest stands. These investigations evaluated how
different management strategies would affect outcomes important to stakeholders, including
abundance of old trees, wildlife habitat, fine sediment, water quantity, implementation costs, fire
characteristics and threats, air quality, cultural resource quality, and carbon sequestration. The
scenarios spanned a wide range of management approaches, from wildfire-suppression only, fuels
reduction near communities, moderate and extensive restorative thinning and/or prescribed burning.
The results indicated that moderate and extensive thinning or burning treatments would promote
overall objectives better than no treatment or thinning only near communities, except for carbon
sequestration and treatment costs. Over the long-term, more treatment would reduce the wildfire
threat to communities, the risk of unnaturally large patches of high intensity burns, and days of extreme
emission of smoke into downwind communities. More extensive treatments were projected to increase
water yield and promote the growth and occurrence of pine and aspen trees. Increased treatments,
especially burning, may promote cultural resources important to the Washoe Tribe of Nevada and
California (hereafter the “Washoe Tribe”), who consider Lake Tahoe the center of their ancestral
homelands. On the other hand, greatly ramping up prescribed burning may pose a challenge in terms of
avoiding near-term impacts of treatments on air quality and water quality, even though such a strategy
may yield long-term net benefits.

                                                    i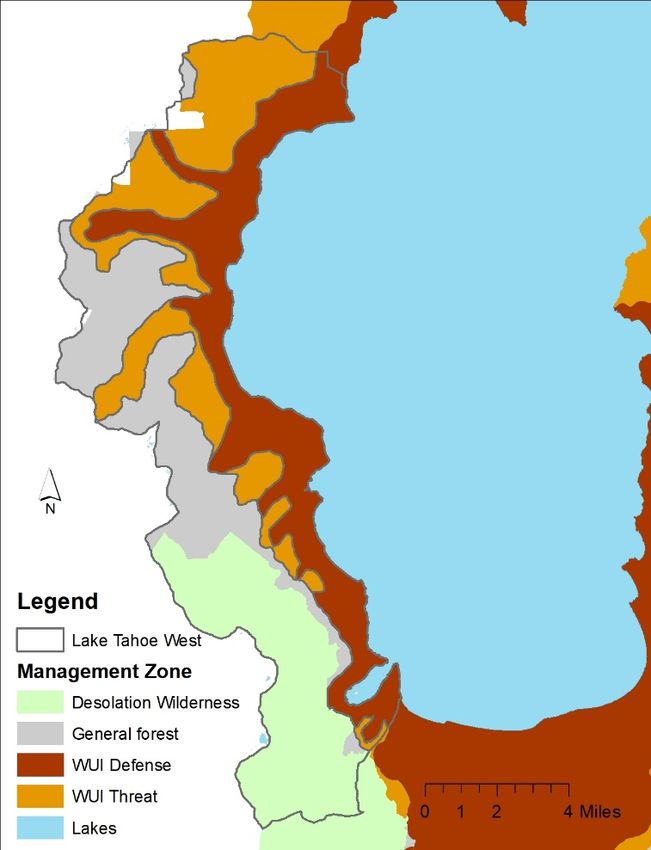
CONTENTS
1     Introduction ....................................................................................................................................... 1-1
    1.1      Landscape-scale Modeling ......................................................................................................... 1-3
    1.2      Integrated Evaluation of Social and Ecological Values .............................................................. 1-3
    1.3      Climate Scenarios ....................................................................................................................... 1-5
    1.4      Management Scenarios ............................................................................................................. 1-6
      1.4.1          Variation in treatment across scenarios ............................................................................ 1-8
      1.4.2          Projected treatment intervals ............................................................................................ 1-8
    1.5      Indicators and Target Conditions ............................................................................................... 1-9
2     Key Findings ....................................................................................................................................... 2-2
    2.1      Landscape Fire ........................................................................................................................... 2-2
      2.1.1          Area burned ....................................................................................................................... 2-2
      2.1.2          Amount of landscape burned at low, moderate, and high severities ............................... 2-3
      2.1.3          Amount of landscape burned in large high severity patches ............................................ 2-3
      2.1.4          Fire return interval ............................................................................................................. 2-4
      2.1.5          Percent of WUI zones burned at high and moderate severity .......................................... 2-4
      2.1.6          Sensitivity of fire dynamics to climate ............................................................................... 2-4
      2.1.7         Implications ........................................................................................................................ 2-5
    2.2      Forest Structure and Composition ............................................................................................. 2-5
      2.2.1          Dominant vegetation types................................................................................................ 2-5
      2.2.2          Trends in forest species composition ................................................................................ 2-6
      2.2.3          Seral Stage.......................................................................................................................... 2-7
      2.2.4          Areas with old trees ........................................................................................................... 2-8
      2.2.5          Implications ........................................................................................................................ 2-8
    2.3      Carbon ........................................................................................................................................ 2-9
      2.3.1          Forest ecosystem carbon ................................................................................................... 2-9
      2.3.2          Whole system carbon ........................................................................................................ 2-9
      2.3.3          Sensitivity to climate projections ..................................................................................... 2-10
      2.3.4          Implications ...................................................................................................................... 2-10
    2.4      Nitrogen ................................................................................................................................... 2-11
      2.4.1          Implications ...................................................................................................................... 2-11
    2.5      Landscape Water Quality Dynamics ........................................................................................ 2-11

                                                                              ii
2.5.1       Effects of treatments on very fine sediment and phosphorus yield................................ 2-11
  2.5.2       Effects of wildfire on very fine sediment and phosphorus yield ..................................... 2-12
  2.5.3       Effects of alternative management scenarios on very fine sediment and phosphorus .. 2-12
  2.5.4       Areas of high erodibility ................................................................................................... 2-12
  2.5.5       Effects of changing climate on storm intensity and future loading ................................. 2-13
  2.5.6       Implications ...................................................................................................................... 2-13
2.6    Water Quality and Roads ......................................................................................................... 2-13
  2.6.1       Sedimentation from the current forest road network .................................................... 2-13
  2.6.2       Implications ...................................................................................................................... 2-14
  2.6.3       Water quality impacts from opening abandoned roads .................................................. 2-14
  2.6.4       Implications ...................................................................................................................... 2-14
  2.6.5       Erosion dynamics and interactions with roads following the Emerald Wildfire.............. 2-14
  2.6.6       Implications ...................................................................................................................... 2-15
2.7    Water Quantity and Snow Dynamics ....................................................................................... 2-15
  2.7.1       Effects of forest thinning on water quantity.................................................................... 2-15
  2.7.2       Effects of forest thinning on snowpack duration............................................................. 2-16
  2.7.3       Translation to landscape, long-term scales, and modeled scenarios .............................. 2-16
  2.7.4       Implications ...................................................................................................................... 2-16
2.8    Treatment Effects on Fire Behavior and Forest Structure in Aspen Stands ............................ 2-17
  2.8.1       Implications ...................................................................................................................... 2-17
2.9    Stand-Scale Treatment Effects on Forest Structure, Composition, and Fuels ......................... 2-17
  2.9.1       Implications ...................................................................................................................... 2-18
2.10   Wildlife Conservation ............................................................................................................... 2-18
  2.10.1      Biodiversity....................................................................................................................... 2-18
  2.10.2      Old Forest Predators ........................................................................................................ 2-18
2.11   Cultural Resources ................................................................................................................... 2-20
2.12   Air Quality ................................................................................................................................ 2-20
  2.12.1      Emissions of fine particulates .......................................................................................... 2-20
  2.12.2      Smoke impacts ................................................................................................................. 2-21
2.13   Implementation Feasibility ...................................................................................................... 2-21
  2.13.1      Staffing ............................................................................................................................. 2-21
  2.13.2      Days of Intentional Burning ............................................................................................. 2-21
2.14   Economic Costs and Benefits ................................................................................................... 2-22

                                                                      iii
2.14.1        Implementation costs ...................................................................................................... 2-22
      2.14.2        Risk to property................................................................................................................ 2-22
      2.14.3        Public health..................................................................................................................... 2-23
      2.14.4        Implications ...................................................................................................................... 2-23
    2.15     Integrated Decision Support .................................................................................................... 2-24
3     Integrated Findings .......................................................................................................................... 3-28
    3.1      More Intensive and Extensive Treatment Promotes Multiple Objectives............................... 3-28
      3.1.1      Fire and thinning reduce wildfire severity and achieve other social benefits—and area
      treated is a key driver of those benefits .......................................................................................... 3-28
      3.1.2         Increasing carbon storage may not be consistent with achieving other objectives........ 3-28
      3.1.3         Thinning smaller trees can promote multiple objectives ................................................ 3-29
      3.1.4     Limiting treatments to 14” DBH (as in hand thinning) or 24” DBH trees might limit
      restoration effectiveness in certain conditions ............................................................................... 3-29
      3.1.5         Increasing use of prescribed fire was associated with the most favorable results overall . 3-
      29
    3.2      Opportunities to Mitigate Potentially Unfavorable Impacts ................................................... 3-30
      3.2.1         Air quality impacts from use of wildland fire ................................................................... 3-31
      3.2.2         Feasibility barriers to increased prescribed burning ....................................................... 3-31
      3.2.3         Water quality impacts from prescribed burning ............................................................. 3-31
      3.2.4         Impacts to large trees and carbon storage over the long run ......................................... 3-32
      3.2.5         Pollutant loads from increased use of road networks ..................................................... 3-32
    3.3      Management Can Affect Positive Change Despite Future Climate Influences ........................ 3-32
    3.4      Spatial Prioritization Aids Implementation of Strategies ......................................................... 3-33
      3.4.1         Potential priority areas for treatment ............................................................................. 3-33
      3.4.2         Potentially sensitive areas ............................................................................................... 3-33
    3.5      Opportunities for Monitoring to Support Future Science-Based Management ...................... 3-34
      3.5.1         Landscape fire regime indicators ..................................................................................... 3-34
      3.5.2         Ground cover for water quality ....................................................................................... 3-35
      3.5.3         Water quantity ................................................................................................................. 3-35
      3.5.4         Air quality and emissions ................................................................................................. 3-35
      3.5.5         Wildlife ............................................................................................................................. 3-35
      3.5.6         Vegetation and ecosystem carbon .................................................................................. 3-35
      3.5.7         Fuels ................................................................................................................................. 3-36
      3.5.8         Cultural resources ............................................................................................................ 3-36

                                                                             iv
3.5.9         Wood products and pile burning ..................................................................................... 3-36
    3.5.10        Management costs........................................................................................................... 3-36
4   References ....................................................................................................................................... 4-37

                                                                           v
1 INTRODUCTION
The Lake Tahoe West Restoration Partnership (Lake Tahoe West) is a multi-stakeholder collaborative
initiative convened by California Tahoe Conservancy, USDA Forest Service Lake Tahoe Basin
Management Unit, California State Parks, Tahoe Regional Planning Agency, Tahoe Fire and Fuels Team,
and the National Forest Foundation. The goal of Lake Tahoe West is to restore the resilience of the west
shore's forests, watersheds, recreational opportunities, and communities to disturbances including
wildfire, drought, and climate change. The planning area includes approximately 59,000 acres of federal,
state, local, and private lands. The USDA Forest Service Pacific Southwest Research Station was engaged
to convene and lead a large team of researchers from Forest Service research stations and several
university research institutions to evaluate potential effects of different management strategies on
important objectives identified by the collaborative. This Science Team worked closely with an
Interagency Design Team comprising agency managers and technical experts and with two Stakeholder
Committees representing conservation, fire protection, recreation, homeowners and businesses, and
local government.
Through this collaboration, the Lake Tahoe West Science Team undertook an ambitious effort to
evaluate the effects of alternative forest management strategies for the Lake Tahoe West study area
(Figure 1-1). The effort focused on modeling with some supplemental field data collection. The modeling
evaluated forest development, succession, and disturbances (mortality caused by fire and bark beetles)
under scenarios that represented various management strategies, all under a projection of moderate
changes in climate. Under a second round of landscape modeling, multiple potential future climates
were evaluated.
1-1Figure 1-1—Map of Lake Tahoe West study area.
1-2Additional modeling and monitoring efforts addressed finer-scale issues, such as how removing individual trees up to specific sizes affected both fire behavior and water yield/snowpack, as well as resulting forest structure (including gaps between trees that help to sustain shade-intolerant species such as aspen). This additional modeling evaluated the effects of removing individual trees on snow dynamics and fire behavior using very fine scale data (
Scenario inputs from
        collaborative process        Climate                                    Management
                                    Projections                                  Scenarios
        Outputs from
        LANDIS models
        Outputs from non-                             Forest
        LANDIS models                               Landscape
                                                   Dynamics Over
             Smoke Emissions                         100 Years
                                                    Fire   Insects             Water Quality

                                                                           Integration of
                                                                           WEPP and
                        Economics
                                                                           LANDIS
                                                                           results
  Evaluation
   Criteria                                                          Wildlife
                                                                     • Multi-species biodiversity
                                                                     • 3 old forest predators
                                Decision Support

Figure 1-2—Topics of modeling, tools used to evaluate them, and interconnections. Inputs from the
Interagency Design Team and stakeholders guided the assumptions used to represent management
scenarios and the indicators used for evaluating scenario performance.

The list of topics and indicators addressed in the research were developed through dialogue among
agency staff, scientists, and stakeholders to identify key questions and concerns, and to identify topics
that could be adequately represented through landscape modeling. Some topics, such as the quality or
quantity of recreational opportunities, are important to some stakeholders, but there were not
sufficient data from which to build predictive models. In some of these cases, the team relied on proxy
variables that related to the topics of interest, such as summertime daily emissions of particulate
matter, which is a primary limitation for summertime outdoor recreation.

Previous modeling efforts in the Lake Tahoe basin and Sierra Nevada have tended to focus on
vegetation, fires, wildlife habitat, and carbon; but our approach incorporated many more resource topic
areas, such as water quality, water quantity, air quality, cultural values, wildlife habitat, and economic
costs and benefits. Specific elements of the modeling approach that were distinctive include:

    •      The modeling considered a range of management approaches including hand and mechanical
           thinning, wildfire suppression, prescribed burns, and lightning-ignited wildfires to achieve
           resource objectives.
    •      The core landscape modeling evaluated interactive dynamics over a century to consider climate
           change, the effects of infrequent but impactful disturbances (wildfire and insect-related

                                                     1-4
mortality), and management regimes. Evaluating how the system responds over time helps to
evaluate resilience directly, rather than relying on measures of vulnerability as an indicator of .
• The modeling effort also used the Ecosystem Management and Decision Support (EMDS) Tool in
a novel way, by evaluating performance of management scenarios over time. This tool
compared various indicators to threshold values associated with resilient and non-resilient
conditions, and aggregated the results based upon weights suggested by managers and
stakeholders.
• Habitat modeling considered not only a range of socially and ecologically important vegetation
measures (e.g., area of late seral forest), but a vast array of wildlife species, including old forest
associated species of special concern (marten, California spotted owl, northern goshawk),
species that have special cultural significance to the Washoe Tribe (e.g., deer), and groups of
terrestrial wildlife that have similar functional roles (e.g., decomposers, herbivores, insectivores,
predators, seed dispersers, and soil aerators).
1.3 CLIMATE SCENARIOS
The landscape modeling accounted for continued climate change based upon projections associated
with different global scenarios for greenhouse gas emissions, described as representative concentration
pathways (RCPs), and different global circulation models (GCMs). RCP 4.5 describes a scenario in which
greenhouse gas emissions level off by mid-century and then decline, while those emissions continue to
rapidly increase under RCP 8.5. Debate about which trajectory is currently more likely are ongoing, with
Schwalm et al. (2020) reporting that emissions have continued to follow the high (RCP 8.5) trajectory,
while Hausfather and Peters (2020) contend that the trajectory is much more likely to bend toward an
intermediate level of emissions (close to RCP 6.0). Running models under a wider range of climate
scenarios helps to understand the extent to which the relative or absolute performance of management
scenarios is tied to particular climate trends. The initial round of modeling considered a single climate
projection, the CanESM GCM with a moderate level of emissions, represented by the RCP 4.5 emissions
pathway. The second round considered eight different projections based upon four different GCMs and
two RCPs (Table 1-1), which were the same projections used in California’s 4th Climate Adaptation Plan
(Westerling 2018). These climate models had been selected to realistically represent variability for
California in selected hydrologic variables. For example, CanESM2 was warmer with little precipitation
change from contemporary; CNRM was cooler and wetter than the others; MIROC5 was warmer but
drier; and HadGEM had moderate increases in summertime temperatures, little change in yearly
precipitation, larger increases in wintertime temperatures, and slightly higher frequency of drought
conditions than CNRM but less than the other two.
Table 1-1—Summary of landscape scenarios modeled over 10 decadal time steps (2010-2109) per
management scenario in LANDIS.
Scenario Round 1 Round 2
Climate GCMs 1 (CanESM2) 4 (CanESM2, CNRM5, HadGEM2-ES, MIROC5)
RCPs 1 (RCP 4.5) 2 (RCP 4.5 and RCP 8.5)
Replicates within Climate 10 3
Total Model Runs 40 120
1-51.4 MANAGEMENT SCENARIOS
The management strategies and criteria for evaluating performance vary across four different
geographic zones within Lake Tahoe West, each of which represents about one quarter of the total area
(Figure 1-3). The Wildland-Urban-Interface (WUI) is a zone of transition between unoccupied area/
“wildland” and urban/occupied/developed areas.
1. WUI defense zone: the part of the WUI that is closest to communities.
2. WUI threat zone: the part of the WUI that is farther from communities.
3. General forest zone (13,675 acres): area outside the WUI that is removed from communities.
4. Wilderness (13,257 acres): land managed strictly for wilderness values.
Figure 1-3—Management zones within Lake Tahoe West.
Through landscape-scale modeling we quantified expected effects of several contrasting management
strategies, which are listed below and shown in Figure 1-4. The scenarios were developed through a
collaborative process, led by the Interagency Design Team in articulating goals and targets with input
from the Stakeholder Committees. The Science Team set assumptions based upon guidance from the
Interagency Design Team. We initially processed results for four scenarios, and then we added the fifth
scenario after reviewing the initial results. The scenarios were intended to represent strongly
contrasting management approaches (“pin-the-corner”) rather than to precisely emulate a specific
alternative.
• Scenario 1—Suppression only: No treatment other than continued fire suppression.
1-6• Scenario 2—WUI-focused: A WUI-focused strategy similar to recent management, although it
assumes no prescribed understory burning. This scenario includes hand and mechanical
treatments in the WUI. Thinning treatments could recur after 20 years.
• Scenario 3—Increased thinning: A strategy of increasing pace and scale of vegetation thinning
treatments, including hand and mechanical treatments in the WUI and the general forest, with
some hand treatments occurring in the wilderness as well. Thinning treatments could recur after
11 years following thinning or burning.
• Scenario 4—Fire-focused: A fire-focused strategy that focused on using fire by combining
modest WUI thinning with prescribed burning in all zones and managed, lightning-ignited
wildfires managed for resource objectives in the general forest and wilderness. Thinning
treatments could recur after 11 years without thinning or burning; prescribed burns did not
have a set retreatment interval. Scenario 4 averaged 550 acres of prescribed burning per year,
plus an average of 100 acres per year of managed natural ignitions for resource objectives,
within Lake Tahoe West.
• Scenario 5—Fire-focused, expanded: A fire-focused strategy combining the modest WUI-focused
thinning under scenario 4 with much greater use of prescribed burning in all zones, averaging
2600 acres per year in Lake Tahoe West, in addition to an average of 100 acres per year of
managed wildfires.
The expanded thinning (scenario 3) and the fire-focused scenarios (scenario 4 or 5) are reflected in the
Lake Tahoe West Landscape Restoration Strategy. Expected levels of thinning and prescribed burning
under that Strategy fall in between those in scenarios 3, 4, and 5.
Amount of Management Scenarios
Active
1) Suppression-Only: No land
Treatment
management actions except fire
suppression in all management zones.
None
2) Wildland Urban Interface (WUI):
Forest thinning in the WUI only 4) Fire-Focused (moderate prescribed
(most like recent treatment). burning): Modest forest thinning in the WUI,
~1000 acres
moderate levels of prescribed fire, and some
annually
wildfire managed for resource objectives
outside of the WUI.
3) Thinning-Focused: High levels
of forest thinning in the WUI, 5) Fire-Focused (high prescribed burning):
general forest, and wilderness. Modest forest thinning in the WUI, high levels of
~4000 acres prescribed fire, and some wildfire managed for
annually resource objectives outside of the WUI.
Figure 1-4—Overview of management scenarios used in the landscape modeling
1-7In addition to broadening climate change projections, the second round of modeling updated some
assumptions regarding treatment effects and species dynamics, both to better reflect the original
Interagency Design Team intent for scenarios (such as the frequency of retreatment and amount of dead
biomass removed) and to incorporate adjustments to more precisely represent certain system
dynamics, including climatic triggers for insects outbreaks, species’ relationships to temperature, and
maximum stand biomass.
1.4.1 Variation in treatment across scenarios
For the landscape modeling, the amount of area thinned under different management scenarios was set
to targets for different management zones. However, the amount of area treated with prescribed fire
and natural ignitions managed for resource objectives reflected iterative results from the LANDIS model
to approximate targets suggested by the Interagency Design Team to achieve treatment objectives
based upon a reference disturbance interval. Figure 1-5 shows the area treated under different
management strategies per year. Scenarios 2, 4, and 5 confined thinning to the WUI zones, while
scenario 3 thinned in the general forest and the wilderness zone.
Figure 1-5—Percent of landscape treated under different scenarios.
1.4.2 Projected treatment intervals
Actual return intervals were slightly longer than the minimums described above, but they were still
within reference levels for disturbance. The most typical (modal) return intervals for thinning treatments
were 26 years under scenario 2, 12 years under scenario 3, 15 years under scenario 4, and 17 years
1-8under scenario 5. Increased prescribed burning reduced the frequency of thinning slightly because
recently burned areas were considered sufficiently treated as to be ineligible for thinning.
Scenario 4 simulated prescribed burning only in the fall (mid-October to mid-November) and limited
burns to 100 acres/day. To facilitate the increase in prescribed burning compared to scenario 4, scenario
5 also allowed prescribed burning whenever fire weather conditions were suitable, resulting in burns
during any of the seasons. In scenario 5, the area burned in a day was expanded to about 180 acres/day.
These burns were concentrated in the spring and fall, but some occurred throughout the year as
weather permitted.
1.5 INDICATORS AND TARGET CONDITIONS
A set of indicators with associated target conditions were used to evaluate scenario performance based
upon priorities and thresholds developed through collaboration among the Interagency Design Team,
Stakeholder Committees, and Science Team members (Table 1-2). The science modeling included a
diverse range of indicators that build upon topics featured in the Lake Tahoe West Landscape Resilience
Assessment and identified as important to stakeholders. Several of the indicators modeled by the
Science Team relate closely to indicators used in the Landscape Resilience Assessment, and the
modeling added many indicators for topics like biodiversity and upland health. It also included indicators
for which historical temporal data were not already compiled for Lake Tahoe West, such as all areas
burned by severity, forest landscape water quality, air quality, and management costs. Most of the
indicators were included as input to the Ecosystem Management Decision Support (EMDS) analysis,
which evaluated scenario performance across all indicators based on ecological objectives and
stakeholder priorities. Targets for favorable conditions were set based upon dialogue between members
of the Science Team and the Interagency Design Team. The Landscape Restoration Strategy discusses
the indicators and considered the results in refining goals and guiding implementation.
1-9Table 1-2—Indicators used in the landscape modeling, sorted by topic, and with relationships to the
Landscape Resilience Assessment (LRA), Landscape Restoration Strategy (LRS), and decision support
analysis (EMDS).
LRA Discussed Evaluated
Category Sub-category Indicators
Indicator in LRS in EMDS
WUI fire risk Percent of WUI threat and defense zones
burned at moderate and high severity
Threats to # of residential properties in areas likely to
property burn at moderate or high severity
Fine particle (PM2.5) emissions
Air quality Days of moderate, high, very high, and
Community Values
extreme emissions (based upon
tonnes/day), year-round
Recreation Days of moderate, high, very high, and
quality extreme emissions (based upon
tonnes/day), summertime
Cultural Area burned at low-severity fire; % of
resource quality landscape dominated by aspen; and high-
quality habitat for mountain quail, flicker,
deer
Carbon storage Whole-system carbon storage
Restoration by- Volume of lumber and bioenergy material
products harvested
Percent of landscape burned by wildfire at
different severities
Functional fire Area burned in large high severity patches
size
Fire return interval
Percent of forest in different seral stages
Upland (early, mid, late)
Environmental Quality
vegetation Percent of shrub, aspen, and conifers (and
health relative abundance among tree species)
Area with old trees (>150 years)
Species richness (terrestrial wildlife)
Habitat quality for wildlife functional
Wildlife
conservation groups (e.g., insectivores)
Territories for California spotted owl,
marten, and northern goshawk
Very fine sediment (2 KEY FINDINGS
2.1 LANDSCAPE FIRE
Many dimensions of fire regimes are important; in this section we focus on cumulative area burned
overall and at different severities, area burned in uncharacteristically large high severity patches, areas
burned within the WUI areas, and fire return intervals. The Lake Tahoe West Landscape Restoration
Strategy focused on reducing the risk of high severity wildfire, particularly in WUI areas and in patches
larger than 40 acres. The latter could indicate a loss of resilience, since such patches tend to be rare
under reference fire regimes (Safford and Stevens 2017). Mean fire return interval departure condition
class was suggested in the Lake Tahoe West Landscape Resilience Assessment as an indicator of
ecological resilience, and the Landscape Restoration Strategy calls for prescribed burning to restore a
more frequent fire return interval, particularly in lower elevation forests that have a more departed fire
regime. The results include multiple metrics for fire outcomes for the overall landscape, within the WUI
defense zone (e.g., surrounding inhabited areas and critical infrastructure) and within the WUI threat
zone, which lies between the defense zone and general forest zone.
2.1.1 Area burned
LANDIS simulations projected increases in area burned by wildland fire in Lake Tahoe West over time.
Within the first decade, projected area burned was over 5% across scenarios 1, 2, and 3, and reached 6%
and 7% per decade in the fire-focused scenarios 4 and 5, respectively. A warming climate drove an
approximate doubling in area burned across all scenarios, reaching levels of about 13% per decade by
the end of the century. Snowpack is expected to decline over time, which will translate to longer fire
seasons and greater opportunity for fire spread. This projected increase is generally consistent with
projections by Westerling et al. (2011) that area burned would double in montane forests of Northern
California from the late 20th century to late 21st century. For comparison, between 1984 and 2010,
yellow pine-mixed conifer and red fir forest types with national forests in the Sierra Nevada region
experienced approximately 3.7% area burned per decade in fires greater than 200 acres (Miller and
Safford 2012). In the most recent decade, those levels have likely increased. However, area burned by
wildfire in Lake Tahoe West and the Lake Tahoe basin has been modest by comparison. Records in the
California Fire and Resource Assessment Program database indicate that the annual average of area
burned by wildfire within the basin from 1994-2016 was only about 200 acres, which translates to
approximately 1% per decade. The basin’s relatively high elevation and precipitation reduce the
expected level of wildfire compared to the larger region (and relatively fast response times to wildfires
may also contribute to more effective suppression). LANDIS modeling for Lake Tahoe West projected
higher total amounts of burned area in Lake Tahoe West in the first decade (2010-2019) than what
actually occurred (in the Emerald Fire of 2016).
Although the modeling projected increases in area burned compared to recent decades, the total area
burned remained well below historical reference levels under all scenarios. For reference, the natural
range of variation for a reference fire regime in yellow pine/mixed-conifer forests of northern California
is about 50% per decade, or 5% per year (Safford and Stevens 2017). The fire-focused scenarios shifted
more towards a historical reference through increases in prescribed burning.
2-2The modeling also indicated that increased prescribed burning would reduce areas burned by wildfire.
While scenario 1 was projected to have the lowest amount of burned area in the first decade, it
experienced the most burned area late in the century, all of which was burned in wildfires. By contrast,
scenario 5, which heavily used prescribed fire, burned the most area in the first decade, but resulted in
the least total area burned in some later decades throughout the century.
2.1.2 Amount of landscape burned at low, moderate, and high severities
Increased treatments moderated the severity of fire overall, specifically by increasing the amount of low
severity fire (especially under the fire-focused scenarios that used prescribed burning) and reducing the
amount of high severity fire. The fire-focused scenarios 4 and 5 greatly increased area burned at low
severity through application of prescribed burns (which were assumed to burn only at low severity).
Relative to the natural range of variation for low severity burn area, scenario 4 resulted in about 20% of
area per decade, while scenario 5 resulted in about 50% of area per decade. In contrast, all areas
burned under scenarios 1, 2, and 3 were the result of wildfire. Those first three scenarios, which did not
use prescribed fire, resulted in much less low severity fire than the historical references. However,
scenario 3 resulted in more low severity fire than scenarios 1 and 2, which indicates that treatments did
moderate wildfire severity.
In terms of area burned at moderate severity, most scenarios performed similarly, keeping totals below
5% per decade until the end of the century. That amount of moderate severity fire was generally below
the levels (8-19% per decade) that would be expected under a more natural historical fire regime.
Moderate severity generally represents a gray area between low and high, which may make it difficult to
consistently model and interpret (for example, the Landscape Resilience Assessment categorized flame
lengths greater than six feet as indicative of high severity, while the fire modeling in LANDIS associated
moderate intensity with flame lengths between four and eight feet). As the distribution of fire severities
shifted under different scenarios, the amount classified as moderate remained relatively stable, while
the amount classified as low or high tended to change.
The amount of high severity fire was highest under the suppression-only scenario 1 and roughly declined
with more area treated under the other scenarios. This result is consistent with research explaining how
fire suppression tends to shunt fire effects into more extreme conditions, while treatments, including
thinning and use of fire, moderate fire severity (Safford et al. 2009, Safford and Stevens 2017, Steel et al.
2018). Scenarios 3 and 5 reduced the amount of high severity fire overall, although scenario 3 kept
levels low throughout the century, while scenario 5 performed better in early decades but not as well
later in the century.
2.1.3 Amount of landscape burned in large high severity patches
Increasing treatment affected the amount of area burned in large (>40 acre) high severity patches
similarly to how it altered high severity fire overall. Scenario 1 resulted in the most area in such patches,
scenario 2 had the second most, and scenario 4 had the third most. Scenario 3 kept the number of such
patches low over a century, while scenario 5 started off with the fewest patches, although such patches
increased over time. These results suggest that treatments delay the occurrence of severe fires, but that
eventually climatic factors may allow more severe burns to occur. Scenario 3 may have been more
effective in reducing severe fires than scenario 5 because those thinning treatments explicitly targeted
areas with ladder fuels, which were a key determinant of fire severity (unlike the simulated prescribed
burns).
2-3Previous work has reported that large patches often make up a substantial proportion of area burned at
high severity even in areas with more natural fire regime. For example, in the Illilouette basin, such
patches represented 64% of area burned at high severity between 2000 and 2009 (Collins et al. 2009).
2.1.4 Fire return interval
By increasing the amount of fire overall, fire-focused scenarios 4 and 5 greatly lowered the fire return
interval, which is consistent with restoration of a more natural fire regime. Those restorative effects
were most pronounced in the lower-elevation forests that are most departed from historical
frequencies of fire.
2.1.5 Percent of WUI zones burned at high and moderate severity
The results indicate that increasing treatments were effective in reducing fire severity in community
areas. None of the scenarios eliminated all wildfires in this zone. Within the WUI defense zone in Lake
Tahoe West, increasing treatment reduced the area burned at high severity, while area burned at
moderate severity was similar across the scenarios. The suppression-only scenario 1 performed worst
(averaging 5.7% high severity and 7.4% moderate severity per decade), indicating that a lack of
treatment would not support community resilience objectives. The WUI-focused scenario 2 performed
second worst (averaging 3.9% high severity and 8.4% moderate severity per decade), indicating that a
business-as-usual strategy also would not sufficiently promote resilience. Scenario 4 was somewhat
better (averaging 3.2% high severity and 8.0% moderate severity per decade), scenario 3 was much
better (averaging 1.9% high severity and 8.1% moderate severity per decade), and scenario 5 performed
best (averaging 1.1% per decade high severity and 8.3% moderate severity per decade).
For a recent reference, consider that about 1.8% of the 70,000-acre (28,000 ha) WUI defense zone in the
Lake Tahoe basin burned at high severity from 2000-2009 during the Gondola and Angora fires;
however, those fires did not burn any areas in Lake Tahoe West.
Patterns in area burned at high and moderate severity within the WUI threat zone were quite similar,
although the amount burned was generally lower, reflecting that ignitions are highest within the WUI
defense zone. Treatments also reduced incidence of high severity fire in this zone, although the
differences in performance between management scenarios were much less pronounced than in the
WUI defense zone. The scenarios that involved the least treatment performed worse in terms of high
severity than the others (scenario 1 averaged 3.4% high severity and 4.0% moderate severity per
decade, while scenario 2 averaged 3.4% high severity and 4.4% moderate severity per decade). Scenario
4 was somewhat better (averaging 2.5% high severity and 3.5% moderate severity per decade), scenario
3 was even better (averaging 2.2% high severity and 4.3% moderate severity per decade), and scenario 5
performed best (averaging 1.5% per decade high severity and 4.4% moderate severity per decade).
The overall results suggest that scenarios 1 and 2 are not likely to sustain resilient conditions in terms of
WUI high severity fire risk, so increases in treatment, as outlined in the Landscape Resilience Strategy
and as reflected in results for scenarios 3, 4, and 5, are supported by these findings for these indicators.
2.1.6 Sensitivity of fire dynamics to climate
When a wider range of climate projections was evaluated in the modeling, fire outcomes did change,
however, the relative performance of different management scenarios compared did not. Under all
climate change projections, temperatures increased, and the increases were larger under the RCP 8.5
pathways. However, precipitation was far more variable by projection. Notably, the CanESM with RCP
2-48.5 projection resulted in more summertime precipitation than others, which moderated wildfire
activity. In contrast, the MIROC5 4.5 and 8.5 climate projections result in more extended droughts,
which intensified wildfire activity. Averaging across the climate projections, higher emissions were
projected to increase fire activity, and area burned at high severity fire both directly due to more
extreme fire weather and indirectly due to increased insect activity in the latter half of the century.
There remains substantial uncertainty regarding how climate change will be expressed, but treatments
were projected to remain effective in moderating wildfire activity across climate scenarios.
2.1.7 Implications
Alternatives based upon no-treatment or business-as-usual approaches would not be as effective in
promoting desirable fire effects as increased treatment, both thinning and prescribed burning.
Therefore, the Landscape Restoration Strategy, by calling for increased treatment in ways that are
comparable to scenarios 3, 4, and 5, is expected to promote resilience, particularly by reducing high
severity fire in WUI areas and in large patches. Greatly increasing the amount of prescribed burning, as
under scenario 5, is expected to reduce undesirable effects of high severity fire, while promoting more
desirable effects of low severity fire. On the other hand, a suppression-only approach would tend to
allow the high severity effects of wildfire while limiting the beneficial effects of low and moderate
severity fire. The indicator value of moderate severity fire is complex to evaluate, since for much of the
landscape it may be effective in restoring forest structure (Kane et al. 2019). In community areas,
moderate severity fire is preferable to high severity fire, but it may still signify a risk to property and
safety. The Landscape Restoration Strategy considered burning at more moderate severity to more
closely approximate effects of reference fire regimes. Recent research by Striplin et al. (2020) suggested
that greater use of fire may depend on relaxing burn prescriptions to allow for moderate severity.
The results also suggested that increased treatment under scenarios 3, 4, and 5 would perform better in
the near term decades than would scenarios 1 and 2. Uncertainty of course increases with time, but the
modeling indicates that late in the century, treatment scenarios will be less able to maintain favorable
conditions as climate drivers intensify disturbance regimes. The results indicate that treatments are
likely to moderate and forestall high severity fire rather than eliminate it. However, unlike in our
modeled scenarios, managers can also adapt their strategies to conditions to achieve more favorable
outcomes. For example, they could ramp up or scale down treatments in response to climatic and fuel
conditions, which drive fire regimes.
2.2 FOREST STRUCTURE AND COMPOSITION
2.2.1 Dominant vegetation types
Management scenarios were evaluated based upon the percentage of landscape area dominated by
conifers, hardwoods, and shrubs (based upon relative biomass in each type of vegetation). Favorable
conditions for conifer ranged between 70-86%, with the most favorable condition being the starting
value of 78%. Favorable conditions for shrub-dominated ranged between 18-23%, with 21% being most
favorable. Hardwood was represented only by aspen, with an optimal value of 1%. These criteria were
based upon an assumption that shifting much of the landscape to dominance by either conifers or
shrubs would not be resilient. However, previous research found that the area of chaparral stands
declined by an average of 62.4% from historical reference levels within the western part of the Lake
Tahoe basin (Nagel and Taylor 2005). Therefore, it may be important to reconsider whether recent
2-5levels of forested area are most favorable, or instead, whether some increase in shrub-dominated areas
might be restorative.
The modeling results indicated that the scenarios would generally maintain conifer forest within a range
close to recent conditions. However, under scenarios 1-4, conifer forest tended to increase (exceeding
~86% by 2070), while scenario 5 maintained conifer-dominated areas in a range between 70-75%. These
numerical values may differ from more detailed assessments based upon remote sensing, but the trends
are still useful to consider when considering forest resilience.
The projected increase in forest contrasts with the expectations that conifer forests will be replaced by
shrubs and hardwoods within much of the Sierra Nevada and California overall, since increases in high
severity fire and warming conditions may limit conifer regeneration especially in drier, lower elevation
areas (Lenihan et al. 2008, McIntyre et al. 2015, Steel et al. 2018). Compared to such areas, Lake Tahoe
West is less vulnerable to forest loss because it is comparatively wet and at a high elevation. A recent
field study discussed later in this report (Low et al. 2021) supports the relative resistance of Lake Tahoe
West forests, as they found that trees maintained growth despite a severe statewide drought that
caused significant mortality in other areas.
2.2.2 Trends in forest species composition
Objectives for forest restoration in Lake Tahoe West include promoting the abundance of shade-
intolerant and fire-dependent species such as Jeffrey pine, sugar pine, western white pine, whitebark
pine and aspen. The landscape modeling evaluated abundance of these species in terms of their
proportion of overall biomass. These species were suggested as priorities because previous research
found that these species have been declining in recent decades as fire suppression, historical timber
harvest, and the white pine blister rust pathogen have favored shade-tolerant and fire-intolerant species
such as white fir, incense cedar, and lodgepole pine (Dolanc et al. 2014, Harris et al. 2019, Taylor 1990).
The modeling results projected that most of these historical trends would generally continue unless
treatments were increased, particularly under scenarios 3 and 5. For example, white fir increased in
scenarios 1, 2, and 4 (which treated fewer acres), was relatively constant under scenario 3, and declined
under scenario 5. Furthermore, yellow pine generally declined across scenarios except under scenario 5.
On the other hand, the modeling projected that lodgepole pine would decrease, with the largest
decrease under scenario 5. That particular result is consistent with the expectations that reintroduction
of fire would reduce that species (Taylor 1990).
White pines, notably western white pine, increased in relative abundance across management
scenarios, as future climate appeared relatively favorable for that species. Previous climate modeling
(Richardson et al. 2010) had suggested that western white pine would encounter relatively stable
conditions within high elevation areas in the Sierra Nevada of California, while projecting increases at
higher latitudes within the interior northwestern United States. Projections for white pine blister rust
are complicated by uncertainties associated with the blister rust disease and the effects of planting
resistant strains.
Red fir was projected to decline in the modeling, including in runs when a broad range of climate
projections were considered. Red fir is relatively intolerant of drought, and the modeling indicated that
red fir would experience both increased mortality and reduced regeneration. Forest monitoring in
California has reported that mortality in red fir has been increasing due to climate change, but that the
2-6populations have been stable overall (Mortenson et al. 2015). However, a recent review reported that
several climate studies have projected large percent range reductions in red fir dominated in California
by the end of the 21st century (Meyer and North 2019). Additional research in the Sierra Nevada has
indicated that red fir populations have been stable recently, but they are vulnerable to further climate
change (Nelson et al. 2020).
Aspen as a percentage of biomass tended to increase across scenarios, although its overall biomass
remained low. Higher levels of treatment (especially increases in prescribed burning) were associated
with larger relative increases in aspen biomass and in total landscape area where aspen was dominant.
Scenario 5 best achieved favorable conditions for aspen, as extensive prescribed burning under that
scenario may have reduced competition from conifer trees. A review of aspen in the Sierra Nevada by
Shepperd et al. (2006) was consistent within this finding, as they suggested that increases in fire activity
could support aspen expansion, although they cautioned that there was substantial uncertainty
regarding aspen trends.
2.2.3 Seral Stage
Much of the Lake Tahoe Basin, including Lake Tahoe West, is currently dominated by mid-seral forest,
which reflects a historical legacy of early logging that reduced old trees, combined with fire suppression
that has facilitated dense regrowth of younger trees. Managers identified an objective of increasing the
abundance of late seral forest. Late seral forest is particularly important as habitat for three forest
predators (marten, California spotted owl, and northern goshawk) of special concern in the basin, as
well as overall biodiversity and carbon sequestration. Early seral conditions are also important for
biodiversity, especially “complex early seral forest” that retains snags and other dead wood following
disturbance such as stand-replacing wildfire. Only areas classified as “forest”, not shrub-dominated
areas, were included in these seral stage measures. The evaluation of seral stage was based upon the
relative amounts of biomass in different age classes.
Modeling results indicated that under all scenarios, the proportion of conifer forest in late seral
conditions would dramatically increase over the next century. This trend held for both lower montane
forest (yellow pine and mixed conifer) and high elevation forest types (red fir, lodgepole pine, western
white pine, and subalpine white pine). The increase was greater in the lower elevations where late seral
is currently more limited. Both mid-seral and early seral forest generally decreased over time. Increased
treatment accelerated the shift toward late seral conditions.
In the lower montane areas, 35% late seral was suggested as a lower threshold for most favorable
conditions. Scenario 5 reached 40% by 2030 and then gradually increased to 49% by 2110. Scenario 3
increased to 33% by 2040, largely plateaued at that amount for the next four decades, and then
increased again to nearly 47% by 2110. Scenario 4 reached 35% by about 2080, while scenarios 2 and 1
reached the 35% threshold 10 and 20 years later, respectively.
The trends in higher elevation forest were somewhat different, in that scenario 5 still accelerated a shift
toward late seral compared to the other scenarios, but it did not continue to increase late seral as much
as the others did in the later part of the century. Instead, early seral increased under scenario 5 in high
elevation forest areas, presumably as fire activity reduced biomass in those areas.
Manager guidance indicated an objective of relatively low amounts of early seral forest in lower
elevations, with most favorable conditions set between 7-18%. Across all five modeled scenarios, early
2-7You can also read