Water Management Plan 2017-2021 - Gov.je
←
→
Page content transcription
If your browser does not render page correctly, please read the page content below
Water Management Plan 2017-2021

November 2016

Published by:

States of Jersey
Department of the Environment
Howard Davis Farm
La Route de la Trinité
Trinity, JE3 5JP
Email: K.Roberts@gov.je
(c) States of Jersey

                                  1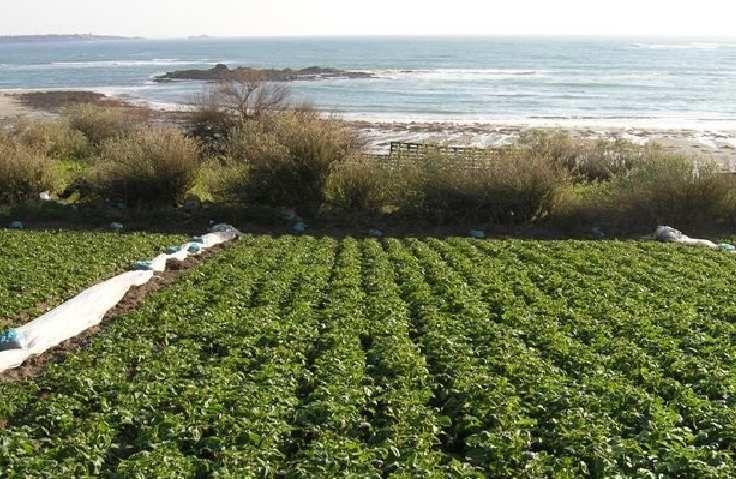
Document history

 Job number: 5127044                         Document ref: 5127044 / 70 / DG / 031
 Revision Purpose description   Originated   Checked         Reviewed     Authorised Date
 V9       Draft WMP             K Roberts                                            08/03/2016
 V11      Final Draft WMP       C Neale      MB              DR           DR         05/04/2016
 V16      Final draft           K Roberts                                            23/06/2016
 V17      Final for approval    K Roberts                                            30/11/2016

Authors
Kate Roberts on behalf of Department of the Environment, States of Jersey
Claire Neale on behalf of Atkins Ltd

                                                                                          2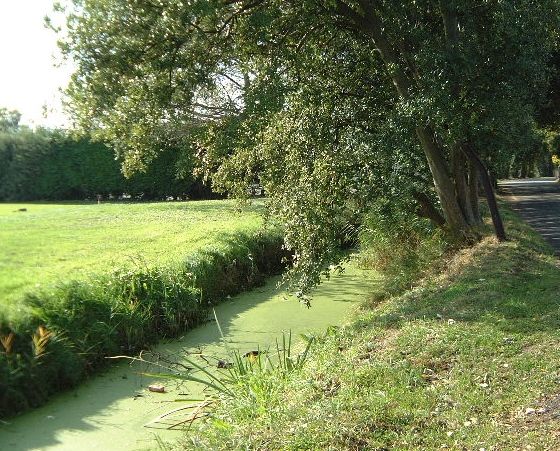
Ministers’ Foreword
A healthy, good quality water environment is vital for the health and well-being of all those who
live on the Island, as well as its visitors. We should, indeed must, have good quality water
resources in the Island.

A clean and adequate supply of water is essential for our economy – water is used in direct
consumption, for agriculture, for fisheries, for aquaculture and for many other uses. It is also
socially, culturally and recreationally important. The shoreline, cliff paths, valleys and reservoir
walks: these environments are rich in both wildlife and cultural meaning. Fishing, sailing and
other water-dependent activities are of great importance to locals and visitors alike.

A natural system supports all of this. We need to ensure that the Island’s ecological quality and
biodiversity is maintained and enhanced, firstly for its own sake and also because it underpins
the social and economic benefits that we derive from it.

The work that my officers and I have undertaken for this plan, to analyse evidence and gather
new information, shows that that the quality of the Island’s water environment is improving,
but there is a lot still to be done, particularly in respect of levels of nutrients and pesticides. The
quality of our water environment is not good enough. This Water Management Plan sets out
actions that need to be taken over the next five years in order to improve the status of the water
environment.

Over 4000 islanders responded to the recent ‘Shaping our Future’ public consultation. Over half
of Islanders had the highest possible aspiration for clean and sustainable water - few other
outcomes scored as highly. Although current progress was rated positively, scores indicated
that Islanders believe that there is a significant gap to close to meet this future aspiration.
Sustainable, healthy water is a shared aspiration.

I firmly believe that using an evidence based and integrated water management approach in
Jersey is key to safeguarding the resource for the future. The implementation of this first five
year Water Management Plan for Jersey will help us to achieve our aspirations in respect of
sustainable and healthy water.

As Minister for the Environment I am pleased to present the Water Management Plan 2017-
2021.

                                                                                                      3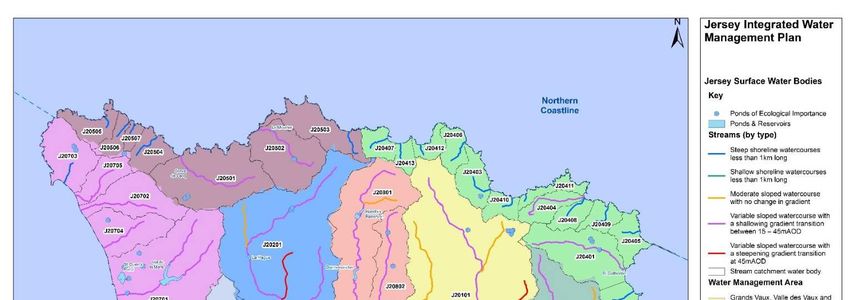
Table of contents
Structure of this document .............................................................................................................................. 5

1.     Executive Summary .................................................................................................................................. 6
     1.1      What is the Water Management Plan (WMP)?                                                                                                          6
     1.2      The condition of our water environment                                                                                                            7
     1.3      What are we trying to achieve through the WMP?                                                                                                    8
     1.4      How do we make progress towards the objectives?                                                                                                   9
     1.5      How costs will be shared                                                                                                                         11
     1.6      What are the next steps and how will we judge success?                                                                                           12

2.     Introduction ........................................................................................................................................... 13
     2.1      Why do we need a Water Management Plan?                                                                                                          13
     2.2      Uses of water in Jersey                                                                                                                          14

3.     Preparation of this WMP........................................................................................................................ 17
     3.1      The underlying principles                                                                                                                        17
     3.2      What are the key changes compared with previous water management approaches?                                                                     18
     3.3      Planning cycle and terminology                                                                                                                   18

4.     Water management priorities for 2017-2021 ......................................................................................... 19
     4.1      Challenges for the Water Environment                                                                                                             19
     4.2      The Status of Jersey’s Water                                                                                                                     20
     4.3      The impact of nutrients and pesticides                                                                                                           23
     4.4      Priorities for 2017-2021                                                                                                                         30

5.     Objectives .............................................................................................................................................. 32
     5.1      Objectives for Jersey                                                                                                                            32

6.     A tool kit for the challenges ahead ......................................................................................................... 35
     6.1      Measures identification and selection                                                                                                            35
     6.2      Treatment - or solving the problem at source?                                                                                                    36
     6.3      What scenarios have we appraised?                                                                                                                39
     6.4      Assessing the effectiveness of the different scenarios                                                                                           43
     6.5      The relative costs of the scenarios to different sectors                                                                                         44
     6.6      Uses and impacts - shared benefits and shared costs?                                                                                             48

7.     Putting the Plan into Action ................................................................................................................... 53
     7.1      Our views on the preferred scenario                                                                                                              53
     7.2      Water Catchment Management Orders                                                                                                                54
     7.3      Measures within the preferred scenario                                                                                                           58
     7.4      Who will deliver these measures?                                                                                                                 62
     7.5      How will we know when the measures are working?                                                                                                  65

8.     Comments or questions?........................................................................................................................ 69

9.     References ............................................................................................................................................. 70

                                                                                                                                                                 4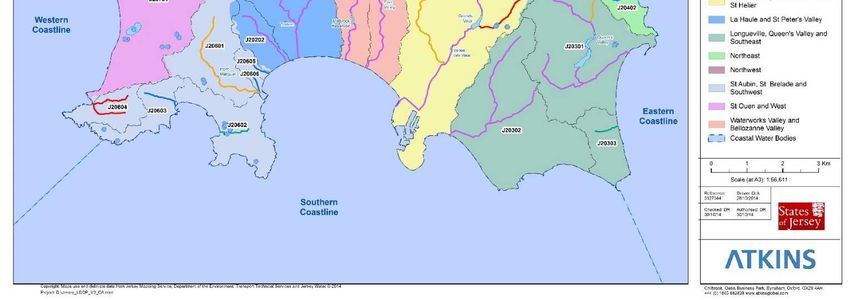
Foreword
Water is a precious resource, particularly on a densely populated island. Everyone has an
important part to play in safeguarding it for human use and protecting the important
habitats and species that depend on it.

In November 2014, the Department of the Environment published the report Challenges for
the Water Environment of Jersey, summarising the key water management issues facing the
Island. This ‘challenges’ document was the first step in the water management planning process
for Jersey; it set out the current status of the water environment and the key pressures acting
upon the resource.

This Water Management Plan (WMP) follows on, setting out the actions we need to take to help
ensure healthy water supplies and better environmental conditions on the Island into the
future. It will be implemented over five years between 2017 and 2021.

The Island needs to balance growing the economy with protecting and enhancing the
environment and keeping Jersey as a great place to live and work in 2016 and beyond. The
quality of our water environment is key to a sustainable future; currently, the status of the
water environment in Jersey has been shown to be lower than it should be. This has been
underlined again in recent months with the spotlight on pesticide issues.

Structure of this document
Firstly there is a brief overview of why we need a Water Management Plan, followed by a more
in depth exploration of the priority issues we propose to focus on in the first Water
Management Plan planning period, between 2017 and 2021.

Following this, we have explained how we have appraised a range of measures that could be
applied in Jersey, including consideration of how these could be delivered.

The measures recommended for implementation in this first WMP are then presented. This is
accompanied by a high level assessment of the implications of these measures on different users
of the water environment of Jersey and the wider benefits the Island can expect to see as a
result of the actions taken.

                                                                                                5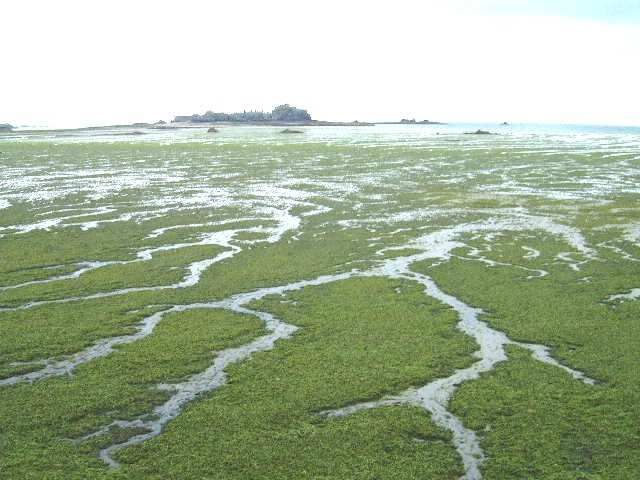
1. Executive Summary
Water resources, and the range of services they provide, underpin economic growth, healthy
communities and environmental sustainability.

Globally, water scarcity is among the most pressing issue to be faced in the 21st century.
Freshwater provides society with goods that are essential to human wellbeing: clean water,
food and energy. Freshwaters also provide other services that are less tangible but equally
important. For example, they enable recreation and provide cultural and spiritual inspiration
and meaning. All these benefits that freshwaters provide to humans are the so-called ‘water
ecosystem services’.

In the last century water use has been growing at more than twice the rate of population
increase. The World Economic Forum in its annual ‘Global Risks Report’ 2015 recently ranked
‘water crises’ as one of the top concerns in respect of likelihood of occurrence and gravity of
impact. Many of the ecosystem services provided by the environment are either undervalued or
have no recognised financial value at all. Recently it was estimated that for the entire biosphere
the minimum estimated value of the services provided (most of which is outside the market) is
thought to be in the range of $US 125-145 trillion per year1 which is almost twice the total
global gross domestic product.

Integrated water management planning is a key tool to manage water resources sustainably.
Key users and beneficiaries need to play their part in securing a healthy and usable water
environment into the future.

1.1 What is the Water Management Plan (WMP)?
Over the last 15-20 years Jersey, the States of Jersey, through the Water Resources Section, has
been working to protect the water environment in Jersey. The Section has developed a water
monitoring network2, introduced legislation to protect water and has implemented a number of
measures to tackle water pollution and manage the water resource. Ongoing monitoring shows
that the quality of the Island’s water is improving but there is a lot still to be done. We all need
to ensure that the water that we use, and the way in which we use it does not compromise its
use in the future. This plan brings together and further builds upon previous work by
considering carefully how we manage land to protect our waters.

This is the second report in a two part Plan; the first part identified the key water management
challenges in Jersey and assigned a status classification to all water bodies on the Island. The
main issues that were identified as affecting the health of our waters were the elevated levels of
nutrients (particularly nitrate), the risk of elevated levels of the nutrient phosphorus and the
risk of pesticide contamination (States of Jersey, 2014).

1Changes in the global value of ecosystem services, Costanza et al, Global Environmental Change Volume 26, May 2014 Pgs. 152-158.
2Monitoring is carried out on all ‘controlled waters’ including the Island’s fresh water (ground water and streams) and marine waters.
For more details please access https://www.gov.je/Environment/ProtectingEnvironment/Water/Pages/index.aspx

                                                                                                                                    6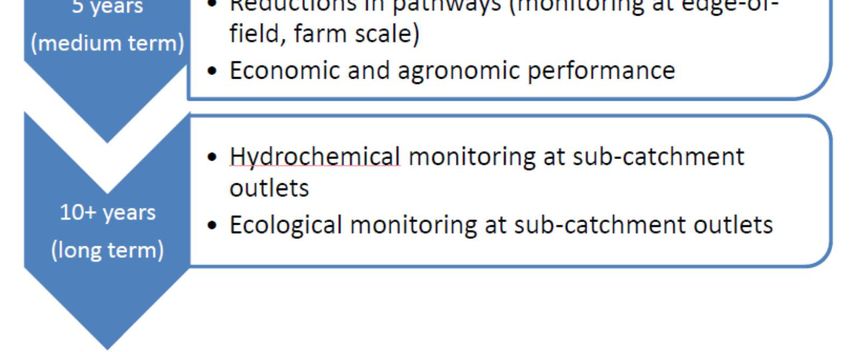
1.2 The condition of our water environment
The work undertaken through the first part of this process (Challenges for the Water
Environment of Jersey, States of Jersey, 2014) identified the primary water bodies in Jersey and
used existing data to classify them according to their current ecological health.

The status classifications are High, Good, Moderate, Poor and Bad, in line with categories used in
the EU. High status indicates that the relevant biological elements are undisturbed from natural
conditions. Good status indicates only a slight disturbance compared with the natural condition.
Moderate status indicates that the relevant biological elements are moderately changed from
natural conditions. Poor status indicates a progressively more disturbed quality status
compared with moderate. Bad status indicates that these components are shown to be severely
changed from the natural example as a result of human activities.

Currently, the majority of Jersey’s water bodies are at moderate status.

This is mostly driven by the elevated levels of nutrients found in both surface waters and
groundwater.

The overall long term target is to improve the environmental status of as many of our
water bodies as possible that are currently below the target level of good status.

Nutrient enrichment and pesticide contamination of our watercourses affects the
ecological health of our waters and also severely limits our ability to use freshwater for
drinking water purposes.

Jersey Water supplies about 7,000 Mega Litres3 of water to their business and domestic
customers per year, the vast majority of which comes from surface water streams via reservoirs
on the Island. In 2013 an estimated 2,162 Mega Litres4 was abstracted from groundwater in
Jersey for private supplies.

Jersey’s untreated water resources have some of the highest concentrations of nitrate in water
in the whole of Europe: approximately half of all samples taken from either surface or
groundwater contain more than 50 mg/l nitrate. This compares to about 3% of surface water
and 15% of groundwater samples exceeding 50 mg/l of nitrate in the countries of the EU5.

Because of the high levels of nitrate in our streams and groundwater Jersey Water cannot
guarantee to meet drinking water standards for nitrate in the mains drinking water supply at all
times. Consequently, the company has to take active measures to control the nitrate levels in
supply by careful blending and dilution. They also have to blend sources and remove sources
from supply periodically to make sure pesticide levels remain within legal limits. The Company
currently has a dispensation from the Minister for Environment for those occasions when
nitrate levels in water resources exceed manageable concentrations. Another concern is that
many of the 3,400 households on borehole/well water only have access to water that is higher
than the drinking water standard of 50 mg/l nitrate.

These issues are arising predominantly from “diffuse pollution” because no single point source
can be identified for them; contributions of nitrates, phosphorus and pesticides come from
across the Island’s agricultural and rural, and to a lesser extent urban, landscapes.

3 7,000 million or 7 billion litres
4 2,000 million 2 billion litres
5 The EU Nitrate Directive, January 2010, European Commission Publications Office, http://ec.europa.eu/environment/water/water-

nitrates/index_en.html

                                                                                                                             7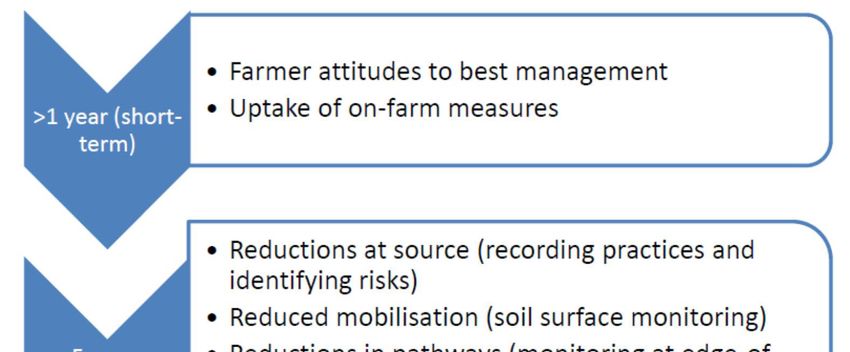
1.3 What are we trying to achieve through the WMP?
Recognising the limited resource that is available to implement the WMP, and that this is a five
year plan, it is proposed that the first cycle should focus on the priority issues. In summary, the
key issues identified for the first five year plan are:
• Nitrate: We must reduce the nitrate concentrations in our groundwater and surface water;
• Phosphate: We need to increase our understanding of the scale of the likely phosphate
     issue on the Island in our inland waters and encourage or require further good practice
     measures to reduce soil P indices and losses to freshwater; and
• Pesticides: We must work to understand better the levels of pesticides in surface and
     groundwater throughout the Island. We must also strengthen the mechanisms we have to
     regulate, control and monitor pesticide use.

We also plan to improve the monitoring strategy in order to increase our understanding
of environmental risks where we are currently lacking information. We will also carry out
a screening for priority and priority hazardous substances.

Collecting good baseline data is important so that we can make decisions as and when we need
to change priorities and policies to tackle emerging issues in future iterations of this plan. In the
future, for example, upward trends in the Island’s population may place more pressure on water
availability or further contribute to diffuse urban pollution; climate change may result in rising
water temperatures and more extreme weather events; economic trends may result in a
changing agricultural focus of the Island. Ongoing monitoring and review will allow us to
respond to this.

To make progress towards good status we have set a series of objectives that are to be
addressed through implementation of this Plan.

Over the short term, through the period of 2017 to 2018 the objectives are to:
• Promote an Island-wide ethic of sustainable land use in Jersey such that the effects of land-
   based activities on the water environment are well known, accepted and mitigated where at
   all possible.
• Communicate the WMP amongst the sectors responsible for, and involved with, delivery of
   measures.
• Update and implement the policy mechanisms necessary for effective delivery of the chosen
   measures: specifically the Water Pollution Law, the Pesticide Law and their associated codes
   of practice.
• Rationalise the ongoing environmental monitoring programme (already underway) to
   incorporate targeted phosphates and pesticide monitoring.
• Develop any additional funding mechanisms required to implement the plan.

In the medium term, throughout the WMP (2017 to 2021), the objectives are to:
• Reduce the levels of nitrate found in surface waters and groundwaters (maximum and
    mean levels).
• Remove the need for the nitrate dispensation.
• Reduce the number of pesticide breaches in streams.
• Increase compliance monitoring for the measures identified in the Plan across the land
    based sectors in respect of losses of nutrients and pesticides to water (% compliance with
    mandatory measures).
• Increase frequency and coverage of existing environmental monitoring for pesticides and
    phosphorus such that a higher number of Jersey’s water bodies can undergo classification
    in 2020 ready for the next round of the WMP.

                                                                                                   8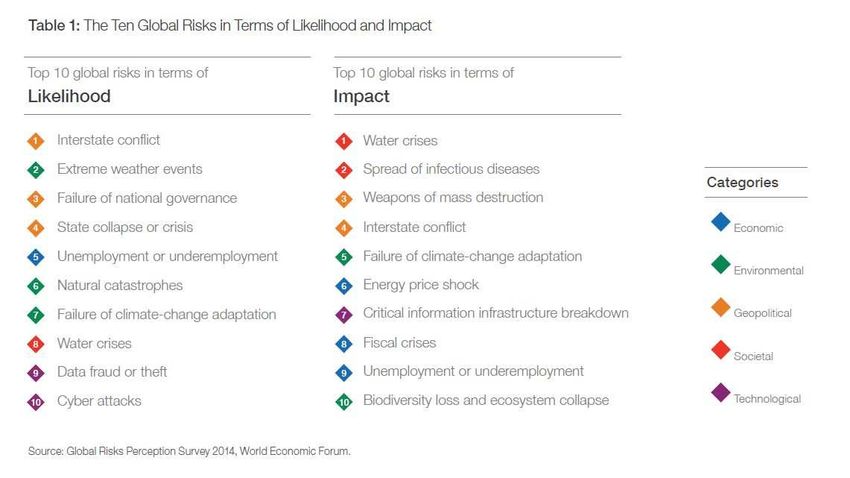
•   Implement additional compliance and advisory capabilities and capacity to ensure
        adherence to new regulations and provide internal advice to DoE

In the longer term, through future iterations of the WMP process (beyond 2021 in blocks of five
years) the objectives are to:
 • Achieve a nitrate level of below 50 mg/l in all drinking water sources (streams and
     groundwater).
 • Achieve good status for pesticides in all groundwaters which are relied on for drinking
     water supply.
 • Achieve good status for phosphates in streams and ponds.
 • Have an established and effective monitoring programme in place which allows for
     progressive and iterative classification of Jersey’s water bodies in each iteration of the
     WMP, including coastal waters.
 • Continue to employ WMP processes to identify and address current and emerging issues to
     ensure sustainable future for Island’s water environment.

1.4        How do we make progress towards the objectives?
A wide ranging survey of possible measures to help reduce nitrate, phosphorus and pesticide
pollution has been undertaken. These were appraised and reduced down to a manageable list of
locally applicable measures. This list was then packaged up into several implementation
scenarios as options:

    •   Scenario 0:            Do nothing. Rural payments6 are removed and we do not introduce
                               any further mechanisms.
    •   Scenario 1:            Business as usual, no change.
    •   Scenario 2a:           Rural payments7 are no longer in place but Water Catchment
                               Management Orders (WCMOs) are introduced.
    •   Scenario 2b:           Rural payments8 continue and Water Catchment Management
                               Orders (WCMOs) are introduced
    •   Scenario 3:            Rural payments9 continue, Water Catchment Management
                               Orders (WCMOs) are introduced plus there is the introduction of
                               more targeted measures including the requirement for arable
                               reversion in specific problem areas and the introduction of a capital
                               grant fund.

These scenarios were designed to reflect a range of policy environments that could have arisen
in Jersey over the next five years.

The precise effectiveness of catchment management measures is very difficult to quantify when
scaling up from field to catchment and requires complex modelling, particularly given that
timeframes for a response are relatively slow, particularly in groundwaters. Jersey does not
have such a resource to draw upon. Because of this we have taken a different approach to
comparing effectiveness between the different scenarios to help decide the appropriate way
forward.

We worked on the premise that the different policy environments would drive varying levels of
uptake of the underlying measures. Any changes to who the measure would target were also
assessed. Under each policy scenario the likely uptake rate of each measure was considered, and

6 The Single Area Payment at the time of writing but this will be delivered differently under the new Rural Economy Strategy .
7 As above
8 As above
9 As above

                                                                                                                                 9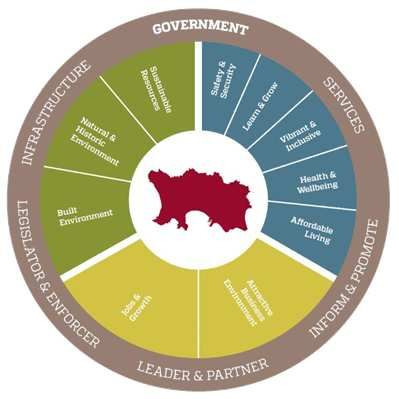
compared with the uptake level at the moment. The difference essentially dictates the
“effectiveness”. Under Scenario 0 for example, existing policy instruments supporting the
implementation of measures are removed. Unsurprisingly it was estimated that effectiveness of
measures to improve the status of our waters under Scenario 0 would therefore be low. Under
Scenario 2b the implementation of some additional policy instruments would make some
measures mandatory and therefore the effectiveness of the scenario would be much higher.

We then added in cost information. Cost estimates (gathered from available sources from Jersey
and elsewhere in the UK) were then combined with the uptake rates in order to allow for a
comparison of costs between each scenario, and to estimate to what sector the additional costs
might fall. The cost implications of the scenarios have been considered for comparison purposes
and to facilitate planning for delivery.

Our preferred Scenario, after careful consideration of the balance of effectiveness and
cost is Scenario 2b. Under this scenario rural payments10 continue and Water Catchment
Management Orders (WCMOs) are introduced.

Scenario 3 can be implemented at a later date under the next WMP after 2021, or if
additional resourcing is identified.

We propose to designate the whole Island as a Water Catchment Management Area (WCMA)
under the Water Pollution (Jersey) Law, 2000 (WPL). Thereafter, Water Catchment
Management Orders (WCMO’s) can be passed by the Minister for Environment which would
allow for cornerstone elements of good practice to become legislative requirements across all
sectors for anyone carrying out certain activities. This creates a level playing field for land
managers to operate. However the mechanism chosen will still enable us to target compliance
effort where there are specific pollution hotspots or where environmental sensitivity is greatest
in some catchments.

Under Scenario 3 action would be enhanced by the addition of even more targeted measures
either across Jersey or just in certain areas but using the same WCMA mechanism. This would
enable further, more specialised actions or restrictions to become mandatory (for example
arable reversion to grassland), but it would also be much more costly.

We have appraised the existing elements of best practice, and considered further elements, to
arrive at the following new proposed regulatory controls:

                    WCMO TITLE                                        KEY PRESSURE               SECTORS CONDITION
                                                                      ADDRESSESD                 APPLIES TO
 WCMO 1             Fertiliser imports and sales                      Nitrates and               All non-domestic users of
                                                                      Phosphates                 fertilisers
 WCMO 2             Nutrient Planning and                             Nitrates and               All non-domestic users of
                    Management                                        Phosphates                 fertilisers and organic
                                                                                                 manures
 WCMO 3             Field operations and applications                 Nitrates and               Agricultural sector
                                                                      Phosphates
 WCMO 4             Soil Protection                                   Nitrates,                  All non-domestic land
                                                                      phosphates and             managers
                                                                      pesticides
 WCMO               Pesticide storage and application                 Pesticides                 All non-domestic users of
 511                                                                                             pesticides

10   The Single Area Payment at the time of writing but this will be delivered differently under the new Rural Economy Strategy
11   Q4 2016 update: This will be delivered through pesticide legislation, not using A WCMO

                                                                                                                                  10
1.5 How costs will be shared
The measures appraisal process allowed for a high level comparison of the potential cost
implications of each scenario. This is indicative only and is not designed to estimate the absolute
cost implications of the Plan and does not replace the role of a Regulatory Impact Assessment.
The table below sets out the additional costs borne by different sectors as a result of
adoption of scenario 2b, relative to the current position (scenario 1). The figures are the
change in undiscounted implementation costs between the two scenarios, by sector over the
five years of the WMP.
Additional costs borne by different sectors as a result of adoption of scenario 2b, relative
to the current position (scenario 1) over the five years of the plan
Average cost over five years
Water industry
£1,188k
Average cost over five years
Government
£494k
Land managers, Average cost over five years
including farmers £648k
Average cost over five years
Industry
£188k
Additional Government costs are envisaged to be just under £100k per year. This is
mainly for development and implementation of increased regulation (through WCMOs)
and codes of good practice, for advice and compliance checking and for additional water
quality monitoring.
Government costs in the Plan have been kept to a minimum. However, delivery of the Water
Plan cannot be achieved using in house resources past the point of preparation and production
of the WCMOs. Additional resource needs to be found to ensure compliance checking and
advice is deliverable, and that we can collect the information that we need.
To fund the Government costs proportion of the plan in the medium to longer term under
Scenario 2b there are a number of options that need to be investigated further:
a) A tax on fertilisers and/or pesticides.
b) Additional revenue generated from the sewerage charge proposed by Department for
Infrastructure.
It is recognised that other fiscal mechanisms will require preparatory work but they need to be
in place to fund the additional compliance and advice required to ensure Water Catchment
Management Orders are complied with. Funding has already been prioritised within the
Department of the Environment for law drafting and other preparatory work for 2016 and
2017.
The additional costs for the land management sector of approximately £130k per year
for the whole sector are associated with complying and demonstrating compliance with
the new regulatory baseline of good practice.
11However some of the costs of the proposed new regulatory requirements to be borne by the
Land Management sector were based on the assumption that everyone was implementing them
from the start without anything at all already in place. This is not actually the case. In fact, the
vast majority of this sector is claiming Single Area Payment, receipt of which is contingent on
having many of these measures in place. Although we recognise that compliance is lower than it
should be, the vast majority are at least partially compliant. Market assurance schemes (e.g.
Tesco Nurture or Leaf) also demand evidence of environmental good practice. For those that are
not fully compliant already, it will cost those who are the least compliant the most additional
cost to catch up with what will be the new regulatory baseline.
The additional water industry costs (which includes Jersey Water and the Department
for Infrastructure) are driven by the implementation of a reservoir bypass scheme by
Jersey Water under scenarios 2a, 2b and 3 – this is a large cost item at a mean cost of £1M
over the five years of the plan. The remaining cost to the water industry in Scenario 2b is
the introduction of charging for discharge permits. Industry (other) will bear the least
increase in cost and will pay the remaining proportion of the discharge permit charges of
approximately £37k per annum.
The potential costs in respect of inaction have not been considered here.
1.6 What are the next steps and how will we judge success?
We have established a set of Key Performance Indicators (KPIs) against which to judge the
success of the implementation of the Plan. These KPIs reflect the need to recognise success
based on both activity as well as outcome, particularly as there may be a lag time before water
quality improvements are evident.
• KPI 1 Increased communications and awareness of the water management challenges on
Jersey
• KPI 2 Behavioural change to adopt more sustainable water management
• KPI 3 Increased compliance checking
• KPI 4 Optimising phosphate levels in soils
• KPI 5 Continued trend of reductions in groundwater and surface water nitrate levels
• KPI 6 Progressive reduction in the number of nitrate dispensations required
• KPI 7 Reduction in the pesticide levels in raw water supplies
• KPI 8 Enhanced and more focused environmental monitoring programme
In 2020 we will use the classification tools (built as part of the previous phase of work in 2014)
with updated environmental monitoring data (gathered throughout 2016-2020) to re-classify
the water bodies. Comparing the data from 2014 and 2020 we will then be able to re-appraise
the measures needed for the subsequent five year planning cycle and produce the next plan.
122. Introduction
2.1 Why do we need a Water Management Plan?
Globally, water scarcity1213 is among the most pressing issues to be faced in the 21st century. In
the last century, water use has been growing at more than twice the rate of population increase.
The World Economic Forum in its annual ‘Global Risks Report’ 2015 recently ranked ‘water
crises’ as one of the top concerns in respect of likelihood of occurrence and gravity of impact
(Table 1). It is also the top risk in terms of impact.
Table 1: The Global Risks Landscape 201514
Freshwaters provide society with goods that are essential to human wellbeing, such as clean
water, food and energy. Freshwaters also provide other services that are less tangible but
equally important. For example, they enable recreation and provide cultural and spiritual
inspiration and meaning. All these benefits that freshwaters provide to humans are the so-
called ‘water ecosystem services’.
Many of the ecosystem services provided by the environment are either undervalued or have no
recognised financial value at all. Recently it was estimated that for the entire biosphere the
minimum estimated value of the services provided (most of which is outside the market) is
thought to be in the range of $US 125-145 trillion (1012) per year 15 which is almost twice the
total global gross domestic product.
12 Water scarcity relates to both quantity and quality.
13 Water crisis is defined as “a significant decline in the available quality and quantity of fresh water, resulting in harmful effects on
human health and/or economic activity”. Global Risks 2015, 10th Edition, World Economic Forum This report and an interactive
data platform are available at www.weforum.org/risks.
14 Global Risks Perception Survey 2014, World Economic Forum. Global Risks 2015, 10th Edition, World Economic Forum This
report and an interactive data platform are available at www.weforum.org/risks.
15 Changes in the global value of ecosystem services, Costanza et al, Global Environmental Change Volume 26, May 2014 Pgs. 152-
158.
132.2 Uses of water in Jersey
2.2.1 Public Water Supply
It is estimated that approximately 90-95% of households on the Island have a mains water
connection to their property. Jersey Water supplies about 7,000 Mega Litres (Ml) (which is
seven billion litres or 7,047,000 m3) of water to their business and domestic customers per year,
the vast majority of which comes from surface water streams via reservoirs on the Island. The
supply of mains water in Jersey is regulated through the Water (Jersey) Law 1972.
As part of the demand management measures necessary under the company’s 25 year Water
Resources Management Plan there has been a move to universal metering that is now almost
complete. With just 120 days of water storage in the reservoirs, Jersey Water also own and
operate a desalination plant capable of producing 10.8 Ml per day (approximately 50% of daily
demand).
2.2.2 Private Water Supply
Of the 41,59516 households in the Island, approximately 3,390 are served by private boreholes
and wells. In 2013 an estimated 2,162 Ml (2,162,597 m3) was abstracted from groundwater in
Jersey, mostly for private and business use. The quality of this water is unregulated and mostly
untreated – the quality is entirely dependent on the quality of the water in the environment.
2.2.3 Business and industry
All businesses in Jersey are water dependant in some way, even if it is just the need to service
staff with drinking water and sanitation. Industries such as agriculture and fisheries are of
course heavily water dependant.
2.2.4 Recreation
Our water environment also provides opportunities for participation in a wide range of water-
related leisure activities that are vital for wellbeing and are also economically, socially and
culturally significant. The water environment is part of the recreational experience for many,
either along the cliff paths, valleys and reservoir walks or for the numerous shore and water-
based activities on offer in the Island.
2.2.5 Natural Environment
In respect of biodiversity, Jersey’s geographical position and favoured climate allows many
species normally restricted to either Britain or the European continent to extend their range,
resulting in an overlapping mixture of animals and plants found only in the Channel Islands.
Many of Jersey’s designated ecological Sites of Scientific Interest (SSIs) have an important land-
water interface and support important aquatic or semi-aquatic species. Beyond the land, the
ecological importance of Jersey’s waters is recognised by the fact that an area of our intertidal
habitat larger than Jersey itself (almost 190 square kilometres) is designated as a site of
international importance under the Ramsar Convention. An adequate supply of good quality
water is essential for ecological status in our waters and on the ecosystems that are dependent
on our waters.
16 Jersey in figures, 2014
14The natural environment of Jersey is also highly important to the people of Jersey. According to
a recent States of Jersey survey of residents on issues regarding the Island’s heritage17, the
character of the Island’s environment was consistently ranked as the most important factor by
respondents. Participants at a 2013 stakeholder workshop who were asked to produce a vision
for St. Aubin’s Bay said that it should be “an attractive bay with good water quality that is widely
used for leisure and work and which supports a rich diversity of marine and bird life”. It was felt
that the aims of water management should include the bay being a place for tourism, recreation
and business to thrive, which has good and protected water quality, a managed and healthy
fishery and a diversity of marine and bird life, and we should also gain a better understanding of
what drives the periodic sea lettuce blooms. This suggests that at least a proportion of the
public in Jersey are well aware of the balance between social, environmental and economic
considerations in environmental protection.
2.2.6 The Water Management Plan and the Strategic Plan 2015-2018
The current States of Jersey Strategic Plan 2015-201818 refers to a number of important
strategies, policies and legislation which includes the “new Water Strategy” (this WMP) and a
“Climate Change Adaptation Strategy”. The Strategic Plan states that one of Government’s key
purposes is to deliver positive, sustainable economic, social and environmental outcomes for
Jersey which includes the protection and enhancement the Island’s natural and built
environment.
Improving health and wellbeing and optimising economic growth are two of the five chosen
priorities to be addressed during this term. Water that meets EU and World Health
Organisation (WHO) drinking water standards is a fundamental necessity for health and
wellbeing. In addition, if Jersey’s credibility and standing in the market place amongst informed
investors is to be improved and enhanced in terms of environmental sustainability we need
clear action to address priority issues such as water quality.
The recent Environmental Policies Review carried out by the Environment, Housing and
Technical Services Scrutiny Panel presented to the States on 24th April 2015 supported the
necessity of a longer term more sustainable approach to planning for the future and also
expressed concern about the high nitrate levels and recommended that the prospective WMP
should resolve the problem of high nitrate levels as a priority.
The Strategic Plan also proposes the need for an ‘Island vision’ - that provides clarity about
Jersey’s future direction and ensures that all aspects of Jersey’s future sustainability are being
addressed in a coherent way.
The development of this Island vision is underway.
Figure 1. shows how the vision recognises the importance of balancing community, economic
and environmental goals in order to ensure our island is one of prosperity and opportunity, to
foster a community that is caring, healthy and vibrant and to preserve this beautiful and special
place for future generations.
17 http://www.gov.je.Government/JerseyWorld/StatisticsUnit/PeopleCommunities/Pages/SurveyonHeritageinJersey/aspx
18 https://www.gov.je/Government/Pages/StatesReports.aspx?ReportID=1424
15Figure 1: The vision being developed for Jersey
Sustainable water resource use is one of the cornerstones of this vision and this WMP and
process will help us translate this vision into action.
163. Preparation of this WMP
3.1 The underlying principles
We have broadly followed the core principles of the EU Water Framework Directive (WFD) in
preparing this WMP for Jersey. One of the principles is that plans should be produced using a
cyclical and iterative approach so that lessons learnt, new information and emerging issues are
reflected in the next plan (Figure 2).
Throughout 2015, work has been focused on identifying measures which could be drawn upon
to help tackle some of the priority water challenges. The end point of this phase of work in is the
WMP – this report.
The next phase of work will be focused on implementing the actions set out throughout the
period 2017 to 2021 and monitoring the success of these measures through monitoring the
environment and level of stakeholder engagement and behaviour change.
After 2020, the classifications defined in the first phase of work will be updated to understand
the outcomes of the WMP before refining the action plan for the next planning cycle (2022-
2026).
The Challenges for the Water Identify water
Environment of Jersey bodies
(Previous phase of WMP, 2014)
Assess current
status classification
The Jersey Water Management
Plan 2017
Set status objectives
(This Plan, 2017) and define target
date
Set out measures needed to
reach objectives by target
Implementation of measures within date
this WMP 2017-2021
(Action between 2017 and 2021) Implement measures
and monitor
outcomes
Figure 2: the WMP Process
173.2 What are the key changes compared with previous water management approaches?
Historically water quality has been managed separately from water resources and aquatic
biology. The new way of working recognises that each individual pollutant and pressure has a
role to play in the overall ecological ‘health’ of the water environment. Therefore a more
holistic management plan, which seeks to address a range of issues, is required. This is
particularly relevant in Jersey as land use and water quality are very closely linked.
The process of working on this plan has provided a driver for better integration, by bringing
together specialists from the marine sector and the freshwater environment, alongside land
management and agricultural specialists.
During the first stage of the process (in 2014) data were integrated and combined across these
policy areas for the first time in order to define the status of water bodies. In the second stage
of the WMP process (2015), an appraisal of all the existing measures in Jersey was undertaken,
so we have a much better understanding of what measures are most useful along with measures
in place elsewhere.
Next we considered how the uptake of measures might change under different policy scenarios
that may occur and suggested a combination of measures to be implemented over the next five
years. We have also considered the wider ecosystem benefits, aside from water management,
that implementation of the WMP will provide.
3.3 Planning cycle and terminology
The approach taken to selecting the actions to be pursued in the next five years has been to
initially consider what needs to be done (i.e. the ‘measures’) and then to consider how best the
measures could be delivered (i.e. the ‘mechanisms’).
Measure - e.g. Nutrient
Management Plan
Mechanism
HOW TO deliver measures
Measure - e.g. Buffer
i.e. Regulation, support / Strip
advisory or economic
incentives
Measure - e.g. Soil
Nitrogen Testing
Figure 3: The relationship between measures and mechanisms
184. Water management priorities for
2017-2021
4.1 Challenges for the Water Environment
The first report in 2014 – ‘Challenges for the water environment of Jersey19’ - set out the current
status of the water environment and what the priority issues are.
As a first step, the streams, ponds, reservoirs, ground waters and coastal waters in Jersey were
identified, along with the Water Management Area (WMA) to which they belong (Figure 4).
Alongside this, a non-statutory system of Priority Protection Areas were also assigned.
Figure 4: Jersey’s water bodies and Water Management Areas (WMAs)
19 http://www.gov.je/Government/Pages/StatesReports.aspx?ReportID=1123
194.2 The Status of Jersey’s Water
The current status assessment of the water bodies was undertaken by examining existing
monitoring data. The classification status20 of each water body was subsequently assigned in the
categories of high, good, moderate, poor and bad21.
All of the streams in Jersey are currently at less than good overall ecological status, with
nutrients being the most significant (commonly occurring) issues driving this
classification (Figure 5).
This WMP seeks to address the issues identified in any water body with a classification of
lower than good status.
The issue with nitrate in Jersey is well documented. Phosphate monitoring is not as widespread
or longstanding on the Island but, on the basis of limited monitoring data, all stream water
bodies have been assessed as ‘moderate’ status in a precautionary approach. The data
availability is limited for ponds and reservoirs but the data available for reservoirs also suggest
that phosphate is a concern; hence this issue needs further investigation.
For surface waters, the ‘Chemical Status’ and ‘Specific Pollutant’ assessment was based on
chemical standards set for substances that are significant at a Europe-wide level in the former
instance (so-called priority or priority hazardous substances), and at a national level (in this
case drawn from England, Wales and France) in the latter case (so-called Specific Pollutants).
Some pesticides are included amongst these lists, for example Simazine and Linuron.
A further broader risk assessment was undertaken for other pesticides related to drinking
waters in streams and, when combined with the groundwater chemical assessment, highlighted
that further investigation is needed into Island-wide pesticide levels. Recent pesticide detection
in local water bodies have highlighted the need for action in respect of pesticides both in terms
of assessment and understanding and in terms of measures to reduce pesticide losses to water.
20 The classification methodology is complex but in simple terms a range of aspects were examined (such as water quality, quantity
and ecological health), to see how these elements compare to the natural situation. The status classifications for each element (with
the exceptions of hydrology and morphology because these are ‘supporting element’ assessments, rather than elements that drive
status classifications) were then combined into a single classification with the overall classification result being determined by the
lowest status of any of the elements – a one out, all out approach. This is consistent with the approach in the Water Framework
Directive and so allows us to compare our results with other jurisdictions.
21 Good status indicates that the classification assessment shows that the relevant biological quality elements are only slightly
disturbed compared with the natural, undisturbed, condition. Moderate status indicates that the relevant biological quality
elements are moderately changed from natural conditions. Poor status indicates a progressively more disturbed quality status
compared with Moderate. Bad status indicates that these components are shown to be severely changed from the natural example
as a result of human activities.
20Figure 5: The status of Jersey’s stream water bodies (States of Jersey, 2014)
Groundwater was also assessed for status in the categories of quantitative (i.e. amount) and
qualitative (i.e. chemical). Quantitative status was determined to be good although this does not
mean that there are no abstraction pressures on groundwater, or that groundwater resources
will not become stressed during droughts or in the future due to population pressures or
climate change.
The qualitative (chemical) classification results underlined and supported the surface water
findings that nitrates and pesticides required further consideration in the next stages of the
water management planning process (
Table 2).
Table 2 below shows the parameters for which there were sufficient monitoring data in
groundwater to carry out chemical screening and classification. Perfluorooctanesulfonic acid
(PFOS), a Specific Pollutant, is a known contaminant in the groundwater in St Ouen’s Water
Management Area (WMA).
The other two groups of substances with a poor status result are nitrate and pesticides. These
are recognised as the most widespread groundwater contaminants across Europe.
For pesticides, the monitoring results analysed showed that four out of the eight WMAs have
sites that show pesticide levels higher than the EC standard for one or more pesticides on one or
more occasions. Although the concentrations were normally low, the standard is also very low,
so the status result for pesticides has been assigned as ‘Poor’ in these four WMAs.
The occurrence of pesticides in groundwater is not a new issue in Jersey and is referred to for
example in BGS (2000).
Finally, for nitrates the percentage of sites exceeding the threshold value of 37.5 mg/l NO3
(average) varies between 33% and 100%. This exceeds the recommended 20% so all WMAs fail
the screening for nitrate.
21Table 2: Groundwater Qualitative Status Summary (States of Jersey, 2014)
Parameter Groundwater Qualitative Status
Nitrate NO3 Poor in all WMAs
1,1,1-Trichloroethane6 Good in all WMAs
1,1,2,2-Tetrachloroethane6 Good in all WMAs
Vinyl chloride22 Good in all WMAs
Pesticides (individual) Poor in 4 out of 8 WMAs
PFOS23 Poor in 1 WMA (St Ouen WMA due to the airport)
Phosphate Unknown status
Salinity Good in all WMAs
Sulphate Good in all WMAs
The coastal water in and around St Aubin’s Bay was assessed using the following classification
elements: dissolved oxygen; total inorganic nitrogen; phytoplankton; macroinvertebrates;
seagrass; and seaweed. The overall combined classification of the coastal water was moderate
status. This has been driven by the seaweed assessment: all the other elements were classed as
high or good. A similar assessment of the other coastal areas around Jersey was not possible as
the environmental monitoring does not extend around the Island.
Although nutrients and pesticides have been identified as the top priorities for this first cycle of
WMP, other water management issues were identified. Hydro morphology is one such issue:
that is the natural form and function of the watercourse. Many of the Island’s streams and
coastal waters have been modified in some way which affects the naturalness of the
watercourse.
Another concern that was highlighted as part of the previous phase of work was the resilience of
water resources during periods of drought. These issues have currently been assigned a lower
priority than nutrients and pesticides as we have mechanisms in place through the Water
Resources Law, the drought plan and the Department’s hydrogeological expertise to manage
these effectively at the current time. However, the resilience of water resources may become
more prominent under climate change scenarios or population growth in the medium to longer
term and the loss of the Hydrogeologist is one of the identified Departmental savings over the
life of this plan.
22 These are all industrial chemicals, the first two are used as industrial solvents and the latter is used in the production of PVC and
vinyl products.
23 Perfluorooctanesulfonic acid (PFOS) has been used to make aqueous film forming foam (AFFF) a component of fire-fighting foams
previously used in airport fire-fighting.
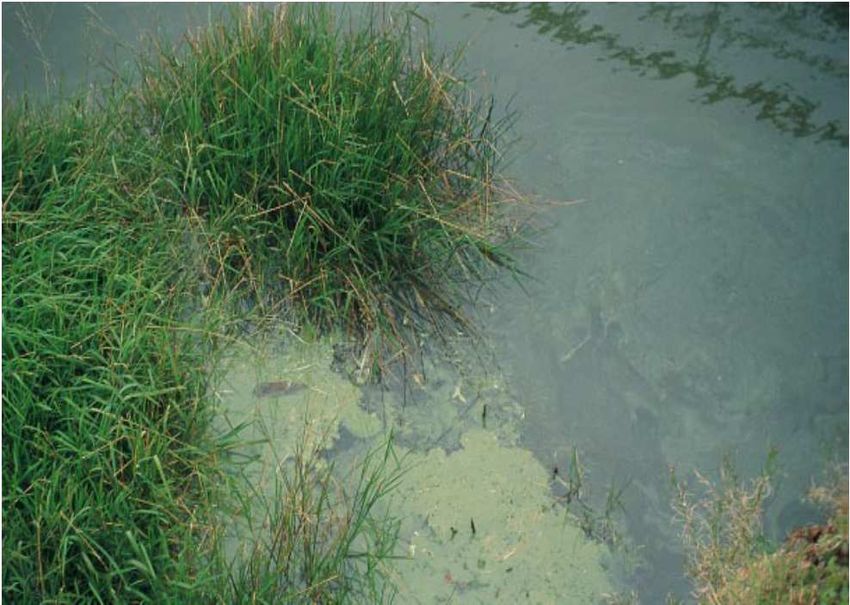
224.3 The impact of nutrients and pesticides
Nutrients and pesticides have been identified as the key water management issues.
Elevated levels of these substances result in a range of impacts relating to drinking water
quality, environmental water quality and overall ecosystem health.
The main nutrients of concern, phosphorus and nitrogen, are common pollutants generated
from urban and agricultural land use, and are associated with human and animal wastes and
fertiliser. As a consequence, water quality is strongly associated with land use.
Nitrogen and phosphorus are plant nutrients required by plants to grow so they are used in
agriculture in the form of fertilisers and are also used in domestic gardening and amenity
horticulture. Organic manures such as slurry and manure applied to land also contribute to the
nutrient loading to land, as do private drainage systems such as septic tanks and soakaways.
Private drainage systems are in fairly widespread use in Jersey where no mains drains are
available. Water falling as precipitation carries these nutrients into streams and reservoirs
and/or percolates down through the soil and into groundwater.
A pesticide is any substance or mixture of substances used to destroy, suppress or alter the life
cycle of any pest, and they are widely used in commercial land based industries as well as in
domestic gardening. Overuse, or misapplication of pesticides leads to the chemical substances
in them contaminating water. In particular, plant protection products released into the
environment in an uncontrolled way by spray drift, leaching or run-off may pollute soil, surface
water and groundwater. Environmental contamination can also occur during and after
application, when cleaning equipment, or through the uncontrolled illegal disposal of pesticides
or of their containers.
4.3.1 Nitrate
Despite improvements over the last 15 years (as indicated by the data in Figure 6 and
Figure 7), Jersey’s groundwater, surface water streams and ponds still have some of the
highest levels of nitrate in the whole of Europe. Approximately 50% of all sample results
for nitrate taken from either surface or groundwater are above 50 mg/l nitrate (NO3). In
comparison, across the EU approximately 3% of surface water and 15% of groundwater
samples exceed 50 mg/l of NO324.
High nitrate levels in streams and reservoirs can cause disruption to drinking water supplies –
either through an increased need for blending different sources of water (which carries a
potential impact on water bills) or, in more severe cases, can result in a raw water source being
taken out of supply. This nitrate is strongly associated with land use practices and consequently
varies in severity of impact between catchments, depending on the predominant land use in the
catchment. This trend was highlighted by the status assessments carried out for this WMP and
by the data for different water management areas (Figure 6).
24 The EU Nitrate Directive, January 2010, European Commission Publications Office,
http://ec.europa.eu/environment/water/water-nitrates/index_en.html
2390 40000
80 35000
70
30000
Area farmed /head of cattle
60
25000
Nitrate mg/l
50
20000
40
15000
30
10000
20
10 5000
0 0
1980
1982
1984
1986
1988
1990
1992
1994
1996
1998
2000
2002
2004
2006
2008
2010
2012
2014
Nitrate in surface water Nitrate in groundwater JR farmed area (vergees)
Head of cattle Total area farmed
Figure 6: Average nitrate (mg/l) in surface streams and groundwater in Jersey compared
to area of Jersey Royals planted (vergees) and number of cattle, 1980-2015. In 2015 the
average level of nitrates in surface streams was 47 mg/l, the same level as recorded in
2014.
100
90
80
Percentage of samples
70
60
50
40
30
20
10
0
Less than 50 mg/l More than 50 mg/l
Figure 7: Percentage of surface stream samples below and above 50 mg/l (Jersey Water
data). The graph shows that the proportion of samples at less than 50 mg/l has increased,
whilst the proportion above 50 mg/l has reduced. In 2015, half of all samples exceeded
the limit of 50 mg/l.
24120
Percentage of samples containing over 50
100
80
mg/l Nitrate
60
40
20
0
Grands La Haule and Longueville, Northeast Northwest St Aubin’s, St Ouen’s Waterworks
Vaux, Vallee St Peter’s Queen's St Brelade’s and West Valley and
de Vaux and Valley Valley and and Bellozanne
St Helier Southeast Southwest Valley
Water Management Areas by year (1998 to 2015, left to right)
Figure 8: Percentage of surface stream samples taken that are over 50 mg/l nitrate by
Water Management Area (1998 to 2015, from left to right). It can be clearly seen that the
reducing trend is not apparent in the ‘North West’ or ‘St Ouen’s and the West’ catchments.
4.3.1.1 Nitrate impacts on Public Water Supply
At certain times of the year the level of nitrate in our streams and groundwater is so high that
Jersey Water cannot guarantee to meet the local and international standard of 50 mg/l of nitrate
in the mains drinking water supply. Consequently, the Company takes active measures to
control the concentrations of nitrate in supply by careful blending and dilution of its water
resources. The Company applies for a dispensation from the Minister for Environment for those
occasions when nitrate levels in water resources exceed manageable concentrations.
During the consultation on the 2009 dispensation, the Health and Social Services Department
agreed to the dispensation but advised that they would not continue to support this
dispensation unless steps were taken to tackle catchment inputs of nitrogen, which are the
source of the problem. As a result the Environment Department started working with farmers
under the Diffuse Pollution Project to see what could be achieved using voluntary means.
The Health and Social Services Department then agreed to a dispensation for three more years
from 2013 on the condition that the maximum level in supply under the derogation was
tightened and the time window that these exceedances could take place were reduced to six
months of the year. The current dispensation ceases on 31st December 2016 and the terms of a
new dispensation have just been agreed to run over the same time-period as this plan.
As part of the Nitrate Working Group work in 2014 and 2015 the Public Health directorate
(States of Jersey) reviewed the health effects of nitrates in water following concerns raised
about high levels of nitrates in the Jersey water supply. Their report recommended that work
continues to examine all possible interventions to ensure that nitrate levels in Jersey water are
within WHO guidelines. It also stated that the Public Health Department should continue to
research cancer data, particularly around those cancers that have been linked to elevated
25nitrate levels in drinking water, and revise advice given to consumers with a private water
supply, which has been done.
Jersey Water carries out tests on about 7,000 samples throughout the year from water sources,
treatment works, storage reservoirs and customers’ taps. In 2014, the treated water supplied
was 99.99% compliant with all physical, chemical and bacteriological standards under the
Water (Jersey) Law, 1972 and the dispensation for nitrate was not used in 2014 or in 2015.
Figure 9 shows the maximum level in supply from 2001 to 2015.
Currently Jersey Water uses its reservoirs and raw water transfer network to dilute and blend
water sources to try to meet the limits. To achieve this on a more consistent basis in the future,
Jersey Water are currently planning a scheme involving the installation of bypasses to Val De La
Mare and Queen’s Valley Reservoirs which will help prevent high nitrate or otherwise polluted
water from entering the reservoirs. However, blending and diverting high nitrate sources
around reservoirs during certain times of year are not in themselves always sufficient to ensure
the 50 mg/l is achieved. In addition this blending and diverting strategy can only be employed if
there is sufficient storage to serve the water needs of the Island. The option of using the
desalination plant is available; however this is expensive in the long term and as such these
measures taken should not be viewed as the only solution in the long term. Furthermore, this
technique does not address water quality concerns for those on private water supplies, or those
relating to wider ecosystem health.
80
Maximum nitrate levels in treated
70
69
60
57.8 59.8 58.2
water (mg/l)
50 57.6 56.7 56.3
51.8 54
51.4 49.6
48.7 47.4 46.9
40
42.8
30
20
10
0
2001 2002 2003 2004 2005 2006 2007 2008 2009 2010 2011 2012 2013 2014 2015
Max nitrates MAC
Figure 9: Maximum nitrate levels in mains water supply 2001-2015 against Maximum
Allowable Concentration (MAC)
Treatment to remove nitrate from the supply is an option. Nitrate removal, for example by ion
exchange, is possible but is not a desirable option for the following reasons:
• It would be extremely costly (in excess of £3M capital cost plus operating costs).
• Depending on the method chosen it may result in a loss of 10% to 15% of the total applied
flow, which would affect water availability significantly.
• It would not mitigate other pollutants like pesticide and phosphate.
• It would not address ecosystem damage caused by pollution.
• It wouldn’t address the private water supply issue (approx. 3,400 private households in
Jersey).
• It does not mitigate the costs for other downstream users and recipients, such as St Aubin’s
Bay.
26You can also read