Land and water condition for agriculture: constraints and opportunities - Dr Richard George, Principal Research Scientist Department of Primary ...
←
→
Page content transcription
If your browser does not render page correctly, please read the page content below
Land and water condition for agriculture:
     constraints and opportunities
           Dr Richard George, Principal Research Scientist
   Department of Primary Industries & Regional Development, Bunbury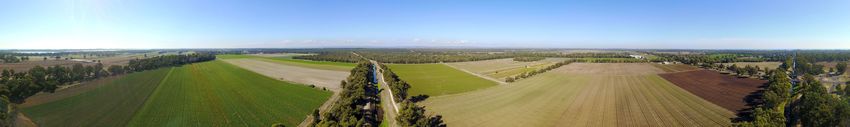
The context talk…
  • Emphasis – water balance
  • Start dryland and end irrigation –
     • system constraints (broad acre) – land degradation
     • opportunities (irrigation) - water
  • Context sustaining south & growing north…
    examples…
  • Key message – manage water, manage degradation
    and improve productivity & resilience
                                                            1993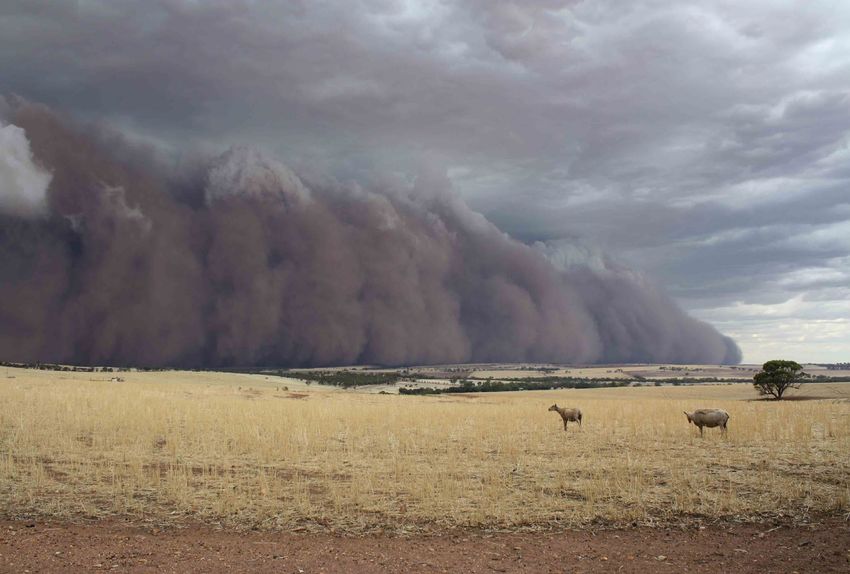
The South: “Wheatbelt”

Region 25.115 M ha
Native Veg – 7.601 M ha
Cleared - 17.514 M ha cleared

Majority 2400mm evaporation

Rapid and extensive clearing
1950s to 1983.

Roots to bedrock… used water
365 days… resilient to aridity
                                 Wheatbelt ~ 15 M ha

                                                       3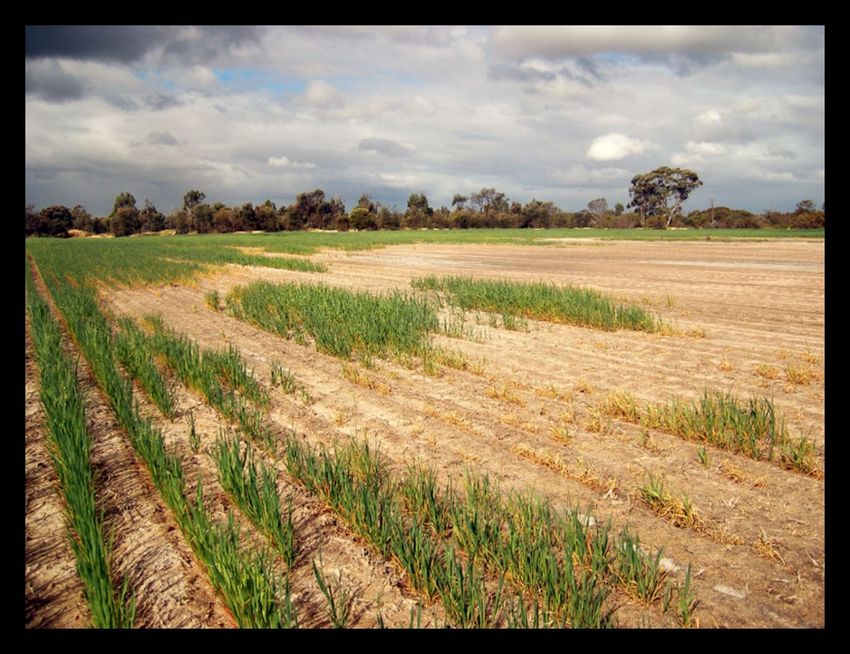
WA 2016/17 agriculture = production
            & exports

                                                                                   $7 billion GVAP
                                                                                  *2.47 multiplier
                                                                            $17 B to WA economy

                                      https://www.agric.wa.gov.au/food-export-investment/western-
                                      australia’s-agrifood-fibre-fisheries-and-forestry-industries-2018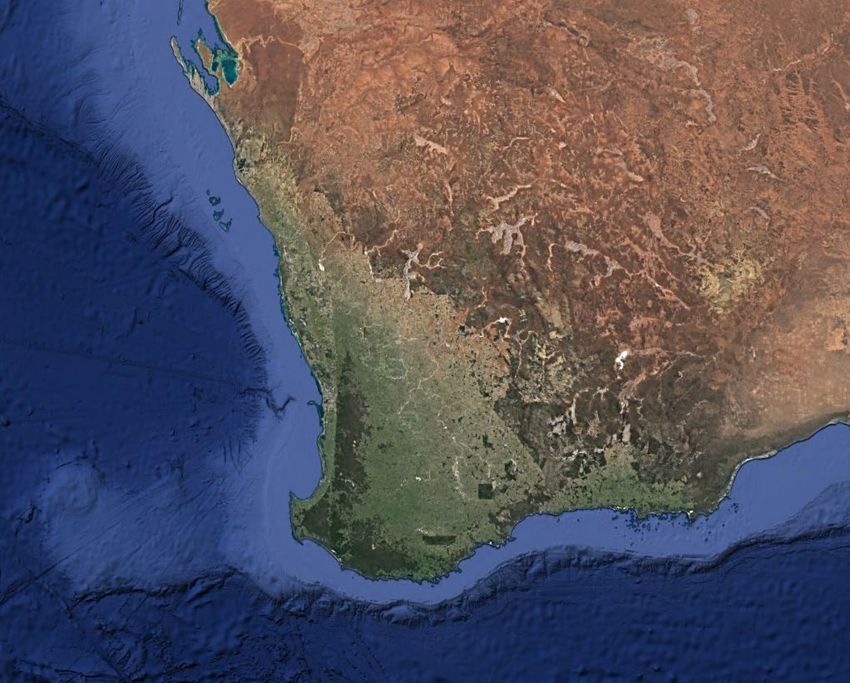
17.9 mt

                                                 1994    2007    2014
                  Farm size (ha)                 2500    4000    6000
                  Yield (t/ha)                   1.8     2.1     2.6
                  Total net asset                $3m     $6.5m   $12m

Annual rainfall   WA Production                  8mt     12mt    17mt
changes < 1975    No. Growers producing 85% of   1200    800     600
and after 2000    WA crop
                  GVAP WA crop                   $1.4b   $2.8b   $5.5b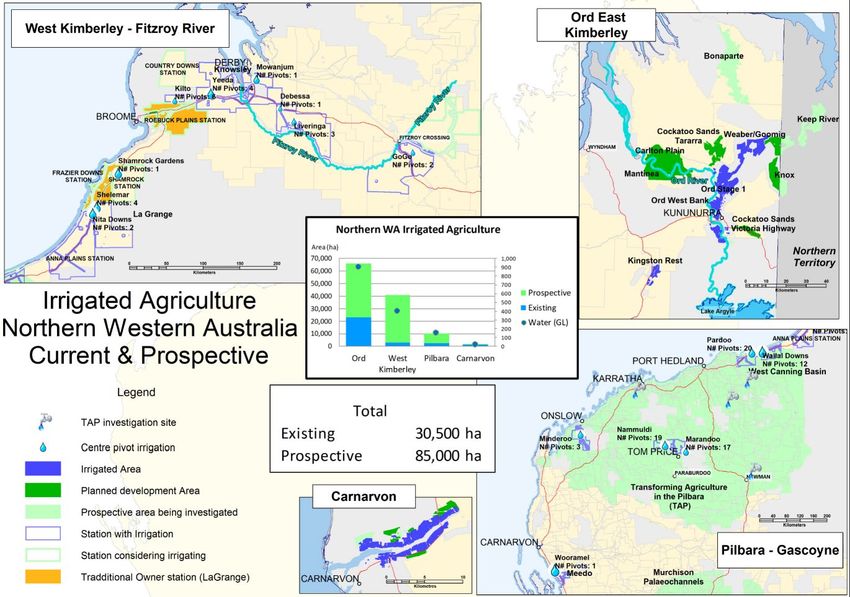
1994    2007    2014    2025
                        Farm size (ha)                 2500    4000    6000    12000
                        Yield (t/ha)                   1.8     2.1     2.6     3.0
                        Total net asset                $3m     $6.5m   $12m    $20m

Growing season          WA Production                  8mt     12mt    17mt    22mt
rainfall changes        No. Growers producing 85% of   1200    800     600     300
< 1975 and after 2000   WA crop
                        GVAP WA crop                   $1.4b   $2.8b   $5.5b   $9b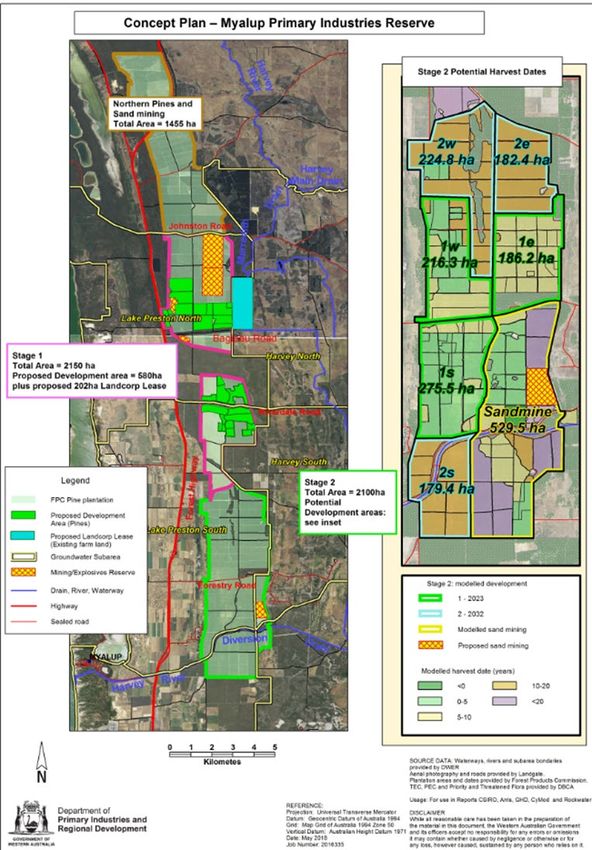
But…       annual systems…
                                                    •
Eventually consequences under ~150 day
              agriculture system                                                   Salinity & Waterlogging

Summer 2008

                                                              ….Visible

                                                              Salinity, water and wind erosion, acidification,
                                                              eutrophication

              Invisible… soil/subsoil acidity, non-wetting,   Community: water quality, biodiversity,
              compaction, soil decline…. GRDC                 infrastructure….                            8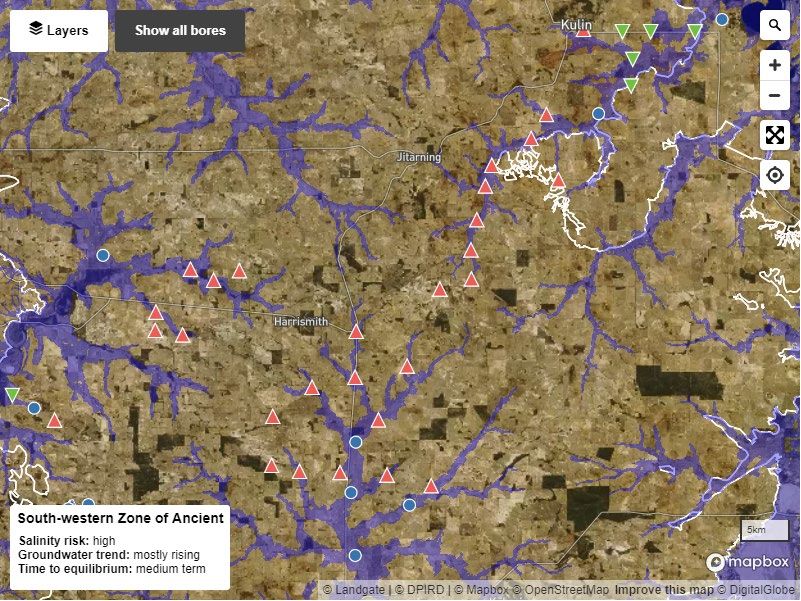
Extent and Risk - Mapping

ABS Census 1955-2002
Satellite maps 1998-2000
New planned 2019-2021

1 M ha severe
+ 1 M ha moderate/transient?

Interactive tools

2018 OAG Report
2019 Salinity Consultative Review

                                    9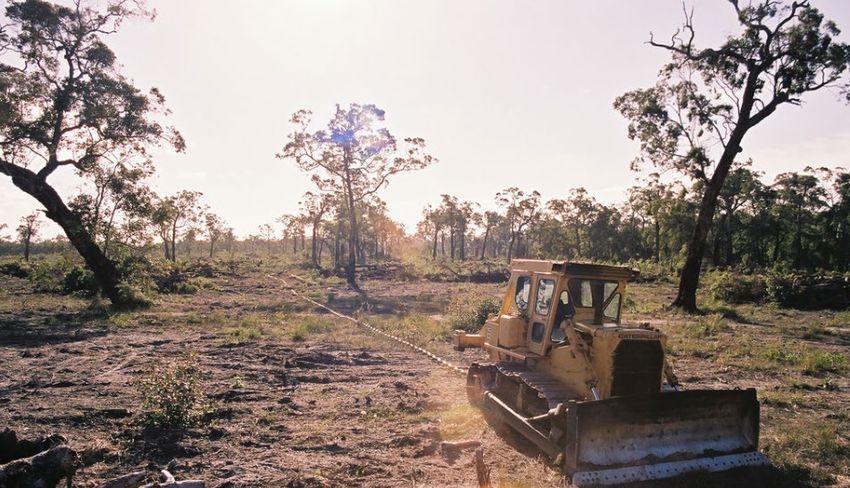
Extent and Risk - Mapping

ABS Census 1955-2002
Satellite maps 1998-2000
New planned 2019-2021

1 M ha severe
+ 2.8 M ha valley hazard

Interactive tools

2018 OAG Report
2019 Salinity Consultative Review

                                    10
2013
GRDC 2018 – main 5 soil constraints costing $330 ha or
$4.3 billion year (ROSA tool) with treatment enabling an
increase of 1 T/ha…
Salinity Chapter
First full review 2013
11Landcare, Regenerative Ag….
…adaptation to use more water … to create resilience
& regional development
New needs – e.g. GHGs like CO2
#ClimateSmartAg…wetter North …drier South…
1600
Perth dams -1% rain -3% 1400
runoff 1200
Rainfall (mm)
1000
~11,000 GL 800
600
(865 GL/a) 400
~200 TDS 200
0
1880 1900 1920 1940 1960 1980 2000 2020
Year
Annual rainfall 10 yr Mean Long-term Mean
186 GL
(68 GL/a)
2030
1300 TDS2016 – use ~ 300 GL/a $400m GVAP • Food & fibre crops • Cattle • Horticulture • Tree crops • Bush tucker
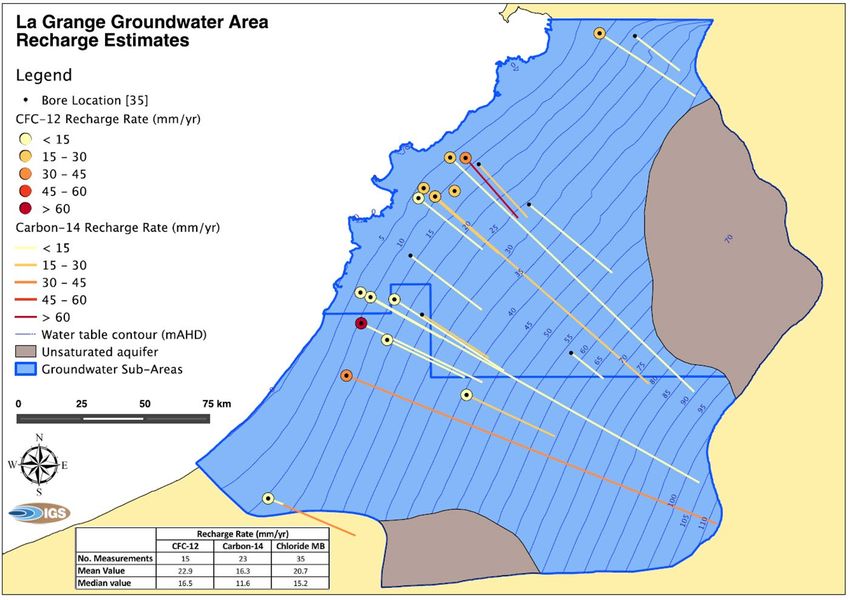
…Growing in the North (La Grange)…

…catalyst to respectful                                 Broome
                          Before project 3 GL used of
irrigated agricultural    50 GL available.
development…
                          After project 100% applied
                          for….
3 TOs & 7 Stations
2 Hort businesses
• Soils, chemistry, risks
• Regolith depths, aquifers, salinity, chemistry
• Aquifer use – modelling, saltwater interface
• Aquifer ages, recharge and hydrodynamics with
strong cultural recognition.Myalup
Grow
Stable
Less
$877 m GVAP
18
~350 GL40 T/ML 5-9 T / ML
Opportunities for growth and
                                           sustainability – to 2040 ?
• Water & food planning –
    •   Major international drivers in food supply and demand (quality): eg wheat.
    •   Changing food culture (vegan, paleo, ….)
    •   Increasing pressure on finite resources
    •   Recognising resource impacts & costs (energy) & market advantage

• Dryland - Better manage landscapes soil and water – RegenAg...

• Irrigation – growth – then unconventional water supplies
    •   Brackish water sources – and desalinisation
    •   Stormwater & wastewater - WWTP & MAR
    •   Mining & post mine closure – legacy opportunities
    •   Horticulture - protected cropping**
Contact
Work - PO Box 1231, Bunbury 6230.
Questions ? richard.george@dpird.wa.gov.au
M 0404 819 532
21/18Report Cards
https://www.agric.wa.gov.au/climate-land-water/resource-
assessment/report-card-conditions-and-trends
Salinity interactive model
https://www.agric.wa.gov.au/resource-
assessment/interactive-groundwater-and-salinity-map-
south-west-agricultural-region
La Grange case study
https://www.agric.wa.gov.au/assessment-agricultural-
expansion/la-grange-interactive-soil-and-groundwater-map
Myalup case study
https://www.agric.wa.gov.au/assessment-agricultural-
expansion/myalup%E2%80%93wellington-assessment-
expanded-irrigation
What www searchers are downloading - from Climate Land
and Water DPIRD website (August)
22Wheatbelt ‘average crop’ water balance – 400mm rainfall (1mm = litre/m2)
180 mm (transpiration to grain)
20
100 mm (Evaporation)
1mx1m
10 10 Minimum 10 + 10 mm (runoff & recharge)
100 mm (summer)
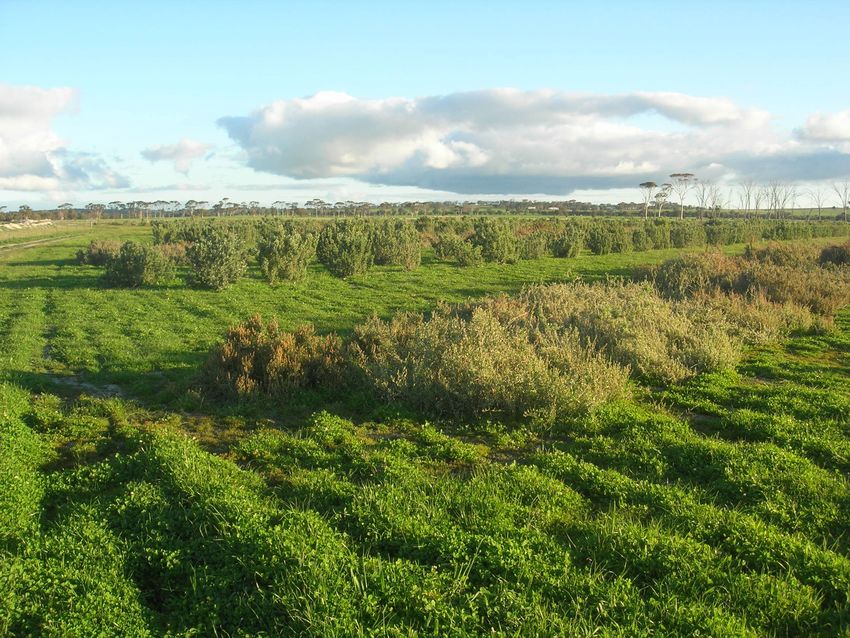
231963 Farm cleared Drilled 1993 Bluegums 1995 Harvest 2014-16
Highest t CO2-e/ha sequestration areas
Water Balance

   - ve (leaching)

   -ve (dry/runoff)

   -ve (water use)

-ve (runoff/recharge)
  -ve excess runoff

  -ve store/runoff

   -ve - all above

-ve lost water storage
       -ve runoff
 -ve groundwater26rise
What do we do with 60,000 GL… (aka 400mm) in wheatbelt agriculture………
You can also read