LIFE SCIENCE PORTFOLIO SALE - AUGUST 2021
←
→
Page content transcription
If your browser does not render page correctly, please read the page content below
T R A N S F O R M AT I O N A L
     LIFE SCIENCE
   PORTFOLIO SALE
        AUGUST 2021

           N Y S E : CIO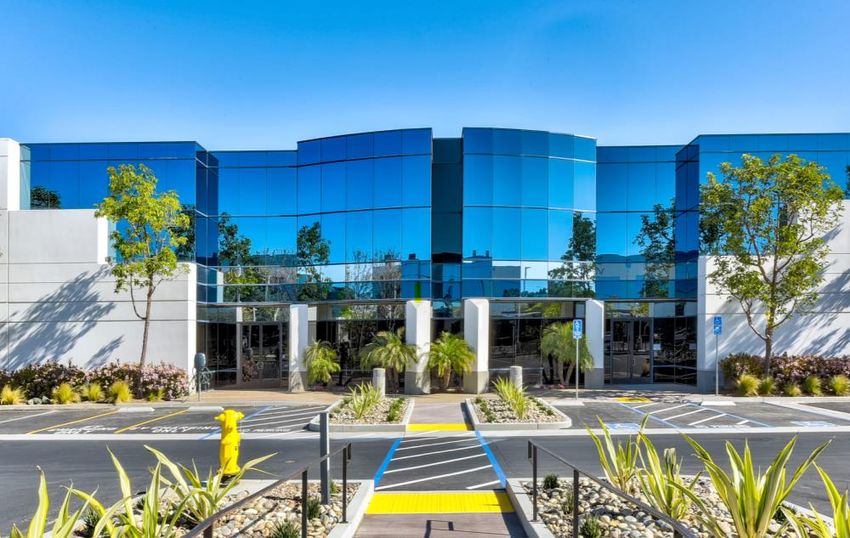
FORWARD-LOOKING STATEMENTS

This presentation contains certain “forward-looking statements” within the meaning of the Private Securities Litigation Reform Act of 1995, Section 27A
of the Securities Act of 1933, as amended, and Section 21E of the Securities Exchange Act of 1934, as amended. Certain statements contained in this
presentation, including those that express a belief, expectation or intention, as well as those that are not statements of historical fact, are forward-
looking statements within the meaning of the federal securities laws and as such are based upon City Office REIT, Inc.’s (“CIO” or the “Company”)
current beliefs as to the outcome and timing of future events. Forward-looking statements are generally identifiable by use of forward-looking
terminology such as “approximately,” “anticipate,” “assume,” “believe,” “budget,” “contemplate,” “continue,” “could,” “estimate,” “expect,” “future,”
“hypothetical,” “intend,” “may,” “outlook,” “plan,” “potential,” “predict,” “project,” “seek,” “should,” “target,” “will” or other similar words or expressions.
There can be no assurance that actual forward-looking statements, including projected capital resources, projected profitability and portfolio
performance, estimates or developments affecting the Company will be those anticipated by the Company. Examples of forward-looking statements
include those pertaining to expectations regarding the Company’s financial performance, including under metrics such as NOI and FFO, market rental
rates, national or local economic growth, estimated replacement costs of the Company’s properties, the Company’s expectations regarding tenant
occupancy, re-leasing periods, projected capital improvements, expected sources of financing, expectations as to the likelihood and timing of closing
of acquisitions, dispositions, or other transactions, the expected operating performance of the Company’s current properties, pro forma descriptions of
the Company and its operations, statements regarding net asset value, anticipated near-term acquisitions and descriptions relating to these
expectations, including, without limitation, the anticipated net operating income yield and cap rates, and changes in local, regional, national and
international economic conditions, including as a result of the ongoing COVID-19 pandemic. Pro forma, projected and estimated numbers are used for
illustrative purposes only, are not forecasts and may not reflect actual results. Forward-looking statements presented in this presentation are based on
management’s beliefs and assumptions made by, and information currently available to, management.
The forward-looking statements contained in this presentation are based on historical performance and management’s current plans, estimates and
expectations in light of information currently available to the Company and are subject to uncertainty and changes in circumstances. There can be no
assurance that future developments affecting the Company will be those that the Company has anticipated. Actual results may differ materially from
these expectations due to the factors, risks and uncertainties described above, changes in global, regional or local political, economic, business,
competitive, market, regulatory and other factors described in the Company’s news releases and filings with the U.S. Securities and Exchange
Commission (the “SEC”), including but not limited to those described in the Company’s Annual Report on Form 10-K for the year ended December 31,
2020 under the heading “Risk Factors” and in the Company’s subsequent reports filed with the SEC, many of which are beyond the Company’s control.
Should one or more of these risks or uncertainties materialize, or should any of the Company’s assumptions prove to be incorrect, the Company’s
actual results may vary in material respects from what the Company may have expressed or implied by these forward-looking statements. CIO
cautions that you should not place undue reliance on any of CIO’s forward-looking statements. Any forward-looking statement made by the Company
in this presentation speaks only as of the date of this presentation. Factors or events that could cause the Company’s actual results to differ may
emerge from time to time, and it is not possible for the Company or its management to predict all of them. The Company does not guarantee that the
assumptions underlying such forward-looking statements contained in this presentation are free from errors. Unless otherwise stated, historical
financial information and per share and other data are as of June 30, 2021 or relate to the quarter ended June 30, 2021. The Company has no
obligation, and does not undertake, to publicly update any forward-looking statement, whether as a result of new information, future developments or
otherwise, except as may be required by applicable securities laws.

                                                                                                                                                              2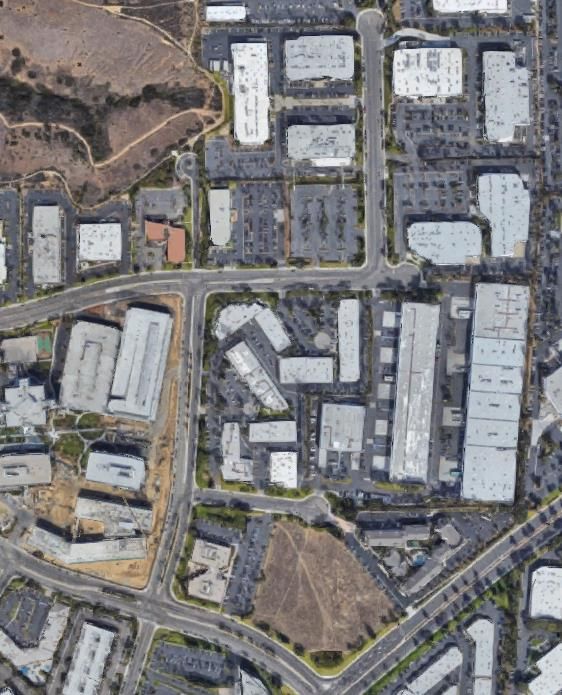
HIGHLIGHTS OF TRANSFORMATIONAL SALE

                                             Sale of All of CIO’s San Diego Life Science Assets for $576 Million
      CIO’s focus on enhancing its life science portfolio has generated a ‘home-run’ for shareholders

                ❑     Gross sale price of the two transactions totals $576 million (1)

                            ❑     $395 million first closing scheduled for December 2021 (“North Disposition”) (2)

                            ❑     $181 million second closing scheduled for February 2023 (“South Disposition”) (2)

                ❑     Net proceeds, after estimated closing and transaction costs, of approximately $546 million ($12.38 per share) (3)

                ❑     Gain on sale of approximately $430 million ($9.75 per share) based on $116 million cost base (3)(4)

                ❑     Agreements include a performance guaranty from a creditworthy private equity fund and $29 million of cash deposits                                                               (5)

      Magnitude of sale proceeds transforms CIO’s financial position

                ❑     Mid-$20’s estimated net asset value per share of CIO common stock based on net proceeds

                ❑     Generates net proceeds nearly equal to CIO’s entire corporate debt outstanding as of June 30, 2021

                ❑     Strengthens balance sheet and leverage metrics

      Ability to enhance portfolio with high-quality future acquisitions to drive predictable cash flow growth

                ❑     Assets being sold are unencumbered by debt; all net proceeds available to reinvest / distribute to shareholders

                ❑     Management focus on redeploying into premier properties with high-quality cash flow

                            ❑     Great locations, credit tenants and long/committed lease terms

                ❑     Pathway to significantly enhanced net asset value and earnings per share growth

                ❑     Transaction positions CIO for potential dividend growth and/or special distributions

(1)   Sale pursuant to two separate purchase and sale agreements. Closings are subject to customary closing conditions
(2)   CIO may accelerate a closing with 45 days notice in order to accommodate an efficient redeployment of proceeds
(3)   Based on 44.1 million common shares outstanding as of June 30, 2021
(4)   Cost base represents book value of Sorrento Mesa assets and liabilities plus working capital as of June 30, 2021
(5)   Each buyer is a joint venture with an experienced private equity investor that has over $30 billion of assets under management. A creditworthy subsidiary of the private equity investor has provided a   3
      guaranty for the payment and performance of certain of each buyer’s obligations, including specific performance and damages remedies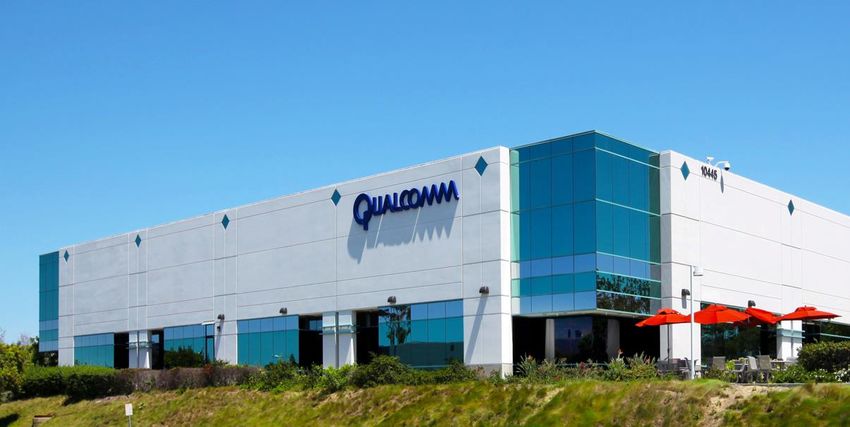
BACKGROUND ON SALE
                                                                                                          2    4
    Strategic land assembly and CIO’s value-add leasing                                               1               5
                               Sale of
     created an exciting opportunity  forAll of CIO’s
                                          a buyer     San Diego Life Science
                                                  to build            NORTH  Assets for $576 Million
      immediate scale in a leading life science location
                                                                     DISPOSITION                          3
                                                                      $395 million

     1      2      3      4      5      6                                      Circle Point, Denver
                                                                                                      7
❑    Acquired in 2017 as part of the San Diego Portfolio
❑    1-5 are life science or R&D buildings
❑    6 is a vacant land parcel zoned for life science development

    7      8
                                                                      QUALCOMM
❑    Acquired in 2021 to strategically enhance existing holdings    HEADQUARTERS
❑    7-8 are traditional office buildings located on infill
     development land zoned for life science development

                                                                                                                 SOUTH
                                                                                                              DISPOSITION
                                                                                             8                 $181 million
❑    Two embedded development sites, zoned for over one
     million square feet of life science development potential                                            6
❑    12.7 acres of development land, in total

                                                                                                                          4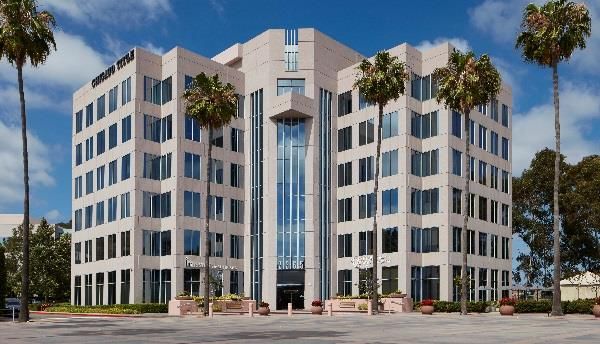
CREATION OF SHAREHOLDER VALUE

                                                  Enormous Growth in Estimated Net Asset Value Per Share
      ❑   The following table illustrates various share prices and the implied portfolio cap rates on CIO’s office assets

      ❑   In today’s market, CIO estimates that its properties range from a ~5% cap rate for premier properties in the most desirable
          locations with long-term credit tenants to ~8%+ for a small number of value-add assets requiring near-term leasing

      ❑   A $24.00 Net Asset Value per share equates to a blended ~7.0% cap rate on CIO’s office portfolio
                                (in millions)
                                Pro Forma Net Asset Value Per Share Range                                              $         22.00 $             24.00 $              26.00
                                                                                                           (1)
                                Market value of common equity using share price assumption                                       970.4             1,058.6              1,146.8
                                Liquidation preference of preferred equity                                                       112.0               112.0                112.0
                                CIO share of net debt at June 30, 2021 (2)                                                       574.1               574.1                574.1
                                Expected net proceeds from Sorrento Mesa sale (3)                                               (546.0)             (546.0)              (546.0)
                                Implied enterprise value                                                                       1,110.5             1,198.7              1,286.9
                                                                   (4)
                                Book value of remaining land                                                                      (7.3)               (7.3)                (7.3)
                                Working capital adjustments (5)                                                                   36.7                36.7                 36.7
                                Implied asset value - office portfolio                                                $        1,139.9 $           1,228.1 $            1,316.3

                                2021 Cash Net Operating Income (NOI) Guidance Without Sorrento Mesa
                                2021 Net Operating Income guidance - midpoint (2)             $     105.3 $                                           105.3 $             105.3
                                Less: 2021 termination fees (non-recurring)                          (8.0)                                             (8.0)               (8.0)
                                Less: non-cash GAAP adjustments within guidance (6)                   -                                                 -                   -
                                Less: minority interest                                              (1.7)                                             (1.7)               (1.7)
                                2021 Cash NOI guidance - excluding termination fees                  95.6                                              95.6                95.6

                                Elimination of Sorrento Mesa 2021 cash NOI in guidance                                             (9.2)               (9.2)                (9.2)
                                Pro forma cash NOI - office portfolio                                                 $            86.4 $              86.4 $               86.4

                                Implied Cap Rate - office portfolio                                                                7.6%                7.0%                 6.6%
                                                                                        (7)
                                Implied Price Per Square Foot - office portfolio                                      $             220 $               237 $                254

(1)   Based on 44.1 million common shares outstanding as of June 30, 2021
(2)   Please reference the Company’s Q2 2021 earnings press release and financial supplement for further discussion of the material assumptions and reconciliations underlying the Company’s guidance and calculations
(3)   Represents aggregate gross proceeds of $576 million less $30 million of estimated closing and transaction costs, some of which may be spent prior to closing
(4)   Deducts the book value of the Company’s land holdings at FRP Collection, Intellicenter and Circle Point to isolate the Company’s office assets
(5)   Working capital adjustments – Add: Rents Receivable & Other Assets; Less: Straight Line Rent Receivable, Accounts Payable and Accrued Liabilities, Deferred Rent, Tenant Rent Deposits and Other Liabilities
(6)   Includes net impact of straight line rent adjustment and above and below market leases                                                                                                                     5
(7)   Based on approximately 5,178,000 net rentable square feet of the office portfolio as of June 30, 2021, after the sale of Sorrento Mesa
SIGNIFICANTLY ENHANCED FINANCIAL POSITION

                     Sorrento Mesa Net Sale Proceeds Nearly Equal to CIO’s Entire Corporate Debt Outstanding

      ❑    To illustrate the magnitude of the balance sheet enhancement from this transaction, the chart below provides CIO’s pro forma
           leverage ratios assuming the transaction closed June 30, 2021 and all net proceeds were initially used to reduce net debt

                                                                                                                                   June 30,                Sorrento                         Pro
                 (in millions)                                                                                                       2021                  Mesa Sale                       Forma
                   Assets:
                      Real estate properties, net                                                                              $           983.3                     (109.2)           $       874.1
                      Cash, cash equivalents and restricted cash                                                                            36.3                      546.0                    582.3
                      Combined other assets (1)                                                                                            108.6                       (8.8)                    99.8
                           Total Assets                                                                                        $         1,128.2                                       $     1,556.2

                   Liabilities:
                      Debt                                                                                                     $           612.5                                       $       612.5
                                                 (2)
                      Combined other liabilities                                                                                            62.3                         (2.3)                  60.0
                   Equity:
                          Total Equity                                                                                                     453.4                      430.3                    883.7
                          Total Liabilities and Equity                                                                         $         1,128.2                                       $     1,556.2

                 Leverage
                 CIO share of net debt (CIO share of debt principal less cash)                                                             574.1                     (546.0)                       28.1
                                                                                                                                                                                 (4)
                 Annualized Adjusted EBITDA                                                                                                 92.5                       (9.8)                       82.7

                 Net Debt including Restricted Cash/Annualized Adjusted EBITDA                                                               6.2x                                                  0.3x

                                                                                                        (3)
                 Net Debt to Enterprise Value including Restricted Cash                                                                    46.5%                                                   4.1%

(1)   Combined other assets include rents receivable, deferred leasing costs, acquired lease intangible assets and other assets
(2)   Combined other liabilities include accounts payable and accrued liabilities, deferred rent, tenant rent deposits, acquired lease intangible liabilities and other liabilities
(3)   Net Debt to Enterprise Value including Restricted Cash calculated based the June 30, 2021 closing stock price of $12.43 per share of common stock                                                   6
(4)   Annualized Adjusted EBITDA attributable to Sorrento Mesa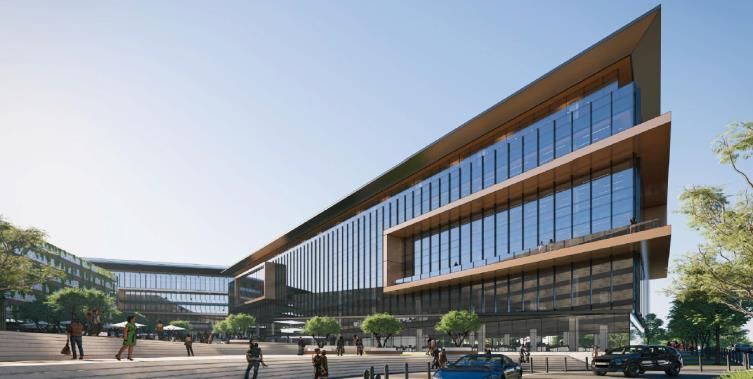
REINVESTMENT PLAN AND DIVIDEND POLICY

              Further Enhance Portfolio with Premier Properties Providing High-Quality Cash Flow

❑   CIO will target acquiring additional office properties in the most desirable locations and with excellent credit, long-term
    tenants and predictable cash flow

       ❑   CIO’s existing market footprint provides excellent exposure to high growth cities in the Southern and Western US

               ❑   Continue to build portfolio across CIO’s existing markets as well as other markets with similar dynamics

       ❑   In-line or superior quality to CIO’s highest quality and lowest risk assets

       ❑   Attractive risk/return profiles achieved through careful and disciplined underwriting

       ❑   Phased sale of the North Disposition and the South Disposition provides for efficient redeployment over time

❑   Potential for dividend growth and/or special distributions

       ❑   CIO will seek to prudently deploy capital into investment opportunities, leading to higher earnings per share. Execution of
           this strategy will position CIO to pay elevated future dividends

       ❑   In the event that CIO elects to not fully invest in replacement properties, investors may also participate in the gains
           through future special cash distributions

    CIO’s strategic assembly, enhancement and disposition of the Sorrento Mesa portfolio
    has unlocked tremendous value for shareholders, positions the company for elevated
    future dividends and provides the opportunity to reinvest in premier properties across
                                                       our growing markets

                                                                                                                                         7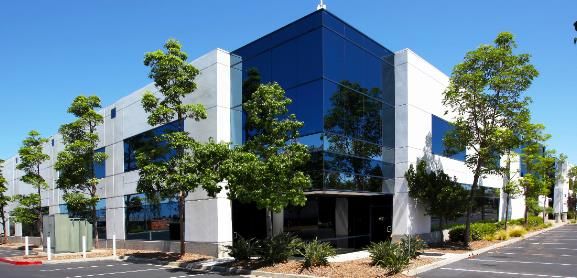
POST-SALE PORTFOLIO COMPOSITION                                                                                                   (1)

               City Office owns high-quality office properties in 18-hour cities in the Southern and Western United States
      ❑      The sale and redeployment positions CIO to complement and elevate the quality of its office portfolio through acquisitions across some of
             the highest employment and population growth cities in the south and west
                                                                                                                                                                                         Annualized
                                                                                                                                                                  No. of       NRA       Base Rent
               4%            SEATTLE, WA                                                                                                     Market              Buildings   (000s SF)     (000s) (3)

                                                           CIO MARKETS (2)                                                                   Phoenix, AZ             22       1,214        $30,589
           PORTLAND, OR
                                                                                                                                             Tampa, FL                   5    1,041        $26,012
                    7%
                                                                                                                                             Denver, CO                  6     807         $15,103

                                                                                                                                             Orlando, FL                 8     720         $16,720
                                             DENVER, CO
                 SAN DIEGO, CA                                                                                                               Dallas, TX                  4     577         $11,910
                                                  12%
                                                                                                                                             Portland, OR                5     331         $7,902
                      7%      PHOENIX, AZ                                                          ORLANDO, FL
                                                             DALLAS, TX                                                                      San Diego, CA               4     281         $7,951
                                  25%                                                                             14%
                                                                 10%                                                                         Seattle, WA                 3     207         $4,650
                                                                                          TAMPA, FL
                                                                                                                                             Total                   57       5,178       $120,837
                                                                                              21%

(1)       All information as of June 30, 2021, assuming the close of the Sorrento Mesa sale
(2)       Percent of portfolio annualized base rent
(3)       Annualized base rent is calculated by multiplying (i) rental payments (defined as cash rents before abatements) for the month ended June 30, 2021 by (ii) 12
                                                                                                                                                                                                        8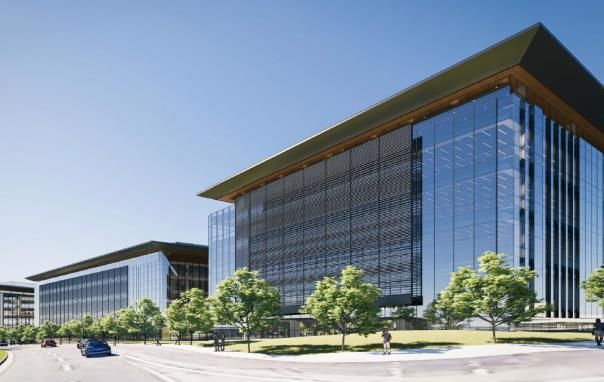
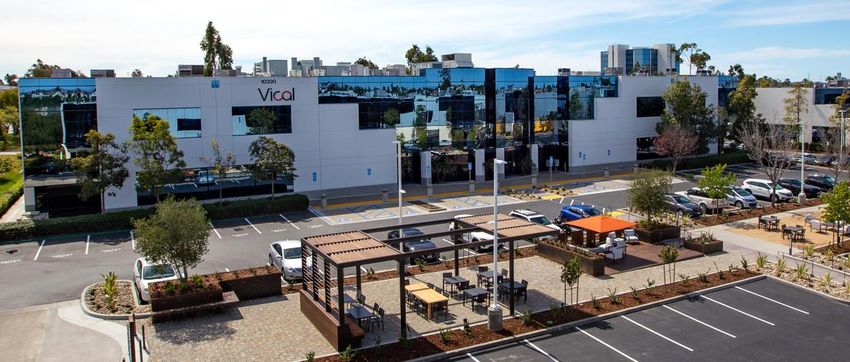
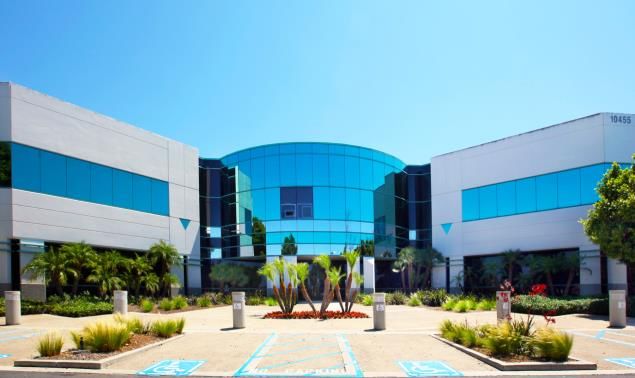
Select Sorrento Mesa Property Photos

Conceptual Development Rendering       Conceptual Development Rendering
C I T Y O F F I C E R E I T, I N C .
E: investorrelations@cioreit.com | T: 604 806 3366
You can also read