LIFESTYLE TRENDS & TOURISM - HOW CHANGING CONSUMER BEHAVIOUR IMPACTS TRAVEL TO EUROPE - European Travel Commission
←
→
Page content transcription
If your browser does not render page correctly, please read the page content below

LIFESTYLE TRENDS & TOURISM
HOW CHANGING CONSUMER BEHAVIOUR
IMPACTS TRAVEL TO EUROPE

CONTENTS
EXECUTIVE SUMMARY ���������������������������������������������������������������������������������������������������������������������������������� 7

1. THE DRIVERS OF CHANGING CONSUMER LIFESTYLES ������������������������������������������� 10

2. THE END OF ADVENTURE? ��������������������������������������������������������������������������������������������������������������� 46

3. CONSTRUCTIVE TOURISM ����������������������������������������������������������������������������������������������������������������� 70

4. SOCIAL LIVING �������������������������������������������������������������������������������������������������������������������������������������������� 98

5. PERSONALITY WITHOUT PEOPLE ������������������������������������������������������������������������������������������� 118

6. NO ESCAPE ������������������������������������������������������������������������������������������������������������������������������������������������� 140

APPENDIX ���������������������������������������������������������������������������������������������������������������������������������������������������������� 151

                                                                                                                              2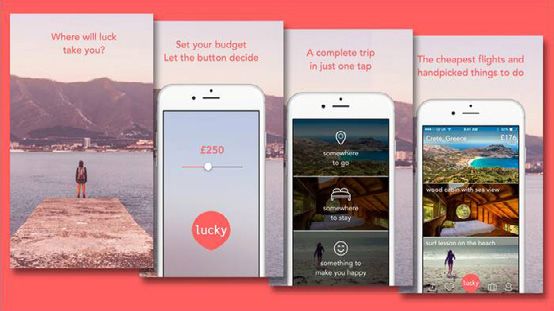
Lifestyle Trends & Tourism
How changing consumer behaviour
         impacts travel to Europe
                       A report produced by the
                   European Travel Commission
                        and Future Foundation,
                               in a series of five
                         trends-based sections.

                     THE END OF ADVENTURE?
                      CONSTRUCTIVE TOURISM
                               SOCIAL LIVING
                PERSONALITY WITHOUT PEOPLE
                                 NO ESCAPE

                             Brussels, May 2016

           3
Copyright © 2016 European Travel Commission

Lifestyle Trends & Tourism – How changing consumer
behaviour impacts travel to Europe

All rights reserved. The contents of this report may be
quoted, provided the source is given accurately and
clearly. Distribution or reproduction in full is permitted for
own or internal use only. While we encourage distribution
via publicly accessible websites, this should be done via a
link to ETC’s corporate website, www.etc-corporate.org.

The designations employed and the presentation of
material in this publication do not imply the expression of
any opinions whatsoever on the part of the Executive Unit
of the European Travel Commission.

   Data sources: This report is based on research
   conducted by Future Foundation (www.
   futurefoundation.net) and should be interpreted by
   users according to their needs

Published by the European Travel Commission
Rue du Marché aux Herbes, 61,
1000 Brussels, Belgium
Website: www.etc-corporate.org
Email: info@visiteurope.com

This report was compiled and edited by:
Nick Chiarelli, Consultancy Director, and Shaina Yang,
Senior Analyst, Future Foundation, under the supervision
of Stefanie Gallob, ETC Executive Unit, on behalf of the
European Travel Commission.

The European Travel Commission thanks all contributors,
especially Emöke Halassy, Hungarian Tourism Ltd.,
Helena Varona and Cristina Salsinha, Turismo de
Portugal, of the ETC Market Intelligence Committee.

Cover: Global Shares Trends Ideas Sales Solution
Expertise Concept ©Rawpixel.com

ISBN: 978-92-95107-06-9

                                                                 4
FOREWORD
    In today’s volatile economic climate, changing consumer
    behaviours have an increasing impact on global
    commerce. The speed of consumer change, the blurring
    of traditional demographic boundaries, the growing power
    of the consumer through technology and the nature of
    globalisation are making trend determination and their
    adequate exploitation essential for success. This is
    particularly important in the tourism sector, where the
    traveller’s selection of goods and services is instrumental
    for living an experience. Shifts in consumers’ travel
    attitudes and behaviour in terms of experiences sought
    and responses to marketing messages will ultimately
    impact their travel product and destination choices.

    The European Travel Commission (ETC) has a long history
    of gathering intelligence on Europe’s key overseas travel
    markets. However, travellers’ choices are changing
    rapidly. Acknowledging the need to capitalise on long-
    term behavioural and attitudinal consumer lifestyle
    trends, ETC commissioned Future Foundation to gather
    new and meaningful insights on opportunities in long-
    haul markets suitable for action in the European tourism
    sector.

    This report aims to provide meaningful information to
    ETC members, the 32 National Tourism Organisations of
    Europe, and contributes to better adapting to consumer
    needs in long-haul markets. Results are also meant to
    feed into ETC’s promotion of the VisitEurope.com portal
    and its long-term strategy ‘Destination Europe 2020’.

                                           Dr. Peter De Wilde
                                                    President
                                 European Travel Commission

5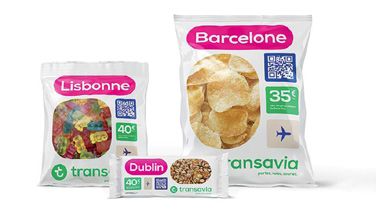
Introduction
Consumers around the world are changing rapidly, in all kinds of ways, and the ways in which marketers attempt to
communicate with them is having to change to keep up. They are, for example, becoming more and more demanding
of the products and services they buy, more and more tech-enabled and more time pressured. They have less and less
time in which to make decisions but higher and higher expectations that those decisions will prove to have been the
right ones.

The moments when consumers have the time or inclination to engage with advertising are evolving. No longer do they
only take in the home but, instead, can take place anytime or anywhere where there is a decent internet connection,
placing ever greater pressure on marketers to ensure that their message is neither skipped altogether nor disregarded.

Additionally, the tools via which consumers engage with advertising and their expectations of what advertising can do
for them, are placing more and more pressure on marketers to come up with innovative ways to get their messages
across and an ever-increasing need to focus marketing content on the specific needs and interests of the individual,
instead of marketing to segments or mass populations.

As is the case for marketers across all product sectors, national tourism organisations (NTOs) face significant
challenges to their activities. NTOs within Europe have signalled their commitment to, first, understanding, and
secondly, to responding to these consumer changes with new tools, messages and usage of new channels.

The End of Adventure? is the first of five Consumer Lifestyle Trends which together form the core of the Lifestyle
Trends & Tourism Report – a comprehensive research project that provides a future-facing summary of the most
important consumer changes impacting travel to Europe, particularly from the key markets of China, Brazil, the
USA and Canada. The full report has been produced following a detailed programme of both primary and secondary
research; further details of the research methodology are included in the Appendix.

Whilst the report is intended to form one cohesive body of work – including an opening chapter on contextual drivers –
each individual Trend Chapter offers its own data analysis, qualitative research, case studies of how changes are being
leveraged within the travel industry, and recommendations for how NTOs and destination marketers should respond.

Here, The End of Adventure? is presented on its own. In this chapter, we explore broad attitudes towards risk and
control – and the subsequent behaviours that both help and hinder the global traveller’s pursuit of adventure.

Please note that page and heading numbers have been preserved to reflect this chapter’s original place in the full
report.

                                                           6
2. THE END OF ADVENTURE?
How has the consumer’s relationship with risk and 2.2 Adventure Reloaded, which re-emphasises why
control changed? How have new behaviours around adventure still is important to consumer travel,
tracking, planning and indeed Googling come to affect as well as how this has turned authenticity into a
the way attitudes about risk and reward are formulated? necessity for travel rather than simply a benefit. We
And indeed, how are consumers coming to see explore new behavioural trends that consumers are
adventure, in a world where risk-minimisation is so easy exhibiting which help them embed the feeling of
that there may be an identifiable trend in risk-aversion? authentic adventure into travel, including:
In this section we will introduce four trends that explain 2.2.i Last-Minute Living, which explores rising
what the phenomenon of The End of Adventure is, behaviours that suggest the planning cycle is
where it comes from, how it impacts travel and where it getting shorter and shorter – as well as far
will go next. This will span two key sections as follows: more volatile.
2.1 The Death of Risk, which explains how consumers 2.2.ii Surprise Me!, which shows how impulse
are turning away from high-risk choices in favour of and adventure are sought even before travel
safer ones, yet retaining positive attitudes towards begins, manifesting in the inspiration and
cultural conceptions of risk-taking – and why this discovery phase as well – where consumers
could negatively impact travel. We then explore how are increasingly looking for institutions to
control plays into this, with: provide them surprise.
2.1.i Cruise Control, which explores how attitudes Throughout, regional, demographic and behaviour-
towards control are driving both risk-averse influenced differences will be highlighted – as well as
behaviour as well as maximising aspirations. core implications that focus on the four travel stages of
Inspiration & Discovery, Booking & Planning, Journey,
2.1.ii Mobile Control, which explores the and In-Destination.
behavioural manifestation of those attitudes –
finding that tomorrow, it will increasingly turn
to technology.
2.1 THE DEATH OF RISK
Almost universally, risk-averse attitudes are common – particularly regarding bodily safety, where almost 2 in 3 global
respondents on average agree that people should prioritise it above fun or adventure. This does not reflect a true social
change so much as a baseline: that consumers today are largely unwilling to consider compromising their safety.
“How strongly do you agree or disagree with the following statements?
People should think about safety before fun/adventure” | 2015 REGIONAL DIFFERENTIATION
Disagree Strongly Disagree Neither Agree nor Disagree Agree Agree Strongly
Looking at cross-regional
differences may be
100%
informative to local cultural
priorities: China shows an
80% extraordinary 86% agreement,
and not a single respondent
60% disagrees strongly.
40% However, the proportion of
those who disagree in total is
very small across the board,
20%
with little differentiation
between markets.
0% Overall, there is a cultural
understanding of personal
20% responsibility.
40% Global European Brazil China Canada USA
average average
Source: nVision Research | Base: 1000-5000 online respondents per country aged 16-64 (Indonesia & S. Africa 16-54), 2015 February
46Notably, millennials were not found to differ significantly in this regard from the total population in any market.
Acknowledging that safety will always be a foremost priority to anyone, it is still nevertheless interesting to observe this
from a cohort that historically reflect higher propensity towards risk-taking and tend to express risk-friendly attitudes.
IMPLICATIONS: INSPIRATION & DISCOVERY
When travelling, consumers always have a heightened awareness of their own safety. But when choosing a destination,
safety and risk are important considerations as well. Europe benefits greatly as a tourist destination from this
standpoint; consumers are far less likely to fear for their personal safety when considering such destinations.
Marketing which overtly emphasises the safety of a destination may actually be well-received. This is particularly the
case with Chinese tourists and older tourists, whose safety and risk concerns index much higher than average – and
who additionally are unlikely to see their own risk-aversion as a source of shame.
But why is this relevant to travel?
We see that despite a reality of risk-averse consumers, there is a generalised cultural positivity towards the idea of risk
– a conception of glamour that surrounds risk and risk-taking. We see this across markets:
“How strongly do you agree or disagree with the following statements?
I am prepared to take significant risks to have what I want out of life” ASPIRATION VS REALITY
% who agree or strongly agree 2015
The discrepancy between those
100% Strongly Agree Agree who strongly agree and those
who just agree is crucial here.
80% We find that those who only
agree are more likely to be
expressing an aspiration rather
than a concrete commitment
60% to significant risk – leaving just
1 in 10 globally whose strong
agreement gives any indication
of real behaviour.
40%
As will be covered further on,
behaviours are decidedly anti-
20% risk even amongst those who
say they are willing to take it.
0%
Global European Brazil China Canada USA
average average
Source: nVision Research | Base: Global average (1000-5000 online respondents per country) aged 16-64, 2015 February
High volumes reflect aspirational attitudes towards risk. Further on, we confirm this; actual proof of risk-taking
behaviour is slim within our research - whilst proof of risk-averse, control-positive behaviour is rampant.
Qualitative research also shows that for the global consumer, there is an unwillingness to relinquish control – often
particularly when it comes to travel. From Brazil, we see that despite high levels of agreement to being prepared to take
significant risk, qualitative accounts of travel norms do not match.
“Online [sources] influence where this [common] traveller will choose to stay, hang out and the people whom he/she
will socialize with ... That is as opposed to the backpacker, but generally, Brazilians aren’t that fond of the backpacking
style, especially not when it comes to long-haul travelling. It’s expensive to go abroad so if you’re making that
investment once a year, you might as well guarantee that everything will go as planned.”
TIAGO, SAO PAOLO
47Claims of risk-friendliness must therefore be taken as a serious factor: not a serious commitment to actual risk-taking,
but a serious declaration of an attitudinal aspiration that is important to the traveller’s identity.
This poses the core of the End of Adventure dilemma for consumers: the underlying cultural glamourisation of risk is
as crucial to positive experiences of travel as the reality of risk-averse habits.
Intuitively, we can see how this could lead to the heightening of particularised expectations and the dampening of intensity
within the experience – whether consumers themselves are conscious of this consequence or not. And whilst some
markets are more susceptible to active disappointment as a consequence, all indicators in this section show that there is an
empirical level at which consumer travel experiences would be improved by fulfilment of their adventure-seeking.
REGIONAL DIFFERENTIATION
Currently, some markets are more susceptible to feeling frustration around their own control-seeking
than others; we find that inbound tourists to Europe from the USA and Canada are particularly at risk for
dissatisfaction here.
“Consumers in NYC and in the US generally are tech-savvy and “Even if we travel to known
information-obsessed, driven to find out information about every destinations, we are always
destination before they go there. We are a wary market and this, I looking to discover new things
think, results in The End of Adventure.” about them.”
ANABELLE, NEW YORK CITY FEMALE, 46, TORONTO
This is to be expected, as those from Brazil and China are simply more likely to find intense cultural differences
during their travels – in addition to both countries’ being in the first generation of having a significant middle class.
But indicators exist to suggest that this may become a similar problem in the latter two markets in the longer-
term future – particularly China, where Mobile Control is fast-rising. It may be only a question of time as to when
a body of upcoming Chinese travellers could face the same struggle with disappointment.
“There has been a big … leapfrog development of Chinese outbound tourism. While most Chinese travellers still
rely on travel agents to arrange travel, in the future there will be more and more travellers who use the internet
and mobile devices to make travel arrangements with greater personalisation. … I believe advanced technologies,
improved economic position and globalised view points are the real influences in people’s attitude towards travel.
People lead trends with their demands, not the other way around ... [and] the speed at which China is changing
constantly amazes me.”
XIAOLEI, SHANGHAI
The following sections explore further factors threatening adventure in all markets – before going on to identify where
new inlets to adventure can be found.
2.1.i CRUISE CONTROL
Cruise Control is the foremost emerging attitude which contributes to global Death of Risk. At its crux is an emerging,
socially-driven attraction to control. Today, control is no longer a tool with which to achieve success; instead, it is largely
viewed as an end goal, a form of success in itself which must be attained.
“I think that the desire to be in control is very basic and human, and something that is ingrained. However, I think that
reputation is certainly a big part of it – it's interconnected, because if you can keep control of your reputation, you can
steer your trajectory in life.
With the advent of the internet, reputation has become much more prominent and the need to control it not only in
person but also online is something new that most of us have to deal with.”
FEMALE, USA Source: nVision Qualitative Research, 2015
48We see that majorities across the world agree that they try to appear in control at all times – reflecting an existing
social pressure.
“How strongly do you 100% Strongly Agree Agree
agree or disagree
with the following 80%
statements?
I try to appear in 60%
control of my life
at all times” 40%
% who agree or
strongly agree, 2015 20%
0%
Global European Brazil China Canada USA
average average
Source: nVision Research | Base: 1000-5000 online respondents per country aged 16-64 (Indonesia & S. Africa 16-54), 2015 February
We also find that those who agree that they try to appear in control at all times are also more likely to be risk-averse –
something we already intuitively understand. In a world where appearing in control is an imperative, it follows that risk-
taking becomes even less attractive beyond just risk in itself; it potentially could threaten social standing.
“How strongly do you 100% Non-control-conscious Control-conscious
agree or disagree
with the following 80%
statements?
People should think 60%
about safety before
fun/adventure” 40%
% who agree or
strongly agree, 2015 20%
0%
Global European Brazil China Canada USA
average average
Source: nVision Research | Base: 1000-5000 online respondents per country aged 16-64 (Indonesia & S. Africa 16-54), 2015 February
And overall, we see control-oriented behaviours being exhibited across product categories and indeed spheres of life.
Perhaps due to the availability of tools to help achieve total life control – from calorie counters to self-help books – we
see a huge range of goals now subjected to the overwhelming need to manage and control.
“If you could better manage any of the following things in your life which
would you choose? Please rank your top three and then indicate any others WISHLIST FOR CONTROL
that you would also choose.” | % who say they need to manage each option
Ranked in order of preference by total average | 2015 It is unsurprising that most
want to better manage their
0% 20% 40% 60% 80% 100%
personal finances.
My personal finances
However, other options carry
My mood/emotions stronger insight into the global
consumer cohort: particularly
My career progress the widespread need to
manage mood and emotion.
My weight This is non-discriminatory
across age groups; with the
My stress levels exception of Millennials, who
tend to prioritise their career
The amount of sleep I get progress higher due to their
lifestage, we see that mood
My appearance
and emotion are priorities for
management above arguably
My personal impact on the environment
more typical categories of
My alcohol consumption
stress, weight and appearance.
Millennials
Generation X
My social media profile Baby-boomers
Source: nVision Research | Base: Global average (1000-5000 online respondents per country) aged 16-64, 2015 February
491 in 2 global consumers indicate that they would like to better manage their mood and emotions. Significantly, this also
shows very little fluctuation across demographics; the difference between Baby-boomers (51%), Generation X (54%) and
Millennials (55%) is not significant.
IMPLICATIONS: JOURNEY
Consumers are showing a strong need for control over their own emotional states.
As is well-known in the industry, there are obvious emotional stressors involved in the journey itself – from long
layovers to fear of flying. Whilst it’s obvious that it is the job of industry leaders to help tourists manage their
emotional stress in these situations, it is becoming apparent that strategies to do so must revolve around empowering
consumers to take control themselves.
We see a parallel decline in indulgence as a universal good. Today, indulgent behaviour seems like a niche appeal to a
personality type at best, rather than being any kind of universal good. As over 1 in 2 wish to better manage their own
mood and emotions, we begin to see why: pleasure is increasingly harder to justify in a Cruise Control climate.
“How strongly do you agree or disagree with the following statements?
I love any excuse to have a celebration” | 2015 REGIONAL DIFFERENTIATION
Disagree Strongly Disagree Neither Agree nor Disagree Agree Agree Strongly
100% We can see that there is a
measurable difference in
80% attitudes between age groups
in Europe and North America.
60%
40% However, outside of Western
cultures, the same assumptions
20% about younger consumers
finding “any excuse” to have
0%
fun show little if no traction.
20% Whilst Chinese consumers
seem fairly ready to celebrate,
40% their millennial cohort do not
show a significant difference to
60%
Global average
Global Millennials
European average
European Millennials
Brazil
Brazil Millennials
China
China Millennials
Canada
Canada Millennials
USA
USA Millennials
the total. Brazilian millennials
80% share this trait, but also reflect
much lower agreement overall
100% – as well as significantly higher
disagreement than other
markets.
Source: nVision Research | Base: 1000-5000 online respondents per country aged 16-64 (Indonesia & S. Africa 16-54), 2015 February
We see that across nations, it tends to be about 2 in 5 that agree that they “love any excuse” to celebrate – in other
words, they’re happy to justify it for its own sake. It’s approximately a quarter of respondents that will actively disagree
with this – in other words, disapproving of the concept.
But the need for control isn’t necessarily viewed as a bad thing by many – although the pressures that are involved are
clearly strong, they are often embraced rather than rued. Qualitative research shows that in faster-paced markets,
control is viewed in a resoundingly positive light, rather than feeling like an oppressive social expectation.
“I really have a desire to be in control of my “[Control] has been in my life for the past couple of years [since
life, because it means better quality of life. beginning work] and the sense of independence and responsibility
I have this kind of desire since high school, drives this desire. I have to be a perfect time manager in order to
when my life was occupied by textbook finish my work duties as an engineer ... home management and health
studying. I think the desire to be in control monitoring are essential parts of one’s daily life. I would not call it
is one of the most fantastic things.” reputation exactly; it’s more of sense of responsibility and confidence.”
MALE, 25, CHINA FEMALE, 27, UAE
Source: nVision Qualitative Research, 2015
50IMPLICATIONS: BOOKING & PLANNING
A control-conscious consumer is one who will be eager to plan their travels well ahead. But particularly with Brazil,
Canada and the USA, the social pressure to appear in control will affect them particularly strongly as well – they will
also be interested in taking charge of their travels with less overt guidance.
Crucially, control-conscious consumers will demand what may look like a paradox: wanting to go on a trip that is
well-organised and tightly controlled – but also wanting to be the source of that organisation as well. Tour groups and
all-inclusive packages that lay out even the most attractive of plans may find themselves clashing with newer aspects of
control-consciousness here. Allowing these consumers flexibility in booking is thus even more imperative – not just to
allow them to personalise their travels to their interests, but to give them the genuinely sought-after position of power
to do so in the first place.
However, this of course is not true of all travellers; China reflected lower averages for the “appearing in control”
statement, and indeed are happy if not eager to accept more complete packages. For them, control may be more about
receiving its benefits – namely, safety and having a good time – rather than being at the helm of it.
2.1.ii MOBILE CONTROL
Whilst the rise of smartphone-based behaviours is well-known, there is still plenty to explore in how much these are a
direct result of Cruise Control attitudes. More, it is well worth examining how much the behaviours these technologies
enable are affecting consumer attitudes in turn.
Today, consumers carry with them increasingly powerful tools to find information, verify realtime claims and organise
their lives. But more than that, they carry with them a constant portal to social media and all of its associated pressures,
countless inevitable push notifications, a world of on-demand entertainment and otherwise constant connectivity.
Between countries, there are differences – China in particular is a market to watch closely, as its political context has
resulted in its own internet and smartphone coming-of-age happen in relative isolation to the rest of the world. Whilst
other activities such as “take photos” appear lower on the list in China in comparison to other regions, this is deceptive
in its own way: 78% of Chinese smartphone owners report doing so, compared to 60% in Canada or 62% in the US.
Meanwhile, browsing for products is stronger in China and Brazil than in Europe and North America, reflecting different
maturity levels of the m-commerce markets in these countries.
TOP 10 WEEKLY SMARTPHONE ACTIVITIES
“How often do you do the following activities on your smartphone, either through a web browser or an app?”
% of smartphone owners who do these activities at least once a week, 2015
Global average European average Brazil China Canada USA
Access a social Access a social Access a social
Check news Check news Check news
networking site networking site networking site
Access a social Access a social Communicate using a Access a social Communicate using a Check news
networking site networking site social networking site networking site social networking site
Manage my Communicate using a
Take photos Take photos Check news Take photos
personal life social networking site
Communicate using a Communicate using a Manage my work/
Take photos Play games Take photos
social networking site social networking site school life
Manage my Manage my Watch video content Watch video content Check news Play games
personal life personal life
Manage my work/ Manage my work/ Manage my Browse products I am Manage my Manage my
school life school life personal life interested in buying personal life personal life
Browse products I am
Watch video content Play games Take photos Watch video content Watch video content
interested in buying
Communicate using a Manage my work/ Manage my work/
Play games Watch video content Play games social networking site school life school life
Browse products I am Browse products I am Post photos on a Browse products I am Browse products I am
Play games
interested in buying interested in buying social networking site interested in buying interested in buying
Read product Read product Read product Read product
reviews/compare reviews/compare reviews/compare reviews/compare Use maps Use maps
prices for a product prices for a product prices for a product prices for a product
Source: nVision Research | Base: All smartphone owners among 1000-5000 online respondents per country aged 16-64
(Indonesia & S. Africa 16-54), 2014 February
51And ultimately, consumers log countless facts of their lives in quantifiable, data-driven form – whether the act of
“logging data” is conscious or not. A smartphone owner’s device becomes a digital narrative of their life’s most
important and most mundane data – one which is increasingly relied upon to make crucial decisions, remember
appointments and ultimately manage life.
IMPLICATIONS: IN-DESTINATION
The more reliant consumers are on their devices, the more they will be unhappy to do without them. Consumers may
have acute fears of inter-regional incompatibility, and will appreciate help to put those fears to rest or actually take
measures to lessen these pain points; power adapters and portable chargers could become tour staples as regular as
bottled water.
“[But] 3G/4G honeycomb costs are high while travelling in the EU, US and especially in less popular countries where
wireless is not accessible everywhere as you expect.”
CARRIE, SHANGHAI
Qualitative research has revealed confirmation of Mobile Control behaviours across all markets. More, however, we
see many agree that there is a rising sense of technologically-influenced control-seeking that has impacted more than
behavioural habits – its reach extends to attitudes as well:
“Brazilians are embracing more and more forms of technology and are “This trend has definitely
immersing themselves in online activities and smartphones. …The use of apps to grown in the past few years.
help users navigate the city is steadily growing among those living in big cities in A group of my friends and I
Brazil. But ... the use of more personalized apps to help you discover places and had been planning a trip to
routes in your city outside the needs of your routine has yet to improve.” Tibet for 3 years and finally
realised it in June thanks
TIAGO, SAO PAOLO to the convenience of new
technology. We went through
photos in world traveller
“[This trend] is quite well established in the Canadian market. There are several on WeChat and identified
GPS based apps that provide information to consumers about the availability of places we wanted to go, then
goods based on their location. App-based trends ... will definitely grow and evolve booked the trip partially by
with technology.” ourselves and partially through
local travel agent. We had a
SAHRISH, TORONTO planned agenda and shared
our experiences daily with our
friends. I have to say, had we
“This trend impacts the US to a large extent. The US – and New York City made the trip 3 years ago, it
especially – is a very digitally-minded market. As a citizen of NYC, much of how I would not be so personalized,
live my life is reliant on apps that provide me with useful information, and this is or at least not as easy as now.”
the norm [which] also extends to travel. … It has most definitely has grown and, in
my opinion, will only continue to grow.” XIAOLEI, SHANGHAI
ANNABELLE, NEW YORK CITY
Quantitatively, there is data to support that the Mobile Control mindset is rising as well; we take a closer look at those
who are indeed taking up the forefront of this trend: the 1 in 3 on global average who report using their smartphone to
“manage [their] personal life” once per day or more.
52“How often do you do the following activities on your smartphone, either
through a web browser or an app?” | Manage my personal life e.g. using REGIONAL DIFFERENTIATION
notes, alerts, reminders, calendar | 2015
100% Does not Around 2 in 3 are using their
own a smartphones as personal
smartphone life managers; half of that
80% proportion go on to do this daily.
Never
Less than Figures are significantly lower
60% once a week in North America, but this is
largely owing to their lower
1-3 times a ownership overall; proportions
week within smartphone owners are
40%
similar across the board.
Nearly every
day or more
China’s notoriously high
20%
ownership – particularly
amongst the elderly – shows
through as well. Almost 50%
0%
Global European Brazil China Canada USA of Chinese respondents will
average average manage their personal lives
Source: nVision Research | Base: 1000-5000 online respondents per country aged 16-64 using a smartphone every day.
(Indonesia & S. Africa 16-54), 2015 February
A quick scan of this section of the global average reveals that there is strong overlap between their demographics and
the demographics of tomorrow’s most important travellers: unsurprisingly those in either the millennial or Gen X age
groups, but also the most affluent:
“How often do you do the following activities on your smartphone, either through a web browser or an app?”
Manage my personal life e.g. using notes, alerts, reminders, calendar | % of people who manage their personal life
nearly every day or more | 2015
100%
80%
60%
40%
20%
0%
Total
Male
Female
16-24
25-34
35-44
45-54
55-64
Generation Y
Generation X
Baby-boomers
$20,000-$39,000
Under $20,000
HH income
HH income
HH income
$40,000+
Source: nVision Research | Base: 1000-5000 online respondents per country
aged 16-64 (Indonesia & S. Africa 16-54), 2015 February
What is significant about these Mobile Control consumers is that they reflect consistently different attitudes towards
those who use smartphones less often: they show higher desire to appear in control, and simultaneously a much higher
willingness to take risks for personalised reward.
“How strongly do you agree or disagree with the following statements?” % who agree or strongly agree, 2015
“I try to appear in control Don’t manage their Manage personal “I am prepared to take significant
of my life at all times” personal life on their life on their risks to have what I want out of life”
100% smartphone at least smartphone at least
nearly every day nearly every day
80%
60%
40%
20%
0%
Global European Brazil China Canada USA Global European Brazil China Canada USA
average average average average
Source: nVision Research | Base: 1000-5000 online respondents per country aged 16-64 (Indonesia & S. Africa 16-54), 2015 February
53We find a cyclical effect at play here: as technology enables greater control, control-consumers will increasingly turn
towards technology as a control tool.
This once again works to confirm the overwhelming consumer attitude that acceptable risk is goal-oriented risk – and
from a practical standpoint, results in behavioural trends towards research and preparation. As a result, Mobile Control
often looks like risk-averse behaviour:
“How strongly do you agree or disagree with the following statements?” % who agree or strongly agree, 2015
100% “I carefully budget Don’t manage their Manage personal “I would never go to a
my personal finances personal life on their life on their restaurant before reading
each month” smartphone at least smartphone at least reviews about it online”
nearly every day nearly every day
80%
60%
40%
20%
0%
Global European Brazil China Canada USA Global European Brazil China Canada USA
average average average average
Source: nVision Research | Base: Global average (1000-5000 online respondents per country) aged 16-64, 2015 February
We see that the cohort of consumers who take greatest caution and do the most research are actually the same cohort
who are the most open to then making “risky” decisions. Control-seekers are today’s most willing adventurers – so long
as control has been affirmed through preparation.
IMPLICATIONS: BOOKING & PLANNING
There will be an increase in the pro-control yet pro-risk mentality amongst those who are using their smartphones
more – a sizeable chunk of future travellers. This is good news for tourist boards, who would otherwise be permanently
forced to contend with purely risk-averse consumers.
But they must also be mindful that the booking and planning stage for this group is likely to be polarised: either
meticulously planned down to the last detail in an extremely independent fashion, or entrusted to a service that goes
above and beyond their existing expectations in terms of personalisation and giving them control.
It may be more fruitful to make more detailed resources available to this empowered group, rather than attempting to
assume what they’d like in their itineraries – not least because they are automatically going to have extremely diverse
priorities despite their similarities.
Alternatively, they will want flexible and powerful tools to assuage their fears that they might not be getting the best value
– or simply might not be finding the most worthwhile activities and attractions out there for the time they’re taking.
LuckyTrip1 is an example of such a tool – one whose promise of maximisation via a slick interface, price-adjustability
and ultimately consumer choice and control are enough to allow much of the decision-making to be left to the app
itself. Similar services could be made available both for remote consumers in planning stages as well as in-destination
travellers.
1. www.luckytrip.co.uk
54CASE STUDY: LUCKYTRIP
Like so many of today’s most innovative
service apps, LuckyTrip was actually
created by consumers – a pair of
brothers in East London who identified
a need in the market caused by exactly
the choice-paralysing factors discussed
in Mobile Control.
The service is currently available for iOS
in the UK only, but has declared plans
to launch in other countries in Q1 2016.
Whilst Apple’s AppStore do not publish
download statistics, they did select the
app for their Best of 2015 awards list.
The app’s fundamental offering is that it provides users complete holiday proposals within a personal budget with
a single tap. Promising “somewhere to go, somewhere to stay, and something to make you happy”, the service
has partnered with Skyscanner for flights and Bookings.com for rooms, before hand-picking ticketed local
attractions from TripAdvisor to create a full package.
NOTEWORTHY STRATEGY?
The two founders of the app took a unique approach to product testing: rather than going straight into app
development and releasing it directly to consumers, they launched the concept alone on a single webpage,
inviting viewers to register their interest – but requiring that they answer a short survey about their travel habits
in order to do so.
Evidence of registered interest provided impetus for further development – as well as providing a “soft launch” style
marketing campaign – but perhaps more crucially, answers from the questionnaire aided development early on.
“For too long now the process of finding and booking a trip has been time consuming and complicated. The
traditional travel sites are cluttered, with hundreds of choices that easily overwhelm you.
Quite often people just go with what they already know, choosing the same tourist spots as everyone else. We
think this is because of the way traditional travel companies work. They all like to ask us ‘where do you want to
go?’. But what if you don’t know where to go? We think for a lot of people a much more relevant question is ‘how
much do you want to spend?’ LuckyTrip searches by budget, not by location. Tell us how much you want to spend
and LuckyTrip does all the hard work for you.
If you don’t like a trip, keep on tapping ‘Lucky’ to generate trips to new locations. Save trips, share them with
friends and book, all on your phone.”
TIFF BURNS, CO-FOUNDER, LUCKYTRIP (SPEAKING TO TECHCRUNCH, OCT 2015)
552.2 ADVENTURE RELOADED
Whilst we’ve established the reign of the control consumer, we have also found that they are actually even more
attracted to the idea of being risk-takers – even if unwilling to put that into practice. The concept of adventure thus
becomes crucial to cultural ideas about travel, as it leaves room for consumers to fulfil their aspirations around risk-
friendliness whilst not necessarily relinquishing practical control.
In the following sections, we explore trends which show that control actually enables positive attitudes towards new
experiences and adventure-seeking. Here, we see that control consumers are finding their own solutions to embedding
small slices of adventure into their travel – particularly Mobile Control consumers.
Majorities across the board are rating “travelling to countries I have never been to before” as between 6-10 in value on
a scale of 1-10, with almost 90% of those in China ranking it this highly. Even more indicatively, we see high proportions
in Brazil and China who give it a full 10/10 score; particularly in these growth markets, hunger for new experiences and
worldliness is very real.
“How valuable are each of the following to you in terms of your overall
entertainment? On a scale of 1 (Not at all valuable) to 10 (Extremely valuable): REGIONAL DIFFERENTIATION
Travelling to countries I have never been to before”
% who rank it at each 1-10 value, 2015 For most, travel to specifically
new places is strongly valued
100%
– whilst significant proportions
in Brazil and China give it the
80% maximum valuation score of
10. China once again proves
60% particularly travel-friendly.
10
40% (Extremely Notably, however, the North
valuable) American countries reflect
20% significantly lower scores than
6-9 the Global Average. Perhaps
(Valuable)
0%
even more significantly, the
2-5 (Not so USA reflects a high proportion
valuable) of those who do not consider
20%
it valuable at all; it is the
1 (Not at all only country with an equal
40% valuable) proportion of those who rate it
Never does a score of 1 to those who rate
60% this it a score of 10. In addition, the
USA also has a significantly
80% high proportion of those who
Global European Brazil China Canada USA select “I never do this”.
100% average average
Source: nVision Research | Base: 1000-5000 online respondents per country aged 16-64 (Indonesia & S. Africa 16-54), 2015 February
IMPLICATIONS: INSPIRATION & DISCOVERY
For those coming from extremely different cultures – such as Brazil or China – travelling as far as Europe to see a very
different cultural and social context may be enough to constitute adventure; and we see that there indeed is a healthy
appetite there.
For those coming from closer Western cultures in Canada and the US, Europe is a comparatively less-exotic destination,
and may not carry the same connotations. For these North American markets, it may be beneficial to emphasise
cultural differences in marketing and communications to inspire curiosity – rather than playing to physical attractions
and landmarks, it may well be more effective to emphasise the depth of culture there is to explore and expose
differences between.
And confirming our findings from the previous section, we see that those who are more control-oriented are also the
more eager adventurers. They are five percentage points on average more likely to rate “travelling to countries I have
never been before” as a 10 out of 10:
56“How valuable are each of the following to you in terms of your overall
entertainment? On a scale of 1 (Not at all valuable) to 10 (Extremely valuable): REGIONAL DIFFERENTIATION
Travelling to countries I have never been to before” | % within those who NET
agree with “I like to appear in control of my life at all times” and those who do The overall proportion of
not, 2015 those who have travelled
does not change significantly
100%
based on level of control-
consciousness.
80%
Canada and the USA seem
60% to show the greatest net
10 difference – particularly
(Extremely Canada, where there is a
valuable) significant reduction in the
20% proportion who strongly
6-9
(Valuable)
disagree in the control-
0% conscious.
2-5 (Not so
20% valuable) Nevertheless, a consistent
increase in value is
1 (Not at all
40% measurable across the board
valuable)
amongst those who are
Never does conscious of control. There
60%
this is most likely an underlying
demographic factor
Global Not control-conscious
Global Control-conscious
European Not control-conscious
European Control-conscious
Brazil Not control-conscious
Brazil Control-conscious
China Not control-conscious
China Control-conscious
Canada Not control-conscious
Canada Control-conscious
USA Not control-conscious
USA Control-conscious
80%
correlation at work here –
most likely to be affluence.
100%
Source: nVision Research | Base: 1000-5000 online respondents per country aged 16-64 (Indonesia & S. Africa 16-54), 2015 February
The question remains: how are consumers attempting to reconcile their need for originality in their experiences with
their tendencies for control?
An underlying first indicator emerges from qualitative research: the importance of experiential authenticity.
“Brands need to find a way to keep up with the public and “In the Canadian market ... more people want to
to improve their reputation with a consumer base that discover the authentic side of the destinations they
is growing smarter and more aware. They will find new, visit ... instead of the regular tourist attractions that
clever ways to permeate everyday existence and express the government want them to see. They want to take
their brand message in ways that are experiential. I also excursions to visit smaller towns and meet the locals
think that [co-created experiences] will grow in future, as and how they live their lives. Unless there’s an issue
the world becomes more saturated with information and of security, this trend will only grow as travellers
people feel an increased need to express themselves in continue to want to expand their knowledge of the
ways that feel authentic.” world.”
ANABELLE, NYC SAHRISH, TORONTO
These sentiments highlight that the feeling of authenticity is important – particularly given how much information
currently exists about the world, and how the consumer’s own empowerment may be creating new angles in the
demand for authenticity.
Quantitatively, this can be confirmed in a final correlation. Control-conscious respondents showed a 13 percentage point
increase in comparison to the non-control-conscious in their levels of prioritisation of authentic experiences, from 58% to
71% in the global average. For smartphone life managers, the percentage point increase was identical, from 61% to 74%.
57“How strongly do you 100% Non-control-conscious Control-conscious
agree with the following
statements? When I go 80%
on holiday, the most
important thing for me 60%
is to experience the
authentic culture of a 40%
place” | % who agree
20%
strongly or agree | 2015
0%
Global European Brazil China Canada USA
average average
Source: nVision Research | Base: Global average (1000-5000 online respondents per country) aged 16-64, 2015 February
IMPLICATIONS: IN-DESTINATION
Whilst consumers may say that authenticity is a priority, there is a practical limit to this which is not necessarily
consistent with declared attitudes – just as there is with risk as we explored earlier. And of course, regional disparities
exist – particularly with the groups from China and Brazil more strongly associated with the kind of destination-hopping
travel which involves little more than being driven from one landmark photo opportunity to another.
But given different levels of exposure and differing levels of cultural difference, “experiencing authentic culture” is in
fact highly subjective – much more so than risk. These indicators simply remind industry providers that the correct
mentality with which to approach these consumers is to recognise that there is a lower threshold for perceived
authenticity – rather than a deprioritisation of authenticity altogether.
2.2.i LAST-MINUTE LIVING
Despite the control-consumer’s increased ability and desire to carefully make plans, it is perhaps their opportunity-
maximisation that also drives them to an increasingly last-minute style of planning. In a world where consumers are
constantly looking for newer and better opportunities to spend time and effort on, it follows that more fluidity is in demand.
“How strongly do you agree or disagree with the following statements?
I often find I cancel my leisure plans at the last minute” | 2015 REGIONAL DIFFERENTIATION
Disagree Strongly Disagree Neither Agree nor Disagree Agree Agree Strongly
100% Half of consumers dislike the
idea of cancelling last-minute.
80% Especially in Canada and the
60% USA, we see high numbers
who claim they “strongly
40% disagree” – suggesting that
20% this is not only outside of their
habits, but something they
0% hold themselves to.
20%
It thus makes sense that
40% amongst the control-
conscious in those markets,
60%
the proportion who disagree
80% also increases slightly – as
Global Not control-conscious
Global Control-conscious
European Not control-conscious
European Control-conscious
Brazil Not control-conscious
Brazil Control-conscious
China Not control-conscious
China Control-conscious
Canada Not control-conscious
Canada Control-conscious
USA Not control-conscious
USA Control-conscious
keeping to the principle of
100%
upholding plans is clearly a
control-friendly habit.
But we also see that there is
a more significant and more
consistent rise in those who
cancel last-minute when
it comes to those control-
oriented consumers.
Source: nVision Research | Base: 1000-5000 online respondents per country
aged 16-64 (Indonesia & S. Africa 16-54), 2015 February
58Of course, those who cancel last-minute on plans are still well in the minority – and particularly with large-scale leisure
such as travel, we’re unlikely to see a huge influx of last-minute cancellations.
It is more significant to simply note the disparity between those with differing attitudes towards control – illustrating
that the control-conscious consumer doesn’t conform to the tight-laced, schedule-adhering identity of old control
models. Those who desire to appear in control may well have more chaotic lives than those who don’t – whether it is
due to pre-existing stress which prompted their control-seeking in the first place, or simply the maximising tendencies
that control promotes.
The other side to the last-minute cancellation is the last-minute booking – a far more positive behaviour for the travel
industry, and one that indeed does reflect higher numbers of uptake globally.
“I often find I cancel my leisure plans at the last minute” | “I often find I make my leisure plans at the last minute”
“I find people often rearrange leisure plans they have made with me” | % who agree or strongly agree, 2015
100% Cancel plans last minute Make plans last minute Are cancelled on last minute
80%
60%
40%
20%
0%
GB France Spain Sweden USA China Japan
Source: nVision Research | Base: 1000-5000 online respondents per country aged 16-64 (Indonesia & S. Africa 16-54), 2015 February
Source: nVision Research | Base: 1000-2000 online respondents per country aged 16+ (China 16-64), 2015 September
*Note: questions on making plans last minute and having others rearrange last minute were asked in a smaller global wave that only
included the above countries
We see a new behaviour of “controlled impulsiveness” emerging across markets. With 40% in the US claiming that they
make plans last minute and 30% in China – rising to 1 in 2 and 1 in 3 respectively when it comes to millennials – last-
minute travel doesn’t look likely to stop any time soon.
“I often find I make my leisure plans at the last minute” | % who agree or strongly agree, 2015
100% Total Millennials
80%
60%
40%
20%
0%
Global GB France Spain Sweden USA China Japan
average
Source: nVision Research | Base: 1000-5000 online respondents per country aged 16-64 (Indonesia & S. Africa 16-54), 2015 February
59FOCUS ON: CANADA & USA
Paradoxically, consumers in these markets may be creating another demand for themselves in their pursuit of
the optimally worthwhile holiday. A softer attitudinal element is at play as well: the idea that spontaneity and
impulse is valuable to an authentic adventure. We’ve already seen that consumers perceive themselves to be
control-conscientious regardless of their behaviour – and backlash from this may also be contributing to the rise
of last-minute bookings and cancellations.
Qualitative research shows there is a recognition of loss – loss of spontaneity that occurs in a world of control and
tech-saturation:
“As a mom, I need to have the whole itinerary “Vacations [are] less spontaneous on the whole
down before I travel. I’m totally guilty of taking all because even when having arrived in a location …
the spontaneity out of it, but I love how easy it is [you] can log in and figure out their day without any
to research and book everything now!” help from the tourism bureau employees.”
FEMALE, 33, USA FEMALE, 31, CANADA
CASE STUDY: TRANSAVIA #SNACKHOLIDAYS
Transavia is a low cost Dutch airline offering flights around
Europe and the Mediterranean. Its French subsidiary,
Transavia France released a new kind of snack, one which
included a flight ticket. Sold at participating shops, a cinema
and at two vending machines in Paris, the gummy bears,
crisps and cereal bars included flights to Lisbon, Barcelona
and Dublin respectively.
Consumers entered the code found inside the snack bag
on a specially designed website, snackholidays.com,
allowing them to book a one way flight with the price being
guaranteed to be as displayed on the packaging, all costing
below €40. There was, however, still a booking fee to pay, as
well as extra charges for any additional luggage. Passengers
could take flights from June until October 2015, all leaving
from Paris Orly.
French advertising agency Les Gaulois designed the
campaign, with the aim to turn buying a flight ticket into a
more fun, accessible experience, taking buying a flight ticket
offline, and into where you least expect it, in a grocery store.
NOTEWORTHY STRATEGY?
Although the price of the flights wasn’t discounted particularly heavily, the relocation of flight purchase added
to the sense of impulse the airline was attempting to capitalise on. The decision to buy a snack is a much more
familiar, whimsical process; something which the brand felt could be extended to flight purchases, turning it into
a simpler, more impulsive decision. The campaign, which was run on electronic billboards and static ones alike –
as well as a viral video released on YouTube – emphasised much the same point.
By changing the type of decision buying a flight was, the campaign aimed to convert potential travellers into real
passengers.
60Impulse is thus in demand both from the standpoint of busy time-compressed consumers who are seeking the best
options out there, whether they were part of the original script or not – as well as in a more attitudinal sense in the USA
and Canada, where a sense of adventure is lost in too rigid a schedule.
It is thus unsurprising that we see a rise in demand for services that could enable this – particularly ones driven by
predictive analytics which are increasingly enabled by Mobile Control habits.
“How interested would you be in any of the following services?
A service/device that detected your location and suggested REGIONAL DIFFERENTIATION
interesting things to spontaneously see and do in the nearby area”
% who agree or strongly agree, 2015 Brazil and China show
extremely positive responses
100% Very interested Quite interested
to location-detecting
services; this is likely due to
their wider use and uptake
80%
of smartphones as already
identified.
60%
It is Canada and the USA that
show relatively lower interest
40%
– but given what has been
established about their need
for feeling spontaneous, this
20% suggests that such services
could grow if marketed
appropriately.
0%
Global European Brazil China Canada USA
average average
Source: nVision Research | Base: Global average (1000-5000 online respondents per country) aged 16-64, 2015 February
Demographically, those who are interested are similar to those 1 in 3 consumers who are using smartphones as a
regular life-management tool: they are aged 16-44, and often in the highest bracket of affluence. Behaviourally, it is
also as expected: looking at interest within the smartphone life managers, we see very significant increases – with
strong proportional gains in the USA and Canada as well.
“How interested would you be in any of the following services? A service/ device that detected your location and
suggested interesting things to spontaneously see and do in the nearby area” | % who are interested | 2015
100% Don’t manage their personal life on their smartphone at least nearly every day
Manage personal life on their smartphone at least nearly every day
80%
60%
40%
20%
0%
Global European Brazil China Canada USA
average average
Source: nVision Research | Base: 1000-5000 online respondents per country aged 16-64 (Indonesia & S. Africa 16-54), 2015 February
Finally, we can qualitatively detect that services are emerging as well – particularly in the USA, despite the relatively
lower levels of interest that are reflected above. This will only drive consumer demand in this area.
61You can also read