LIVING PLANET REPORT 2020 - BENDING THE CURVE OF BIODIVERSITY LOSS - WWF
←
→
Page content transcription
If your browser does not render page correctly, please read the page content below
LIVING PLANET
REPORT 2020
BENDING THE CURVE OF BIODIVERSITY LOSS

                                         1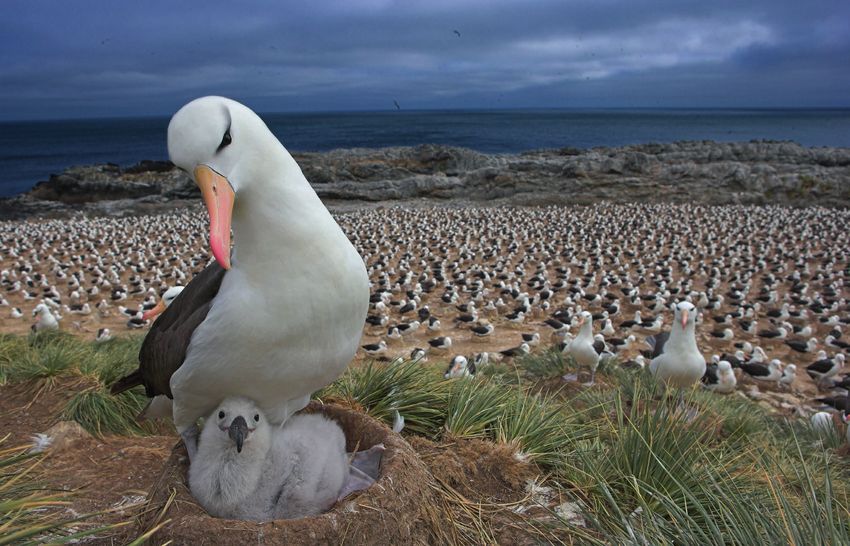
WWF

                                                                           CONTENTS
WWF is one of the world’s largest and most experienced independent
conservation organizations, with over 5 million supporters and a global
network active in more than 100 countries. WWF’s mission is to stop
the degradation of the planet’s natural environment and to build a
future in which humans live in harmony with nature, by conserving the
world’s biological diversity, ensuring that the use of renewable natural
resources is sustainable, and promoting the reduction of pollution and
wasteful consumption.
                                                                           FOREWORD BY MARCO LAMBERTINI                            4

Institute of Zoology (Zoological Society of London)
Founded in 1826, ZSL (Zoological Society of London) is an international    EXECUTIVE SUMMARY                                       6
conservation charity working to create a world where wildlife
thrives. ZSL’s work is realised through ground-breaking science, field
conservation around the world and engaging millions of people              AT A GLANCE                                             9
through two zoos, ZSL London Zoo and ZSL Whipsnade Zoo.

ZSL manages the Living Planet Index® in a collaborative partnership
with WWF.                                                                  CHAPTER 1: AN SOS FOR NATURE                            10

Citation                                                                   CHAPTER 2: OUR WORLD IN 2020                           50
WWF (2020) Living Planet Report 2020 -
Bending the curve of biodiversity loss.
Almond, R.E.A., Grooten M. and Petersen, T. (Eds).
WWF, Gland, Switzerland.
                                                                           CHAPTER 3: PEOPLE AND NATURE ARE INTERTWINED            74

Design and infographics by: peer&dedigitalesupermarkt                      CHAPTER 4: IMAGINING A ROADMAP FOR PEOPLE AND NATURE   112

Cover photograph: © Jonathan Caramanus / Green Renaissance / WWF-UK
Farmer Nancy Rono with a chameleon on her sleeve, Bomet County,            REFERENCES                                             140
Mara River Upper Catchment, Kenya.

ISBN 978-2-940529-99-5

Living Planet Report®
and Living Planet Index®
are registered trademarks
of WWF International.
Editorial Team
Editor-in-Chief: Rosamunde Almond (WWF-NL)
Co-Editor-in-Chief: Monique Grooten (WWF-NL)
Lead Editor: Tanya Petersen
Living Planet Report Fellow: Sophie Ledger (Zoological Society of London - ZSL)

Steering Group
Chair: Rebecca Shaw (WWF-International)
Mike Barrett (WWF-UK), João Campari (WWF-Brazil), Winnie De’Ath (WWF-International), Katie Gough
(WWF-International), Marieke Harteveld (WWF-International), Margaret Kuhlow (WWF-International),
Lin Li (WWF-NL), Luis Naranjo (WWF-Colombia) and Kavita Prakash-Marni

Authors
Inger Andersen (United Nations Environment Programme), Mark Anderson (Dasgupta Review Team),
Alexandre Antonelli (Royal Botanic Gardens, Kew), Chris Baker (Wetlands International), William
Baldwin-Cantello (WWF-International), Patricia Balvanera (Universidad Nacional Autónoma de México
- UNAM), BCE/eBMS-ABLE Consortium, Emily Beech (Botanic Gardens Conservation International -
BGCI), Julie Bélanger (UN Food and Agriculture Organization - FAO), Julia Blanchard (University of
Tasmania), Monika Böhm (Zoological Society of London - ZSL), Stuart Butchart (BirdLife International),
Duncan Cameron (University of Sheffield), William W. L. Cheung (Institute for the Oceans and Fisheries,
The University of British Columbia), Colin Clubbe (Royal Botanic Gardens, Kew), Sarah Cornell
(Stockholm Resilience Centre), Richard Cottrell (University of California Santa Barbara), Partha Dasgupta
(University of Cambridge), Fabrice DeClerck (EAT), Stefanie Deinet (Zoological Society of London -
ZSL), Moreno di Marco (Sapienza University of Rome), Sandra Díaz (CONICET and Córdoba National

                                                                                                            LIVING PLANET
University, Argentina and IPBES Global Assessment Co-Chair), Lynn Dicks (University of Cambridge),
Sarah Doornbos (WWF-NL), Franz Essl (University of Vienna), Adrienne Etard (University College London
- UCL), FABLE Consortium (UN Sustainable Development Solutions Network), Wendy Foden (South
African National Parks - SANParks), Robin Freeman (Zoological Society of London - ZSL), Alessandro Galli
(Global Footprint Network), Jaboury Ghazoul (ETH Zurich), Eliza Grames (University of Connecticut),
Elizabeth Green (UN Environment Programme World Conservation Monitoring - UNEP-WCMC),
Guenther Grill (McGill University), Luigi Guarino (Crop Trust ), Neal Haddaway (Stockholm Environment
Institute, Stockholm), Laurel Hanscom (Global Footprint Network), Mike Harfoot (UN Environment

                                                                                                            REPORT 2020
Programme World Conservation Monitoring - UNEP-WCMC), Serene Hargreaves (Royal Botanic Gardens,
Kew), Jelle Hilbers (Radboud University Nijmegen), Samantha Hill (UN Environment Programme World
Conservation Monitoring - UNEP-WCMC), Craig Hilton-Taylor (IUCN), Richard Holland (Wetlands
International), Aelys Humphreys (Stockholm University), Walter Jetz (Yale University), Arwyn Jones
(European Commission Joint Research Centre - JRC), Sarah Jones (Bioversity International), Akanksha
Khatri (World Economic Forum - WEF), HyeJin Kim (German Centre for Integrative Biodiversity Research
- iDiv), Monica Kobayashi (UN Food and Agriculture Organization - FAO), Guillaume Latombe (University
of Vienna), David Leclère (IIASA), Bernhard Lehner (McGill University), Bernd Lenzner (University of
Vienna), David Lin (Global Footprint Network), Brian Lueng (McGill University), Eimear Nic Lughadha
(Royal Botanic Gardens, Kew), Carolyn Lundquist (University of Auckland), Jane Madgwick (Wetlands
International), Valentina Marconi (Zoological Society of London - ZSL), Marcio Martins (University of
São Paulo), Berta Martín-López (Leuphana University, Lüneburg), Emily McKenzie (Dasgupta Review
Team), Louise McRae (Zoological Society of London - ZSL), Leticia Merino Perez (Universidad Nacional

                                                                                                            BENDING THE CURVE OF BIODIVERSITY LOSS
Autónoma de México - UNAM), Guy Midgley (Stellenbosch University), Haroon Mohamoud (Dasgupta
Review Team), Zsolt Molnar (Hungarian Academy of Sciences), Graham Montgomery (University of
Connecticut), Aline Mosnier (UN Sustainable Development Solutions Network), Tim Newbold (University
College London - UCL), Michael Obersteiner (The Environmental Change Institute, University of Oxford
and IIASA) Natasja Oerlemans (WWF-NL), Jeff Opperman (WWF-International), Alberto Orgiazzi
(European Commission Joint Research Centre - JRC), Stuart Orr (WWF-International), Ant Parham
(Dasgupta Review Team), Pete Pearson (WWF-US), Henrique Pereira (Martin Luther University),
Alexander Pfaff (Duke University), Thomas Pienkowski (Oxford University), Dafydd Pilling (UN Food and
Agriculture Organization - FAO), Jamie Pittock (Australian National University), Jack Plummer (Royal
Botanic Gardens, Kew), Jordan Poncet (UN Sustainable Development Solutions Network), Andy Purvis
(Natural History Museum, London), Malin Rivers (Botanic Gardens Conservation International - BGCI),
Isabel Rosa (Bangor University), Kate Scott-Gatty (Zoological Society of London - ZSL), Hanno Seebens
(Senckenberg Biodiversity and Climate Research Centre), Will Simonson (UN Environment Programme
World Conservation Monitoring - UNEP-WCMC), Bruce Stein (National Wildlife Federation), Amanda
Stone (WWF-US), Michele Thieme (WWF-US), Dave Tickner (WWF-UK), Derek Tittensor (Dalhousie
University), Ginya Truitt Nakata (International Potato Centre), Edgar Turner (University of Cambridge),
Paula Valdujo (WWF-Brazil), Riyan van den Born (Radboud University Nijmegen), Chris van Swaay
(Butterfly Conservation Europe), Nicola van Wilgen (South African National Parks - SANParks), Ronald
Vargas (UN Food and Agriculture Organization - FAO), Oscar Venter (University of British Columbia),
Piero Visconti (International Institute for Applied Systems Analysis), Mathis Wackernagel (Global
Footprint Network), Catharine Ward Thompson (University of Edinburgh), James Watson (Wildlife
Conservation Society), Robert Watson (Tyndall Centre for Climate Change Research), Dominic Waughray
(World Economic Forum - WEF), Sarah Whitmee (Oxford University), Brooke Williams (University of
Queensland) and Jessica Williams (University College London - UCL)

Special thanks
Rob Alkemade (PBL Netherlands Environmental Assessment Agency), Jennifer Anna (WWF-US), Paige
Ashton (WWF-UK), Yves Basset (Smithsonian Tropical Research Institute, Panama), Shang Hui Chia
(WWF-International), Wendy Elliott (WWF-International), Christo Fabricius (WWF-US), Elaine Geyer-
Allely (WWF-International), Huma Khan (WWF-International), Hermine Kleymann (WWF-International),
Marcel Kok (PBL Netherlands Environmental Assessment Agency), Greg P.A Lamarre (Czech Academy of
Sciences), Richard Lee (WWF-International), Philip Leonard (WWF-International), Ghislaine Llewellyn
(WWF-Australia), Brent Loken (WWF-International), Gretchen Lyons (WWF-International), Peter
McFeely (WWF-International), Holly McKinlay (WWF-US), Isabelle Oostendorp (WWF-NL), Pablo
Pacheco (WWF-International), Hannah Rotten (Zoological Society of London - ZSL), Aafke Schipper (PBL
Netherlands Environmental Assessment Agency), Kirsten Schuijt (WWF-NL), Krista Singleton-Cambage
(WWF-International), James Stapleton (International Potato Centre), John Tanzer (WWF-International),
Detlef van Vuuren (PBL Netherlands Environmental Assessment Agency), Carrie Watson (WWF-UK),
Chris Weber (WWF-International), Mark Wright (WWF-UK), Lucy Young (WWF-UK) and Natascha
Zwaal (WWF-NL)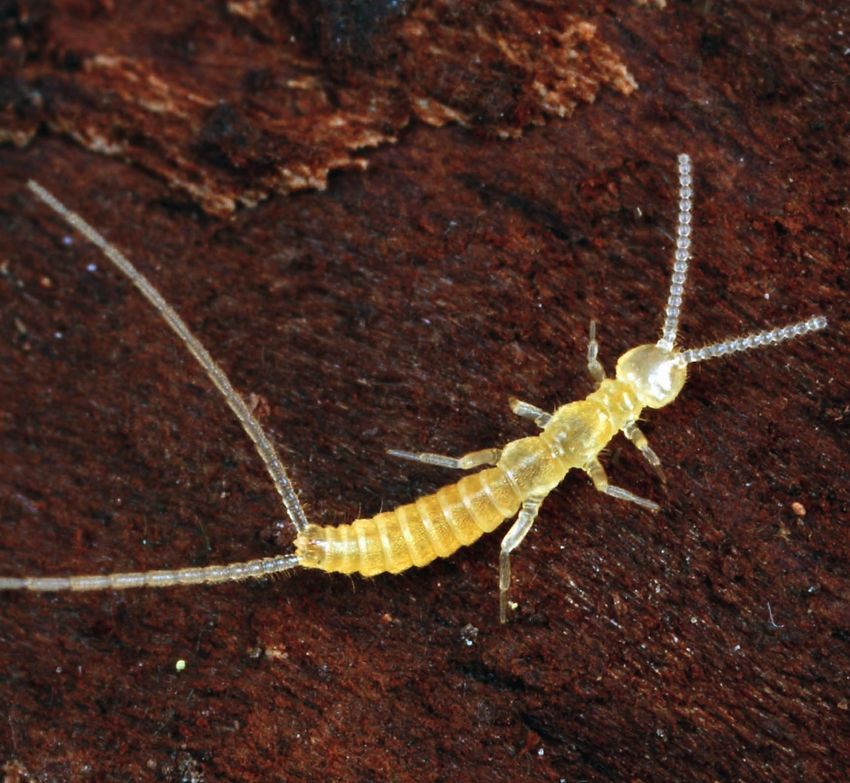
8 BILLION REASONS TO
                                      SAFEGUARD NATURE
                                      At a time when the world is reeling from the deepest global             The Living Planet Report 2020 shows that there is an opportunity
                                      disruption and health crisis of a lifetime, this year’s Living Planet   to heal our relationship with nature and mitigate risks of future
                                      Report provides unequivocal and alarming evidence that nature           pandemics but this better future starts with the decisions that
                                      is unravelling and that our planet is flashing red warning signs of     governments, companies and people around the world take today.
                                      vital natural systems failure. The Living Planet Report 2020 clearly    World leaders must take urgent action to protect and restore nature
                                      outlines how humanity’s increasing destruction of nature is having      as the foundation for a healthy society and a thriving economy.
                                      catastrophic impacts not only on wildlife populations but also on
                                      human health and all aspects of our lives.                              We still have a chance to put things right. It’s time for the world to
                                                                                                              agree a New Deal for Nature and People, committing to stop and
                                      This highlights that a deep cultural and systemic shift is urgently     reverse the loss of nature by the end of this decade and build
                                      needed, one that so far our civilisation has failed to embrace: a       a carbon-neutral and nature-positive economy and society.
                                      transition to a society and economic system that values nature,         This is our best safeguard for human health and livelihoods in
                                      stops taking it for granted and recognises that we depend on nature     the long term, and to ensure a safe future for our children and
                                      more than nature depends on us.                                         children’s children.

                                      This is about rebalancing our relationship with the planet to
                                      preserve the Earth’s amazing diversity of life and enable a just,
                                      healthy and prosperous society – and ultimately to ensure our           Marco Lambertini,
                              © WWF
                                      own survival.

                                      Nature is declining globally at rates unprecedented in millions
                                      of years. The way we produce and consume food and energy,
                                      and the blatant disregard for the environment entrenched in our
                                      current economic model, has pushed the natural world to its limits.     Director General
                                      COVID-19 is a clear manifestation of our broken relationship with       WWF International
                                      nature. It has highlighted the deep interconnection between nature,
                                      human health and well-being, and how unprecedented biodiversity
                                      loss threatens the health of both people and the planet.

                                      It is time we answer nature’s SOS. Not just to secure the future of
                                      tigers, rhinos, whales, bees, trees and all the amazing diversity of
                                      life we love and have the moral duty to coexist with, but because
                                      ignoring it also puts the health, well-being and prosperity, indeed
                                      the future, of nearly 8 billion people at stake.

WWF LIVING PLANET REPORT 2020 4                                                                                                                                                        5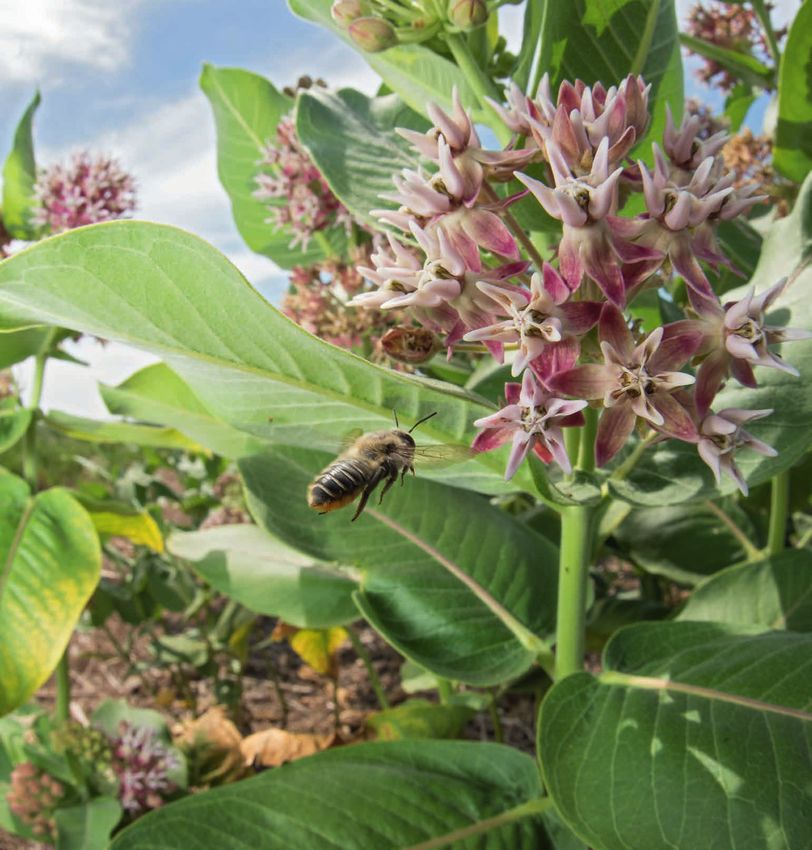
EXECUTIVE SUMMARY
                                  The global Living Planet Index continues to decline. It shows an          Tigers, pandas and polar bears are well-known species in the
                                  average 68% decrease in population sizes of mammals, birds,               story of biodiversity decline, but what of the millions of tiny, or
                                  amphibians, reptiles and fish between 1970 and 2016. A 94%                as-yet-undiscovered, species that are also under threat? What is
                                  decline in the LPI for the tropical subregions of the Americas is the     happening to the life in our soils, or in plant and insect diversity?
                                  largest fall observed in any part of the world.                           All of these provide fundamental support for life on Earth and are
                                                                                                            showing signs of stress.
                                  Why does this matter?
                                                                                                            Biodiversity loss threatens food security and urgent action is
                                  It matters because biodiversity is fundamental to human life on           needed to address the loss of the biodiversity that feeds the
                                  Earth, and the evidence is unequivocal – it is being destroyed by us      world. Where and how we produce food is one of the biggest
                                  at a rate unprecedented in history. Since the industrial revolution,      human-caused threats to nature and our ecosystems, making the
                                  human activities have increasingly destroyed and degraded forests,        transformation of our global food system more important than ever.
                                  grasslands, wetlands and other important ecosystems, threatening
                                  human well-being. Seventy-five per cent of the Earth’s ice-free land      The transformation of our economic systems is also critical.
                                  surface has already been significantly altered, most of the oceans        Our economies are embedded within nature, and it is only by
                                  are polluted, and more than 85% of the area of wetlands has               recognising and acting on this reality that we can protect and
                                  been lost.                                                                enhance biodiversity and improve our economic prosperity.

                                  Species population trends are important because they are a                We can estimate the value of ‘natural capital’ – the planet’s stock of
                                  measure of overall ecosystem health. Measuring biodiversity,              renewable and non-renewable natural resources, like plants, soils
                                  the variety of all living things, is complex, and there is no single      and minerals – alongside values of produced and human capital –
                                  measure that can capture all of the changes in this web of life.          for example, roads and skills – which together form a measure of a
                                  Nevertheless, the vast majority of indicators show net declines over      country’s true wealth. Data from the United Nations Environment
                                  recent decades.                                                           Programme shows that, per person, our global stock of natural
                                                                                                            capital has declined by nearly 40% since the early 1990s, while
                                  That’s because in the last 50 years our world has been transformed        produced capital has doubled and human capital has increased
                                  by an explosion in global trade, consumption and human                    by 13%.
                                  population growth, as well as an enormous move towards
                                  urbanisation. Until 1970, humanity’s Ecological Footprint was             But too few of our economic and financial decision-makers know
                                  smaller than the Earth’s rate of regeneration. To feed and fuel our       how to interpret what we are hearing, or, even worse, they choose
                                  21st century lifestyles, we are overusing the Earth’s biocapacity by at   not to tune in at all. A key problem is the mismatch between the
                                  least 56%.                                                                artificial ‘economic grammar’ which drives public and private policy
                                                                                                            and ‘nature’s syntax’ which determines how the real world operates.
                                  These underlying trends are driving the unrelenting destruction
                                  of nature, with only a handful of countries retaining most of the         Together this evidence shows that biodiversity conservation is more
                                  last remaining wilderness areas. Our natural world is transforming        than an ethical commitment for humanity: it is a non-negotiable
                                  more rapidly than ever before, and climate change is further              and strategic investment to preserve our health, wealth
                                  accelerating the change.                                                  and security.

WWF LIVING PLANET REPORT 2020 6                                                                                                                                                      7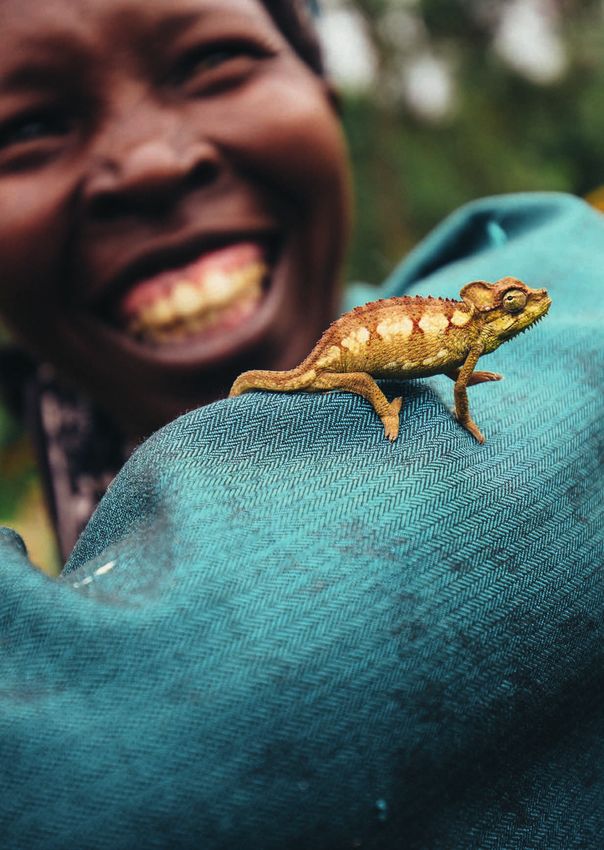
AT A GLANCE
Can we reverse these trends of decline? WWF co-founded a new An SOS for nature Our world in 2020
research initiative – the Bending the Curve Initiative – that has
developed pioneering modelling, providing a ‘proof of concept’ • Serious declines in species population trends • Global economic growth since WWII has
CHAPTER 1
CHAPTER 2
that we can halt, and reverse, terrestrial biodiversity loss from are a measure of overall ecosystem health, and driven exponential human improvements, yet
land-use change. And the models are all telling us the same thing: our planet is flashing red warning signs. this has come at a huge cost to the stability of
• The 2020 global Living Planet Index shows Earth’s operating systems that sustain us.
that we still have an opportunity to flatten, and reverse, the loss of
an average 68% fall in monitored vertebrate • Humans are now overusing the Earth’s
nature if we take urgent and unprecedented conservation action
species populations between 1970 and 2016. biocapacity by at least 56%.
and make transformational changes in the way we produce and • The 94% decline in the LPI for the tropical • Land-use change due to where and how we
consume food. subregions of the Americas is the largest fall produce food, is one of the biggest threats
observed in any region. humans pose to biodiversity.
2020 was billed as a ‘super year’ of climate, biodiversity and • In addition to mammals, birds, reptiles, • Our ocean is also in hot water, with
sustainable development meetings in which the international amphibians and fish, this chapter also overfishing, pollution, coastal development
community had great plans to take the reins of the Anthropocene. uncovers trends from the tiniest creatures to and climate change causing a growing
The COVID-19 pandemic has meant that most of these conferences the canopy, looking at soil biodiversity, insects spectrum of adverse effects across marine
are now scheduled for 2021, and has provided a stark reminder of and – for the first time – plants. ecosystems.
how nature and humans are intertwined.
Until now, decades of words and warnings have not changed People and nature are Imagining a roadmap for
modern human society’s business-as-usual trajectory. Yet in times
of rapid upheaval and disruption new ideas, creativity, processes intertwined people and nature
and opportunities for transformation can arise. The future is always
• The alteration of the world’s natural systems • Pioneering biodiversity modelling helps us to
uncertain but perhaps the COVID-19 pandemic will spur us on to
CHAPTER 3
CHAPTER 4
threatens to undo the extraordinary gains imagine the future, asking ‘What if humanity
embrace this unexpected opportunity and revolutionise how we in human health and well-being of the past takes different pathways?’
take care of our home. century. • The Bending the Curve Initiative has provided
• Urgent action is needed to address the loss ‘proof of concept’ that we can halt, and
of the biodiversity that feeds the world. reverse, the loss of nature while feeding a
• There is a fundamental mismatch between growing population.
artificial ‘economic grammar’ and ‘nature’s • Bending the curve of biodiversity loss is
syntax’ which determines how the real technologically and economically possible,
world operates. but it will require truly transformational
• It is now becoming ever clearer that change in the way we produce and consume
biodiversity is a non-negotiable and strategic food and in how we sustainably manage and
investment to preserve our health, wealth conserve nature.
and security.
•F
reshwater deep dive: Freshwater ecosystems are some of the world’s most vulnerable. This deep dive
EXPLORE MORE
explores freshwater status and trends, drivers of change and an outlook for recovery.
•C
limate deep dive: Climate change is already affecting biodiversity, and this deep dive explores its current
and future impacts.
•V
oices for a Living Planet: A special supplement complementing the LPR story brings together a
collection of short opinion essays – written by thinkers and practitioners from different countries and cultures
around the globe – on how to build a resilient and healthy planet for people and nature.
WWF LIVING PLANET REPORT 2020 8 9
© naturepl.com / Andy Rouse / WWF

    CHAPTER 1
    AN SOS FOR NATURE
    The evidence is unequivocal – nature is being changed and
    destroyed by us at a rate unprecedented in history. The 2020
    global Living Planet Index shows an average 68% fall in
    populations of mammals, birds, amphibians, reptiles and fish
    between 1970 and 2016. In this chapter we also look at life in
    the soil beneath our feet, insects, “the little things that run the
    world”, and plants, all of which provide fundamental support
    for life on Earth. From the biggest to the smallest living things
    on our planet, monitoring shows us that nature is in serious
    decline.
    Black-browed albatross (Diomedea / Thalassarche melanophrys) with chick
    on nest, Steeple Jason, Falkland Islands.

WWF LIVING PLANET REPORT 2020 10                                                                                  11
BIODIVERSITY ON THE BRINK:
                                                                                                                    Therefore, it is essential that the issues of biodiversity loss and
                                                                                                                    climate change are addressed together.

WE KNOW IT IS CRASHING
                                                                                                                    While the Paris Agreement is an important step towards limiting
                                                                                                                    human-induced climate change, the current pledges from its
                                                                                                                    signatories are totally inadequate to achieve its targets, with global
                                                                                                                    emissions projected to be about the same in 2030 as they are today.
Biodiversity as we know it today is fundamental to human                                                            Global temperatures could reach the 1.5oC aspirational target by the
                                                                                                                    early to mid-2030s, and the 2oC threshold by 2050-2070. Without
life on Earth, and the evidence is unequivocal – it is being                                                        additional actions to reduce greenhouse gas emissions we are on
destroyed by us at a rate unprecedented in history.                                                                 a pathway to a rise of 3-4oC, which will have devastating effects on
                                                                                                                    biodiversity and human well-being.

                                                                                                                    The loss of biodiversity is not only an environmental issue but a
                    Sir Robert Watson,    Since the industrial revolution, human activities have increasingly       development, economic, global security, ethical and moral one. The
             Tyndall Centre for Climate   destroyed and degraded forests, grasslands, wetlands and other            continued loss of biodiversity will undermine the achievement of
                      Change Research     important ecosystems, threatening human well-being. Seventy-              most of the UN Sustainable Development Goals, including poverty
                                          five per cent of the Earth’s ice-free land surface has already been       alleviation and food, water and energy security. Biodiversity has
                                          significantly altered, most of the oceans are polluted, and more          significant economic value, which should be recognised in national
                                          than 85% of the area of wetlands has been lost. This destruction          accounting systems; it is a security issue insofar as the loss of
                                          of ecosystems has led to 1 million species (500,000 animals and           natural resources, especially in poor developing countries, can
                                          plants and 500,000 insects) being threatened with extinction              lead to conflict; it is an ethical issue because loss of biodiversity
                                          over the coming decades to centuries, although many of these              hurts the poorest people who depend on it, further exacerbating
                                          extinctions are preventable if we conserve and restore nature 1.          an already inequitable world; and it is a moral issue because we
                                          The most important direct driver of biodiversity loss in terrestrial      humans should not destroy the living planet.
                                          systems in the last several decades has been land-use change,             It is also a self-preservation issue. Biodiversity plays a critical role
                                          primarily the conversion of pristine native habitats (forests,            in providing food, fibre, water, energy, medicines and other genetic
                                          grasslands and mangroves) into agricultural systems; while much           materials; and is key to the regulation of our climate, water quality,
                                          of the oceans has been overfished. Since 1970, these trends have          pollution, pollination services, flood control and storm surges. In
                                          been driven in large part by a doubling of the world’s human              addition, nature underpins all dimensions of human health and
                                          population, a fourfold increase in the global economy, and a tenfold      contributes on non-material levels – inspiration and learning,
                                          increase in trade.                                                        physical and psychological experiences, and shaping our identities
                                          The challenge is to transform agricultural and fishing practices,         – that are central to quality of life and cultural integrity.
                                          many of which are unsustainable today, into ones that produce
                                          the affordable and nourishing food we need while protecting
                                                                                                                    In 2019, drawing on almost 15,000 references and the expertise
                                          and conserving biodiversity. For agriculture, this means using
                                                                                                                    of more than 150 natural and social scientists from more than 50
                                          sustainable agroecological practices, reducing the use of chemicals,
                                                                                                                    countries, the Intergovernmental Science-Policy Platform
                                          fertilisers and pesticides, and protecting our soils and pollinators.
                                                                                                                    on Biodiversity and Ecosystem Services (IPBES) published
                                          Globally, climate change has not been the most important driver of        its first global assessment on the state of the Earth’s biodiversity,
                                          the loss of biodiversity to date, yet in coming decades it is projected   the Global Assessment Report on Biodiversity and Ecosystem
                                          to become as, or more, important than the other drivers. Climate          Services 1. Established in Panama City in 2012 by 94 governments,
                                          change adversely affects genetic variability, species richness and        IPBES is an independent intergovernmental body established to
                                          populations, and ecosystems. In turn, loss of biodiversity can            strengthen the science-policy interface for biodiversity and ecosystem
                                          adversely affect climate – for example, deforestation increases the       services for the conservation and sustainable use of biodiversity,
                                          atmospheric abundance of carbon dioxide, a key greenhouse gas.            long-term human well-being and sustainable development.

WWF LIVING PLANET REPORT 2020 12                                                                                                                                                               13
THE LIVING PLANET INDEX:
                                                                                                                    Thousands of population trends are brought together in the LPI to
                                                                                                                    calculate the average percentage change in population sizes since
                                                                                                                    1970 using an index (Figure 1). The percentage doesn’t represent

AN EARLY WARNING INDICATOR ON THE
                                                                                                                    the number of individual animals lost but reflects the average
                                                                                                                    proportional change in animal population sizes tracked over
                                                                                                                    46 years.

HEALTH OF NATURE                                                                                                    Since the last Living Planet Report (2018) the number of species
                                                                                                                    represented has improved for the majority of regions and
                                                                                                                    taxonomic groups, with the biggest boost being to amphibian
Species population trends are important because they are a                                                          species. New ways to discover and extract this data are under
                                                                                                                    development, including the automatic identification of relevant
measure of overall ecosystem health. Serious declines are a                                                         data sources using artificial intelligence. At present the LPI contains

proxy for the unravelling of nature and our planet is flashing                                                      data only for vertebrate species as, historically, these have been
                                                                                                                    better monitored; but efforts to incorporate data on invertebrates
red warnings signs of systems failure.                                                                              are underway as we try to broaden our understanding of changes
                                                                                                                    in wildlife populations. These efforts are starting with insects,
                                                                                                                    including a European grassland butterfly LPI.
       Louise McRae, Stefanie Deinet,    The Living Planet Index (LPI) now tracks the abundance of
                                                                                                                    Understanding how species populations may change in years to
   Valentina Marconi, Kate Scott-Gatty   almost 21,000 populations of mammals, birds, fish, reptiles and
                                                                                                                    come is another huge challenge, and new techniques – such as
              and Robin Freeman (ZSL)    amphibians around the world. For two decades it has used the
                                                                                                                    predictive modelling and machine learning – are starting to help
                                         trends that emerge as a measure for changes in biodiversity. The
                                                                                                                    us see how wildlife might respond to projected future changes in
                                         building blocks for this indicator are wildlife population datasets
                                                                                                                    climate and land use (see the scenarios in Chapter 4).
                                         gathered from almost 4,000 sources. The majority of these are
                                         publicly available and are found in scientific literature or in online
                                         repositories of wildlife census data such as the African elephant
                                         database 2 and the Australian Threatened Species Index data
                                         portal 3.

                                         The collection of population trend data is often time-consuming
                                         and can be challenging. Increasingly, citizen scientists are
                                         volunteering their time to count species, from birds to butterflies.
                                         One of the longest-running bird surveys, the Audubon Christmas
                                         Bird Count 4, has thousands of people counting the birds of North
                                         America every year, and similar projects are expanding all over
                                         the globe. Another example is the first State of India’s Birds
                                         report that has been published using sightings data from
                                         birdwatchers 5. The LPI is missing data for some species or places
                                         that are challenging to monitor; however advancing technology
                                         is set to change that as datasets are compiled in increasingly
                                         sophisticated and varied ways. We now use audio devices to
                                         monitor insect sounds 6, environmental DNA to track populations of
                                         specific species like polar bears 7, and drones to count wildlife more
                                         precisely 8. Future editions of the LPI will be able to incorporate this
                                         trend data as it emerges.

WWF LIVING PLANET REPORT 2020 14                                                                                                                                                              15
At a population level: in 2020 what does the Living                                         The LPI explained
                      Planet Index show?
                      The 2020 global Living Planet Index shows an average 68%
                      decrease in monitored vertebrate species populations between 1970
                      and 2016.

                                       Using the data from 20,811 populations of 4,392 species, the 2020
                                       global LPI shows an average 68% decline in monitored populations
                                       between 1970 and 2016 (range: -73% to -62%).

                                       This year’s index includes 400 new species and 4,870 new
                                       populations. The representation of neotropical amphibians has
                                       increased the most as we try to fill data gaps for tropical species.
                                       Adding new data and taxa into the Living Planet Database, the
                                       collection of population trends that are the key components of
                                       the LPI, helps to make the index a better reflection of trends in
                                       biodiversity. Adding these new data updates all of the annual LPI
                                       values and accounts for the differences seen between each version          How to read the Living Planet Index                                    Figure 2: Locations of
                                                                                                                                                                                         Living Planet Index species
                                       of the LPI (see technical supplement).                                     • In 2020, the LPI shows an average rate of decline in population     populations
                                                                                                                                                                                         Locations of Living Planet Index
                                       The 2020 global LPI runs from 1970 to 2016, starting at a value of 1         size of 68% between 1970 and 2016.                                   species populations. Map showing
                                                                                                                                                                                         the locations of the monitored
                                       in 1970. This was set as a common starting year for many indicators        • The LPI now tracks the abundance of almost 21,000 populations       populations in the LPI. Newly
                                       because not enough earlier information is available; and it ends in          of mammals, birds, fish, reptiles and amphibians around the          added populations since the last
                                       2016 to reflect the latest year for which there is a good amount of          world.
                                                                                                                                                                                         report are highlighted in orange or
                                                                                                                                                                                         in yellow for species new to the LPI.
                                       data and the time lag in collecting, processing and publishing it.                                                                                Source: WWF/ZSL (2020) 107.
                                                                                                                  • The LPI includes data for threatened and non-threatened
                                                                                                                    species – if it’s monitored consistently over time, it goes in!      Key

                                                             2                                                    • Species and populations in the LPI are increasing, declining              New species
Figure 1: The global Living
Planet Index: 1970 to 2016                                                                                          or stable.                                                                 New populations
Average abundance of 20,811                                                                                                                                                                    Existing data
populations representing 4,392                                                                                    • About half of the species in the LPI show an average decline in
                                    Index value (1970 = 1)

species monitored across the
globe declined by 68%. The white
                                                                                                                    population size.
line shows the index values and
the shaded areas represent the                               1
statistical certainty surrounding
the trend (range: -73% to -62%).                                                                                  What the LPI does not tell us
Source - WWF/ZSL (2020) 107.
                                                                                                                  • The LPI doesn’t show numbers of species lost or extinctions.
Key                                                                                                       - 68%
       Global Living Planet Index
                                                                                                                  • It does not mean that X% of species or populations are declining.
                                                             0
       Confidence limits
                                                                 1970   1980   1990   2000      2010    2016      • Or that X% of populations or individuals have been lost.

WWF LIVING PLANET REPORT 2020 16                                                                                                                                                                                                 17
Biodiversity is declining at different rates in different places including the Aichi Biodiversity Targets,
Sustainable Development Goals, and National
the Americas, this region was further subdivided
in two: North America, and Latin America and
Biodiversity Strategies and Action Plans. In the Caribbean (Mesoamerica, the Caribbean
The global LPI does not give us the entire picture – there are differences in 2020, in order to align with IPBES, regional and South America combined). Trends for each
abundance trends between regions, with the largest declines in tropical areas. Living Planet indices have been divided slightly species group are weighted according to how
differently to previous years. Following the many species are found in each IPBES region.
regional classifications in Figure 3, all terrestrial Threats to populations in each region are shown
In 2019, the landmark IPBES global assessment scale of regions and sub-regions, rather than a and freshwater populations within a country on page 21, and detail behind the trends can be
on the state of biodiversity divided the world into global approach, also allows for a more focused were assigned to an IPBES region. In the case of found in the technical supplement.
different geographic regions (Figure 3) in order way of monitoring progress towards targets
to complete regular and timely assessments of developed under the Convention
biodiversity, ecosystem services, their linkages, on Biological Diversity,
2
threats, and the impacts of these at regional and
Index value (1970 = 1)
sub-regional levels 1. Using a smaller spatial
1
- 24%
0
1970 1980 1990 2000 2010 2016
2
Index value (1970 = 1)
1
- 33%
0
1970 1980 1990 2000 2010 2016
2
Index value (1970 = 1)
Figure 3: The Living Planet
Index for each IPBES region:
1
1970 to 2016 9
The white line shows the index
values and the shaded areas - 45%
represent the statistical certainty 2
surrounding the trend (95%). 0
All indices are weighted by species 1970 1980 1990 2000 2010 2016
Index value (1970 = 1)
richness, giving species-rich
taxonomic groups in terrestrial and
1 2
freshwater systems more weight
than groups with fewer species.
Source - WWF/ZSL (2020) 107.
Index value (1970 = 1)
0 - 94% 1
1970 1980 1990 2000 2010 2016
- 65%
0
1970 1980 1990 2000 2010 2016
WWF LIVING PLANET REPORT 2020 18 19Threats to biodiversity Regional threats to populations in the LPI
5%
Changes in land and sea use, including habitat loss and degradation
2
10.2%
Index value (1970 = 1)
This refers to the modification of the environment where a species lives, by complete
removal, fragmentation or reduction in quality of key habitat. Common changes in
use are caused by unsustainable agriculture, logging, transportation, residential or
14.4%
52.5%
1
- 33%
NORTH AMERICA
commercial development, energy production and mining. For freshwater habitats,
fragmentation of rivers and streams and abstraction of water are common threats.
17.9%
0
Species overexploitation
1970 1980 1990 2000 2010 2016
4% 2
7.5%
There are both direct and indirect forms of overexploitation. Direct overexploitation
Index value (1970 = 1)
refers to unsustainable hunting and poaching or harvesting, whether for subsistence
or for trade. Indirect overexploitation occurs when non-target species are killed
10.9%
1 EUROPE AND
CENTRAL ASIA
unintentionally, for example as bycatch in fisheries. 57.9% - 24%
19.7%
Invasive species and disease
0
Invasive species can compete with native species for space, food and other resources, 1970 1980 1990 2000 2010 2016
can turn out to be a predator for native species, or spread diseases that were not 2
previously present in the environment. Humans also transport new diseases from one
2.3% 12.5%
area of the globe to another.
Index value (1970 = 1)
Pollution 12.2%
51.2%
1 LATIN AMERICA
Pollution can directly affect a species by making the environment unsuitable for its
& CARIBBEAN
21.8%
survival (this is what happens, for example, in the case of an oil spill). It can also affect
0 - 94%
a species indirectly, by affecting food availability or reproductive performance, thus 1970 1980 1990 2000 2010 2016
reducing population numbers over time.
2.8% 4.1% 2
Climate change
11.6%
Index value (1970 = 1)
As temperatures change, some species will need to adapt by shifting their range to
track a suitable climate. The effects of climate change on species are often indirect.
Changes in temperature can confound the signals that trigger seasonal events such
45.9%
1
AFRICA
as migration and reproduction, causing these events to happen at the wrong time 35.5% - 65%
(for example misaligning reproduction and the period of greater food availability in a 0
specific habitat). 1970 1980 1990 2000 2010 2016
5% 2
Figure 4: Different threat types in the Living Figure 5: The proportion of threats 11%
Index value (1970 = 1)
Planet Database recorded in each category for
Descriptions of the major threat categories used in the
Living Planet Database. This classification reflects the
populations in each IPBES region 9
The number of populations with threat
14% 43%
1
ASIA PACIFIC
direct drivers with the largest global impact as identified data available is shown next to the pie - 45%
by IPBES 1; it is also followed by the IUCN Red List and is chart 107. The colour of each section refers to
based on the original classification by Salafsky, N. et al. the colour for each threat category on the 26.9%
(2010) 10. Source WWF/ZSL (2020) 107. opposite page. 0
1970 1980 1990 2000 2010 2016
WWF LIVING PLANET REPORT 2020 20 21Zooming in on Latin America and the Caribbean
The 94% decline in the LPI for the tropical subregions of the
Americas is the most striking result observed in any region. The
conversion of grasslands, savannahs, forests and wetlands, the
overexploitation of species, climate change, and the introduction of
alien species are key drivers.
Stefanie Deinet and Much of the overall decline in the 2020 Latin America and
Louise McRae (ZSL), Caribbean LPI is driven by very negative trends in reptiles,
Paula Valdujo (WWF-Brazil) amphibians and fish – groups which, according to our data, are
and Marcio Martins each affected by a different cocktail of threats. For reptiles, these
(Universidade de São Paulo) include land-use change and overexploitation. Freshwater fish are
affected most by overexploitation in this dataset; however, habitat
fragmentation due to hydropower development is already severely
impacting populations in this region 11 and is predicted to pose an
even greater threat in the future 12.
For amphibians, disease and habitat loss are the biggest threats.
The Atlantic Forest in Brazil has lost 87.6% of its natural vegetation
since 1500, mostly during the last century, which has led to at
least two amphibian extinctions and 46 species threatened with
extinction 13. The infection rate of the chytrid fungus, which is
impacting amphibians worldwide, is high among Atlantic Forest
amphibians 14; and this, combined with climate change and land-
use change, might have an even more dramatic impact on their
populations in the coming decades.
More than 2,000 species of amphibian are threatened with
extinction 15, the highest current estimate among vertebrate
groups. For amphibians in the LPI, disease is the main recorded
threat. In El Copé in the highlands of central Panama, the chytrid
fungus caused mass mortality, leading to the loss of 30 amphibian
species and severely reducing the diversity of the local amphibian
community 16.
Tree frog in the rain, Manu National Park, Peru. Image from the Our Planet series, © Paul Stewart / Netflix / Silverback
WWF LIVING PLANET REPORT 2020 22 23The Freshwater Living Planet Index The bigger the size, the bigger the threats
Species with a larger body size compared with other species in the
On average, population trends for monitored freshwater species same taxonomic group are sometimes referred to as ‘megafauna’.
appear to be falling steeply, with megafauna particularly at risk. Across the world, these species are particularly at risk 114: they tend
to be less resilient to changes in the environment because they
generally require complex and large habitats, reproduce at a later
Louise McRae, Stefanie Deinet, Almost one in three freshwater species are threatened with stage in life and have fewer offspring 115.
Valentina Marconi, Kate Scott-Gatty extinction, with all taxonomic groups showing a higher risk of
and Robin Freeman (ZSL) extinction in the freshwater, compared to the terrestrial, In the freshwater system, megafauna are species that grow to
system 106. If we look at population trends using the Living Planet more than 30kg, such as sturgeon and Mekong giant catfish, river
Index, a similar story emerges. dolphins, otters, beavers and hippos. They are subject to intense
anthropogenic threats 116, including overexploitation 114, and strong
The 3,741 monitored populations – representing 944 species population declines have been observed as a result 117. Mega-fishes
of mammals, birds, amphibians, reptiles and fishes – in the are particularly vulnerable. Catches in the Mekong river basin
Freshwater Living Planet Index have declined by an average of between 2000 and 2015, for example, have decreased for 78%
84% (range: -89% to -77%), equivalent to 4% per year since of species, and declines are stronger among medium- to large-
1970. Most of the declines are seen in freshwater amphibians, bodied species 118. Large fishes are also heavily impacted by dam
reptiles and fishes; and they’re recorded across all regions, construction, which blocks their migratory routes to spawning and
particularly Latin America and the Caribbean (see page 22). feeding grounds 116, 119.
Habitat degradation through pollution or flow modification, Large-scale cross-boundary collaboration is required to effectively
overexploitation, invasive species 108 and sand mining in rivers 109 protect freshwater species 113, and some persistent conservation
is among the threats affecting freshwater species. Conservation efforts have proved successful. The Eurasian beaver (Castor fiber),
action often fails to target freshwater species or habitats 110-112, partly for instance, has now been reintroduced into many countries from
because the protection of freshwater environments often requires which it had disappeared, including Czechia, Estonia, Finland, Close up of the head of a West Indian
large-scale, multi-sectoral efforts 113. manatee (Trichechus manatus) under
Sweden and the UK 120. water, Crystal River, Florida.
Figure 6: The Freshwater
Living Planet Index: 1970 to 2
2016 © WWF / Vincent Kneefel
The average abundance of
3,741 freshwater populations,
representing 944 species,
Index value (1970 = 1)
monitored across the globe declined
by 84% on average. The white
line shows the index values and
the shaded areas represent the 1
statistical certainty surrounding
the trend (range: -89% to -77%) 107.
Key
Freshwater Living Planet
Index
- 84%
0
Confidence limits
1970 1980 1990 2000 2010 2016
WWF LIVING PLANET REPORT 2020 24 25The Living Planet Index is one indicator among trends over time in their relative survival probability based on these
Red List categories. Baseline RLI values are available for a range
many showing severe declines or changes in recent of additional groups that have only been assessed once. These data
shows that cycads (an ancient group of plants) are most threatened,
decades
while corals are declining fastest.
Humanity’s influence on the decline of nature is so great that
Community composition: the Mean Species
scientists believe we are entering a new geological epoch, the Abundance Index and Biodiversity Intactness Index
Anthropocene. Yet, measuring biodiversity, the variety of all living Biological communities can change fundamentally as a result Andy Purvis (Natural History Museum)
things, is complex, and there is no single measure that can capture of human pressures compared to what they would have been in
all of the changes in this web of life. Nevertheless, the vast majority pristine conditions, even without any species going locally extinct.
Tracking community composition – the species that are present
of indicators show net declines over recent decades. and their local abundances – can give an indication of both the
intactness and functioning of ecosystems. The Mean Species
Abundance (MSA) Index 18 and Biodiversity Intactness
Piero Visconti (IIASA), The LPI measures the population abundance of thousands of
Index (BII) 19, are two modelled indices that estimate the
Robin Freeman (ZSL) vertebrate species around the world. Other indices measure
intactness of animal and plant communities spatially. The indices
different things, or have broader taxonomic breadth, giving us
range from 100-0%, with 100 representing an undisturbed natural
different information about how biodiversity is responding to
human pressures, as well as conservation interventions.
environment with little to no human footprint. The MSA Index COMPOSITION
has fallen to 66% of its pre-impact value and is falling by 1.1% per
Indicators of the extent and structural condition of ecosystems,
decade, whereas the BII has fallen to 79% of its pre-impact value
of the composition of ecological communities, and of species
and is declining by 0.8% per decade 1. Both the MSA and BII are
populations overwhelmingly show net declines over recent
projected to continue to decline under business-as-usual socio-
decades 17. In this report we have included the IUCN Red List Index
economic trends.
that tracks extinction risk; the Mean Species Abundance Index
Species distribution: the Species Habitat Index
and Biodiversity Intactness Index that look at changes in species
ABUNDANCE community composition; and the Species Habitat Index that
measures changes in species distribution.
Species distributions are dynamic by nature, with local populations Walter Jetz (Yale University)
Extinction risk: the IUCN Red List Index
constantly adapting to the environment. The magnitude of
these dynamics has, however, been greatly altered by human
pressures, especially those that have caused the loss of habitats.
Stuart Butchart (BirdLife International), Humans have driven at least 680 species of vertebrates, the best
The Species Habitat Index captures changes in species range and
Craig Hilton-Taylor (IUCN) studied taxonomic group, to extinction since 1500 1. This equates
incorporates information about species habitat preferences with
to ~1% of species in these groups. Many other species are
observed or modelled data on habitat loss and restoration, habitat
now at elevated risk of extinction owing to human impacts.
fragmentation and climate change. This index has fallen by 1% per
The IUCN Red List represents the most comprehensive and
decade since 1970 20 and, on average, the geographic distribution
objective system for assessing the relative risk of extinction of
of terrestrial mammals, the only group for which baseline
species 15. Over 100,000 species have now been evaluated using
information on life-history traits, population and distribution size
distribution could be estimated, has been reduced to 83% of DISTRIBUTION
pre-impact values 21.
and structure, and their change over time to assign each species
into one of eight categories (Extinct, Extinct in the Wild, Critically
Endangered, Endangered, Vulnerable, Near Threatened, Least
EXTINCTION RISK Concern or Data Deficient). For five groups in which all species
have been assessed at least twice, the Red List Index (RLI) shows
WWF LIVING PLANET REPORT 2020 26 272 1.0 Bony fishes Cone snails
Better Corals
Dragonflies Legumes
Birds
Red List Index of species survival
0.9
Reptiles Monocots
Index value (1970 = 1)
Mammals
Crustaceans
0.8 Sharks & rays
Amphibians Conifers
1
0.7
0.6
ABUNDANCE - 68%
Worse
Cycads
EXTINCTION RISK
0 0.5
1970 1980 1990 2000 2010 2016 1970 1980 1990 2000 2010 2020
Living Planet Index between 1970 and 2016 (range: -73% to -62%). The percentage
change in the index doesn’t represent the number of individual Red List Index future 22). An index value of 0 equates to all species having
gone Extinct. A constant value over time indicates that the
The Living Planet Index (LPI) now tracks the abundance of animals lost but reflects the average proportional change in The Red List Index, based on data from the IUCN Red List of overall extinction risk for the group is unchanged. If the rate
almost 21,000 populations of mammals, birds, fish, reptiles animal population sizes tracked over 46 years. Threatened Species 15, shows trends in survival probability of biodiversity loss were reducing, the index would show an
and amphibians around the world 107. Using the data from (the inverse of extinction risk) over time 22. A Red List Index upward trend. A decline in the index means that species are
20,811 populations of 4,392 species, the 2020 global LPI value of 1.0 equates to all species within a group qualifying as being driven towards extinction at an accelerating rate.
shows an average 68% decline in monitored populations Least Concern (i.e. not expected to become Extinct in the near
1
1
0.995
Species Habitat Index
BII by IPBES region
0.990
0.8
0.985 Global
Americas
Asia Pacific
0.980 Africa
DISTRIBUTION Europe - Central Asia
2014
COMPOSITION
0.975 0.6
2001 2005 2010 2015 2018 1700 1750 1800 1850 1900 1950 2000
Species Habitat Index observed or modelled habitat change 26. Between 2000 and
2018 the index has fallen by 2%, indicating a strong and Biodiversity Intactness Index services). For this reason, it is used in the Planetary
Boundaries framework as an indicator of biosphere
Human land-use change, and increasingly climate change, are general downward trend in habitat available to species. For The Biodiversity Intactness Index (BII) estimates how much integrity 28. The global average BII (79%) is well below
altering landscapes worldwide. Remotely sensed monitoring select regions and species the SHI decrease is much steeper, originally present biodiversity remains on average across the proposed lower safe limit (90%) and continues to fall,
and model-based projections offer an increasingly strong with double-digit percentage losses suggesting extensive the terrestrial ecological communities within a region. It especially in Africa 19 (note the steep decline in the brown line
and near-global capture of these changes to the land cover. contractions in total population sizes and thus the ecological focuses on the effects of land use and related pressures, which above), suggesting that the world’s terrestrial biodiversity
The Species Habitat Index (SHI) quantifies the resulting roles provided by species. have so far been the dominant drivers of biodiversity loss 27, 1. is already dangerously compromised. The BII is very low
implications for species populations 24, 25. For thousands of Because it is estimated across a very large set of ecologically in some regions, such as Western Europe, that have a long
species with validated habitat associations worldwide the diverse animal and plant species, the BII is a useful index of history of intensive use of the landscape (for a global BII map,
index measures the losses in habitat-suitable range from ecosystems’ ability to provide benefits to people (ecosystem see the technical supplement).
WWF LIVING PLANET REPORT 2020 28 29Uncovering trends from the tiniest
creatures to the canopy
From the biggest to the smallest living things on Earth,
monitoring tells us that nature is under serious pressure.
Tigers and polar bears are well-known poster species in the
story of biodiversity decline, but what of the billions of tiny or
as-yet-undiscovered species that are also under threat? What
is happening to the life in our soils, biodiversity that plays a
critical role in the ecosystem services on which we depend?
Or to insects in tropical regions in light of studies in North
America and Europe that may represent an early warning for
the rest of the world?
For the first time this Living Planet Report also investigates the
status of plants, which provide fundamental support for life on
Earth and are the basis of virtually all terrestrial ecosystems.
The number of documented terrestrial plant extinctions is twice
as high as for mammals, birds and amphibians combined.
Leaf-cutter bee (Megachile sp) and
milkweed, Highmore, South Dakota, USA. © WWF-US / Clay Bolt
WWF LIVING PLANET REPORT 2020 30 31SOIL BIODIVERSITY: SAVING THE WORLD
Additionally, policies on land use, agriculture, ecosystems
restoration, climate change mitigation and adaptation, pollution
remediation and urban planning should highlight the importance
BENEATH OUR FEET
of healthy soils in order to reduce threats to soil biodiversity
and people.
Figure 7: Soil communities
Soil biodiversity underpins terrestrial
Soil is a critical component of the natural environment – yet ecosystems (agricultural, urban, nature
and all biomes, including forests,
most people are totally unaware of, or underestimate, the vital grasslands, tundra and deserts). Here,
animals are divided into layers by size
role that soil biodiversity plays in the ecosystem services on but in reality, animals are distributed
throughout the soil.
which we depend.
MEGAFAUNA
Monica Kobayashi and Soil hosts one of the largest reservoirs of biodiversity on Earth:
Ronald Vargas (FAO/GSP) up to 90% of living organisms in terrestrial ecosystems, including
MACROFAUNA
some pollinators, spend part of their life cycle in soil habitats 29.
The variety of soil components, filled with air and water, create
an incredible diversity of habitats for a myriad of different soil
organisms that underpin our life on this planet.
MESOFAUNA
Besides food production, soil biodiversity provides a vast range
of ecosystem functions and services, including soil formation, MICROBES & MICROFAUNA
the retention and purification of water, nutrient cycling, the
degradation of some soil contaminants and the regulation of
greenhouse gases, as well as sustaining plant, animal and
human health.
Without soil biodiversity, terrestrial ecosystems may collapse. Soil organisms vary from 20nm to 20-30cm and are traditionally divided into four
We now know that above- and belowground biodiversity are in size classes 121, 122, 123.
constant collaboration 30-32, and an improved understanding of Megafauna (20mm+) vertebrates (mammalia, reptilia and amphibia). They create
this relationship will help to better predict the consequences of spatial heterogeneity on the soil surface and in its profile through movement.
biodiversity change and loss.
Macrofauna (2mm-20mm) are large soil invertebrates (earthworms, enchytraeids,
woodlice, myriapods, insect larvae). They are ecosystem engineers, moving through
The Status of the World’s Soil Resources 33 concluded that the loss
the soil, thus perturbing the soil and increasing water permeability, soil aeration,
of soil biodiversity is considered one of the major soil threats in and creating new habitats for smaller organisms. Their faeces are hotspots for
many regions of the world. Some responses to bend the curve of microbial diversity and activity.
biodiversity loss include sustainable use of soil genetic resources
Mesofauna (0.1-2mm) are soil microarthropods (mites, apterygota, small
and improved soil management to safeguard soil biota as well as larvae of insects). They live in soil cavities filled with air and form coprogenic
its multiple functions 34. Future agricultural systems may need to microaggregates; increase the surface of active biochemical interactions in the soil;
participate in the transformation of soil organic matter.
combine traditional practices, nature-based solutions and novel
technologies such as artificial intelligence, DNA sequencing and Microbes (viruses, bacteria, archaea, fungi; 20nm-10um) and Microfauna
microbiome-based precision farming. (soil protozoa and nematodes; 10um - 0.1mm) mostly live in soil solutions in
gravitational, capillary and hygroscopic water; they participate in decomposition
of soil organic matter, as well as in the weathering of minerals in the soil. Their
diversity depends on the conditions of microhabitats and on the physicochemical
properties of soil horizons.
WWF LIVING PLANET REPORT 2020 32 33Soil biodiversity and agricultural ecosystems For this reason, the JRC is currently conducting an assessment of
soil biodiversity across the European Union as part of the Land
Use and Coverage Area frame Survey (LUCAS) 41. Through genomic
Soil biodiversity keeps us alive, so we need to ensure that we stop analysis, the diversity of soil organisms will be measured in relation
destroying it. With this in mind, the European Commission’s Joint to specific land uses (e.g. different farming systems) and the
Research Centre is carrying out genetic analyses of the soils of the presence of pollutants, such as metals and pesticide residues.
European Union to measure how their diversity is related to specific
land uses and the presence of pollutants. © Graham Montgomery
Monica Kobayashi and The State of the World’s Biodiversity for Food and Agriculture
Ronald Vargas (FAO/GSP) report 35 concluded that many species living in and around
and Alberto Orgiazzi production systems, particularly microorganisms and invertebrates,
and Arwyn Jones (JRC) have never been documented. In many cases, the contributions
of specific biodiversity components to production systems are
poorly understood. Increasing soil organisms’ diversity is linked
to an increase in soil functions and the provision of services. This
includes support to plant growth as well as higher nutrient use
efficiency 36. Soil biota also help to build resilience and to control,
prevent or suppress pests and diseases 37. Diversification of
agricultural systems and improved tree cover can also contribute
to enhancing below- and aboveground biodiversity and, as a result,
the ecosystem services it provides 38. Understanding and promoting
these soil dynamics could help not only to protect plants, animals
and humans; it could also help us to live in harmony with nature.
In addition to agriculture, the European Commission’s Joint
Research Centre (JRC) has identified the key drivers of
pressures on soil organisms. These include climate change (both
temperature and precipitation have significant effects on soil-
dwelling communities), land-use change (especially the sealing
of soil by impervious layers such as asphalt or concrete), habitat
fragmentation, intensive human exploitation, soil organic matter
decline, pollution (including industrial emissions), and the
introduction and diffusion of invasive alien species 39.
Researchers are starting to better understand the complexity of soil
biodiversity which is composed of microorganisms, macro- and
megafauna. Some threats, like pesticides, may potentially impact
only a single entity of soil-dwelling organisms, and at different
A two-pronged bristletail (Order
levels of intensity. However, the loss of a single element may cause Diplura) in Ithica, NY.
the collapse of the entire food web. Other threats, such as erosion
or soil-sealing, can result in the complete – and in some cases
irreversible – loss of habitat 40.
WWF LIVING PLANET REPORT 2020 34 35You can also read