LIVING PLANET REPORT 2020 - SUMMARY BENDING THE CURVE OF BIODIVERSITY LOSS
←
→
Page content transcription
If your browser does not render page correctly, please read the page content below
LIVING PLANET
REPORT 2020
BENDING THE CURVE OF BIODIVERSITY LOSS

SUMMARY

                                   SUMMARY 1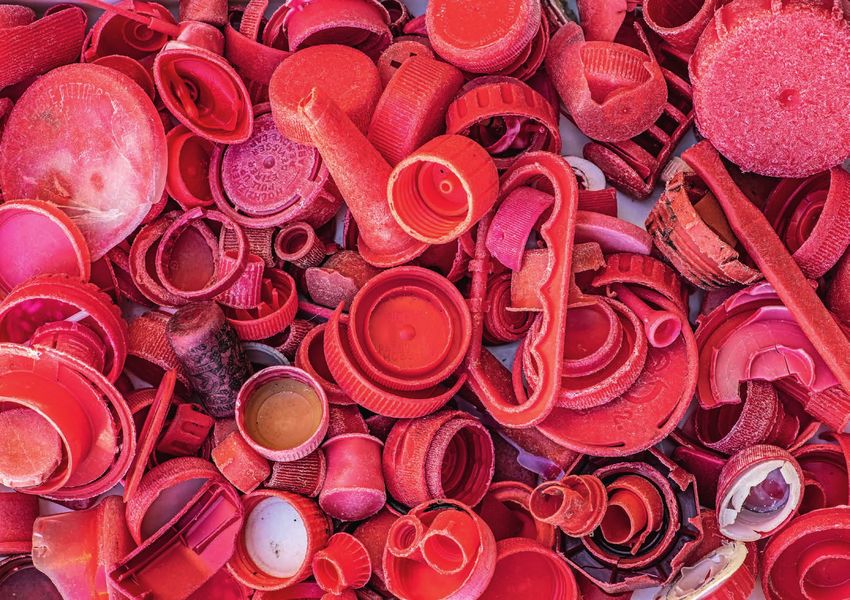
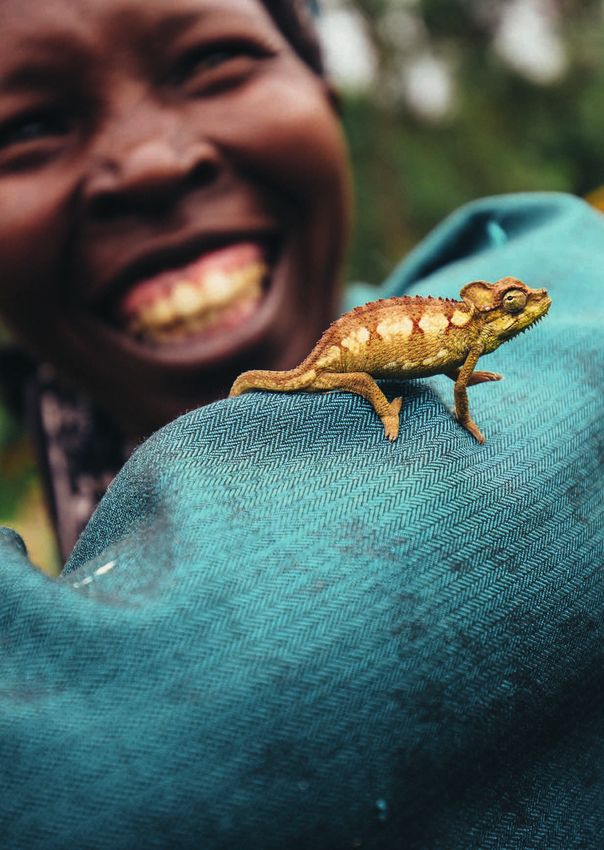
WWF
WWF is one of the world’s largest and most experienced independent
conservation organizations, with over 5 million supporters and a global
network active in more than 100 countries. WWF’s mission is to stop
the degradation of the planet’s natural environment and to build a
future in which humans live in harmony with nature, by conserving the
world’s biological diversity, ensuring that the use of renewable natural
resources is sustainable, and promoting the reduction of pollution and
wasteful consumption.

Institute of Zoology (Zoological Society of London)
Founded in 1826, ZSL (Zoological Society of London) is an international
conservation charity working to create a world where wildlife
thrives. ZSL’s work is realised through ground-breaking science, field
conservation around the world and engaging millions of people
through two zoos, ZSL London Zoo and ZSL Whipsnade Zoo.

ZSL manages the Living Planet Index® in a collaborative partnership
with WWF.

Citation
WWF (2020) Living Planet Report 2020 -
Bending the curve of biodiversity loss.
Almond, R.E.A., Grooten M. and Petersen, T. (Eds).
WWF, Gland, Switzerland.

Design and infographics by: peer&dedigitalesupermarkt

Cover photograph: © Jonathan Caramanus / Green Renaissance / WWF-UK
Farmer Nancy Rono with a chameleon on her sleeve, Bomet County,
Mara River Upper Catchment, Kenya.

Living Planet Report®
and Living Planet Index®
are registered trademarks
of WWF International.
8 BILLION REASONS TO
SAFEGUARD NATURE
As the world reels from the deepest global disruption of a lifetime,
this year’s Living Planet Report provides unequivocal evidence that
nature is unravelling and that our planet is flashing red warning
signs. Humanity’s destruction of nature is having catastrophic
impacts not only on wildlife populations but also on human health
and all aspects of our lives.

A deep cultural and systemic shift is urgently needed, one that so
far our civilisation has failed to embrace: a transition to a society
and economic system that values nature. We must rebalance
our relationship with the planet to preserve the Earth’s amazing
diversity of life and enable a just, healthy and prosperous
society – and ultimately to ensure our own survival.

Nature is declining globally at rates unprecedented in millions
of years. The way we produce and consume food and energy,
and the blatant disregard for the environment entrenched in our
current economic model, has pushed the natural world to its limits.                         © WWF
COVID-19 is a clear manifestation of our broken relationship
with nature, and highlights the deep interconnection between            Marco Lambertini,
                                                                        Director General
the health of both people and the planet.
                                                                        WWF International
It is time we answer nature’s SOS. Not just to secure the amazing
diversity of life we love and have the moral duty to coexist with,
but because ignoring it puts the future of nearly 8 billion people
at stake.

A better future starts with the decisions that governments,
companies and people around the world take today. World leaders
must take urgent action to protect and restore nature as the
foundation for a healthy society and a thriving economy.

It’s time for the world to agree a New Deal for Nature and People,
committing to stop and reverse the loss of nature by 2030 and
build a carbon-neutral and nature-positive society. This is our best
safeguard for human health and livelihoods in the long term, and
to ensure a safe future for our children.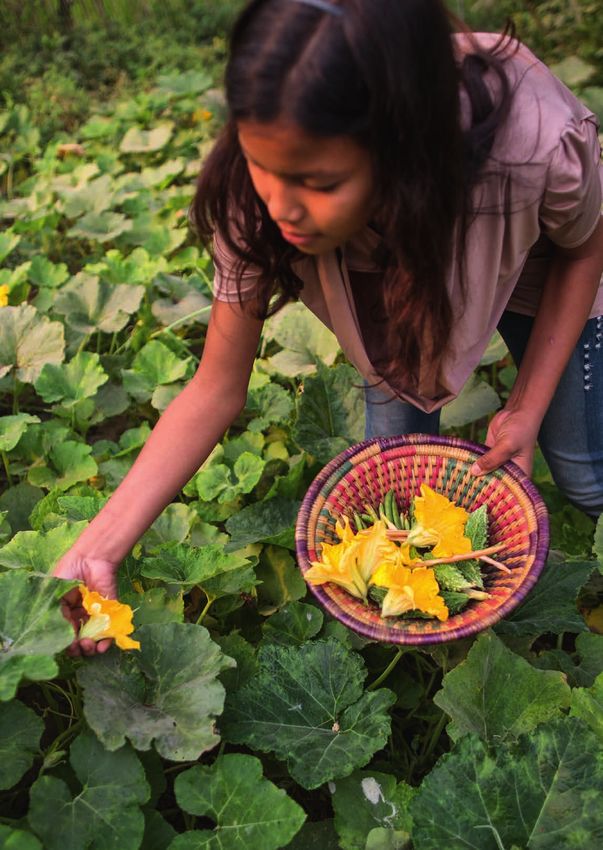
SETTING THE SCENE
Nature is essential for human existence and a good quality of
life, providing and sustaining the air, freshwater and soils on
which we all depend. It also regulates the climate, provides
pollination and pest control and reduces the impact of natural
hazards. While more food, energy and materials than ever
before are being supplied to people in most parts of the world,
the overexploitation of plants and animals is increasingly
eroding nature’s ability to provide them in the future.

                                  In the last 50 years our world has been transformed by an explosion
                                  in global trade, consumption and human population growth, as well
                                  as an enormous move towards urbanisation. These underlying trends
                                  are driving the destruction and degradation of nature, with the world
                                  now overusing natural resources at an unprecedented rate. Only a
                                  handful of countries retain most of the last remaining wilderness
                                  areas. As a result, our natural world is transforming more rapidly
                                  than ever before.

                                  The 2020 global Living Planet Index shows an average 68% fall in
                                  monitored populations of mammals, birds, amphibians, reptiles
                                  and fish between 1970 and 2016. Species’ population trends are
                                  important because they are a measure of overall ecosystem health.
                                  Measuring biodiversity, the variety of all living things, is complex,
                                  and there is no single measure that can capture all the changes in
                                  this web of life. Nevertheless, the vast majority of indicators show net
                                  declines over recent decades.

                                  Can we reverse these trends of decline? This was the question posed
                                  in 2017 by the Bending the Curve Initiative – a consortium of WWF
                                  and more than 40 universities, conservation organisations and
                                  intergovernmental organisations – in order to research and model
                                  pathways to bend the curve of biodiversity loss.

WWF LIVING PLANET REPORT 2020 4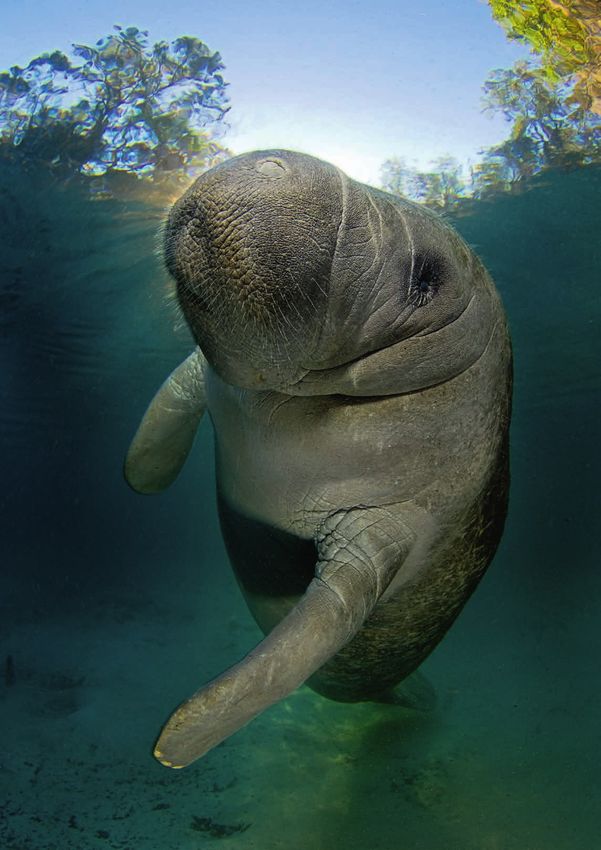
Now, this pioneering modelling has provided ‘proof of concept’ that
we can halt and reverse terrestrial biodiversity loss from land-use
change. With an unprecedented and immediate focus on both
conservation and a transformation of our modern food system, this
gives us a roadmap to restore biodiversity and feed a growing human
population.

To do this will require strong leadership and action by us all. To
complement the voices of the Bending the Curve Initiative we also
asked thinkers and practitioners, both young and established, from
different countries and cultures around the globe to share with
us how they picture a healthy planet for people and nature. Their
thoughts are brought together in a first-time special supplement to
the 2020 Living Planet Report, ‘Voices for a Living Planet.’

Recently, a series of catastrophic events – wildfires, locust
plagues and the COVID-19 pandemic – have shaken the world’s
environmental conscience, showing that biodiversity conservation
should be a non-negotiable and strategic investment to preserve
our health, wealth and security. 2020 was billed as the ‘super year’
in which the international community, through an historic series
of climate, biodiversity and sustainable development meetings,
had great plans to take the reins of the Anthropocene – but, due to
COVID-19, most of these conferences have been pushed into 2021.

The current state of our planet confirms that the world and its
leaders should embrace a new global deal for people and nature that
sets us on a path where both can thrive.

We know that this WWF 2020 Living Planet Report is being
published at a challenging time. As the world inevitably enters a
period of greater turbulence, volatility and change, we have brought
together information and knowledge that we hope will inspire
action to address the critical global ecological, social and economic
challenges of our time.

                                                                        SUMMARY 5
AN SOS FOR NATURE
Biodiversity as we know it today is fundamental to human
life on Earth, and the evidence is unequivocal – it is being
destroyed by us at a rate unprecedented in history 12.

                                  Since the industrial revolution, human activities have increasingly
                                  destroyed and degraded forests, grasslands, wetlands and other
                                  important ecosystems, threatening human well-being. Seventy-
                                  five per cent of the Earth’s ice-free land surface has already been
                                  significantly altered, most of the oceans are polluted, and more than
                                  85% of the area of wetlands has been lost.

                                  The most important direct driver of biodiversity loss in terrestrial
                                  systems in the last several decades has been land-use change,
                                  primarily the conversion of pristine native habitats into agricultural
                                  systems; while much of the oceans have been overfished. Globally,
                                  climate change has not been the most important driver of the loss of
                                  biodiversity to date, yet in coming decades it is projected to become
                                  as, or more, important than the other drivers.

                                  The loss of biodiversity is not only an environmental issue but a
                                  development, economic, global security, ethical and moral one. It
                                  is also a self-preservation issue. Biodiversity plays a critical role in
                                  providing food, fibre, water, energy, medicines and other genetic
                                  materials; and is key to the regulation of our climate, water quality,
                                  pollution, pollination services, flood control and storm surges. In
                                  addition, nature underpins all dimensions of human health and
                                  contributes on non-material levels – inspiration and learning,
                                  physical and psychological experiences and shaping our identities –
                                  that are central in quality of life and cultural integrity.

WWF LIVING PLANET REPORT 2020 6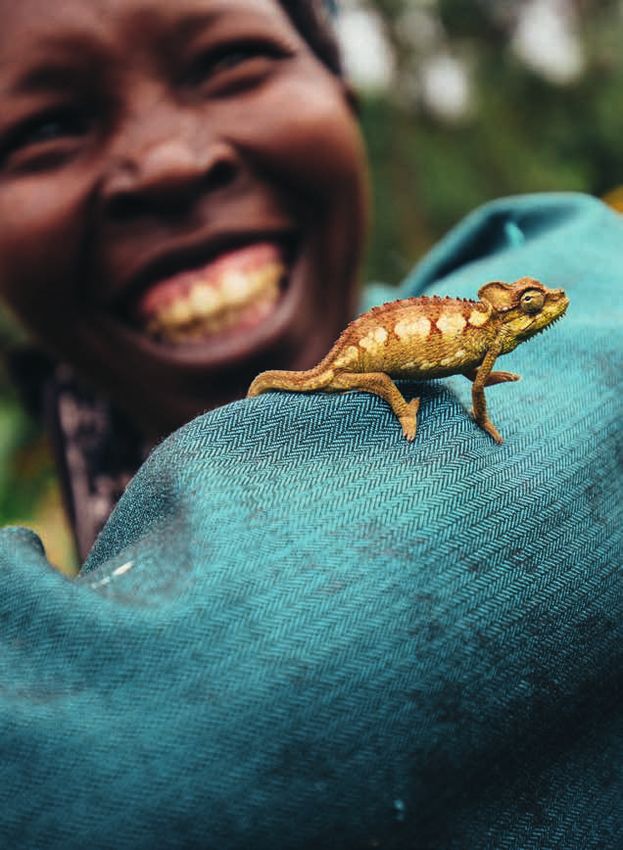
At a population level: in 2020 what does the Living
   Planet Index show?
   Species’ population trends are important because they are a
   measure of overall ecosystem health. Serious declines are a proxy
   for the unravelling of nature.

   The Living Planet Index (LPI) now tracks the abundance of
   almost 21,000 populations of mammals, birds, fish, reptiles and
   amphibians around the world. The building blocks for this indicator
   are wildlife population datasets. These population trends are
   brought together in the LPI to calculate the average percentage
   change in population sizes since 1970 using an index (Figure 1).
   This year’s index includes almost 400 new species and 4,870 new
   populations.

   Since the last Living Planet Index was released in 2018, the number
   of species represented has improved for the majority of regions
   and taxonomic groups, with the biggest boost being to amphibian
   species. At present the LPI contains data only for vertebrate species
   as, historically, these have been better monitored; but efforts
   to incorporate data on invertebrates are underway as we try to
   broaden our understanding of changes in wildlife populations.

   The 2020 global Living Planet Index shows an average 68% (range:
   -73% to -62%) fall in monitored populations of mammals, birds,
   amphibians, reptiles and fish between 1970 and 2016 1.

                                                                             Figure 1: The global Living
                         2
                                                                             Planet Index: 1970 to 2016
                                                                             Average abundance of 20,811
                                                                             populations representing 4,392
                                                                             species monitored across the
Index value (1970 = 1)

                                                                             globe declined by 68%. The white
                                                                             line shows the index values and
                                                                             the shaded areas represent the
                         1                                                   statistical certainty surrounding
                                                                             the trend (range: -73% to -62%).
                                                                             Sourced from WWF/ZSL (2020) 1.

                                                                             Key
                                                                     - 68%
                                                                                    Global Living Planet Index

                         0
                                                                                    Confidence limits
                             1970   1980   1990   2000     2010    2016

                                                                                                    SUMMARY 7
Biodiversity is declining at different rates in different places
The global LPI does not give us the entire picture – there are differences in
abundance trends between regions, with the largest declines in tropical areas.

The 94% decline in the LPI for the tropical                                                                        the overexploitation of species, climate change,
subregions of the Americas is the most striking                                                                    and the introduction of alien species
result observed in any region. The conversion of                                                                   are key drivers.
grasslands, savannahs, forests and wetlands,

                                            2
                   Index value (1970 = 1)

                                            1

                                                                                                                      - 33%

                                            0
                                                1970   1980   1990   2000                                   2010    2016

                                                                                                     2
                                                                            Index value (1970 = 1)

                                                                                                     1

                                                                                                     0                                                 - 94%
                                                                                                         1970         1980    1990    2000    2010   2016

WWF LIVING PLANET REPORT 2020 8
Figure 2: The Living Planet Index for each IPBES region
                                            The white line shows the index values and the shaded areas represent the statistical certainty
                                            surrounding the trend (95%). All indices are weighted by species richness, giving species-rich taxonomic
                                            groups in terrestrial and freshwater systems more weight than groups with fewer species. Regions map:
                                            IPBES (2015) 2. LPI data WWF/ZSL (2020) 1.

                                                                             2
                                                    Index value (1970 = 1)

                                                                             1

                                                                                                                                                                    - 24%

                                                                             0
                                                                                 1970          1980           1990   2000                                  2010   2016

                                                                                                                                                2
                                                                                                                       Index value (1970 = 1)

                                                                                                                                                1

                                                                                                                                                                                                   - 45%

                                                                                                                                                0
                                                                                                                                                    1970          1980      1990   2000   2010   2016

                         2
Index value (1970 = 1)

                         1

                                                                                                      - 65%
                         0
                             1970   1980   1990       2000                              2010      2016

                                                                                                                                                                                                           SUMMARY 9
The Freshwater Living Planet Index
                                              Freshwater biodiversity is declining far faster than that in our
                                              oceans or forests. Based on available data, we know that almost
                                              90% of global wetlands have been lost since 1700 83; and global
                                              mapping has recently revealed the extent to which humans have
                                              altered millions of kilometres of rivers 84. These changes have had a
                                              profound impact on freshwater biodiversity with population trends
                                              for monitored freshwater species falling steeply.

                                              The 3,741 monitored populations – representing 944 species
                                              of mammals, birds, amphibians, reptiles and fishes – in the
                                              Freshwater Living Planet Index have declined by an average of
                                              84% (range: -89% to -77%), equivalent to 4% per year since 1970
                                              (Figure 3). Most of the declines are seen in freshwater amphibians,
                                              reptiles and fishes; and they’re recorded across all regions,
Figure 3: The Freshwater
                                              particularly Latin America and the Caribbean.
Living Planet Index: 1970
to 2016
                                                                    2
The average abundance of
3,741 freshwater populations,
representing 944 species monitored
across the globe, declined by 84%
                                           Index value (1970 = 1)

on average. The white line shows
the index values and the shaded
areas represent the statistical
certainty surrounding the trend                                     1
(range -89% to -77%). Sourced from
WWF/ZSL (2020) 1.

Key

       Freshwater Living Planet
       Index                                                                                                     - 84%
                                                                    0
       Confidence limits
                                                                        1970   1980   1990   2000      2010    2016

                                              The bigger the size, the bigger the threats
                                              Species with a larger body size compared with other species in the
                                              same taxonomic group are sometimes referred to as ‘megafauna’.
                                              In the freshwater system, megafauna are species that grow to
                                              more than 30kg, such as sturgeon and Mekong giant catfish, river
                                              dolphins, otters, beavers and hippos. They are subject to intense
                                              anthropogenic threats 3, including overexploitation 4, and strong
                                              population declines have been observed as a result 5. Mega-fishes are
                                              particularly vulnerable. Catches in the Mekong river basin between
                       Photo right page:      2000 and 2015, for example, have decreased for 78% of species,
   A young Florida manatee (Trichechus        and declines are stronger among medium- to large-bodied species 6.
     manatus latirostrus) stays warm in
    a freshwater spring in winter, Three      Large fishes are also heavily impacted by dam construction, which
           Sisters Spring, Florida, USA.      blocks their migratory routes to spawning and feeding grounds 7, 3.

WWF LIVING PLANET REPORT 2020 10
© naturepl.com / Alex Mustard / WWF
SUMMARY 11The Living Planet Index is one indicator among many showing
severe declines in recent decades
2
Index value (1970 = 1)
1
ABUNDANCE - 68%
0
1970 1980 1990 2000 2010 2016
Living Planet Index shows an average 68% decline in monitored populations
The Living Planet Index (LPI) now tracks the abundance of between 1970 and 2016 (range: -73% to -62%). The percentage
almost 21,000 populations of mammals, birds, fish, reptiles change in the index doesn’t represent the number of individual
and amphibians around the world 1. Using the data from animals lost but reflects the average proportional change in
20,811 populations of 4,392 species, the 2020 global LPI animal population sizes tracked over 46 years.
1
0.995
Species Habitat Index
0.990
0.985
0.980
DISTRIBUTION
0.975
2001 2005 2010 2015 2018
Species Habitat Index index measures the losses in habitat-suitable range from
Human land-use change, and increasingly climate change, are observed or modelled habitat change 10. Between 2000 and
altering landscapes worldwide. Remotely sensed monitoring 2018 the index has fallen by 2%, indicating a strong and
and model-based projections offer an increasingly strong general downward trend in habitat available to species. For
and near-global capture of these changes to the land cover. select regions and species the SHI decrease is much steeper,
The Species Habitat Index (SHI) quantifies the resulting with double-digit percentage losses suggesting extensive
implications for species populations 8, 9. For thousands of contractions in total population sizes and thus the ecological
species with validated habitat associations worldwide the roles provided by species.
WWF LIVING PLANET REPORT 2020 12Humanity’s influence on the decline of nature is things, is complex, and there is no single measure
so great that scientists believe we are entering that can capture all of the changes in this web
a new geological epoch, the Anthropocene. Yet, of life. The vast majority of indicators show net
measuring biodiversity, the variety of all living declines over recent decades.
1.0 Bony fishes Cone snails
Better Corals
Dragonflies Legumes
Birds
Red List Index of species survival
0.9
Reptiles Monocots
Mammals
Crustaceans
0.8 Sharks & rays
Amphibians Conifers
0.7
EXTINCTION RISK
0.6
Cycads
Worse
0.5
1970 1980 1990 2000 2010 2020
Red List Index Extinct in the near future). An index value of 0 equates to
all species having gone Extinct. A constant value over time
The Red List Index (RLI), based on data from the IUCN indicates that the overall extinction risk for the group is
Red List of Threatened Species 85, shows trends in survival unchanged. If the rate of biodiversity loss were reducing, the
probability (the inverse of extinction risk) over time 86. A Red index would show an upward trend. A decline in the index
List Index value of 1.0 equates to all species within a group means that species are being driven towards extinction at an
qualifying as Least Concern (i.e. not expected to become accelerating rate.
1
BII by IPBES region
0.8
Global
Americas
Asia Pacific
Africa
Europe - Central Asia COMPOSITION
2014
0.6
1700 1750 1800 1850 1900 1950 2000
Biodiversity Intactness Index ecosystems’ ability to provide benefits to people (ecosystem
services). For this reason, it is used in the Planetary
The Biodiversity Intactness Index (BII) estimates how much Boundaries framework as an indicator of biosphere integrity 13.
originally present biodiversity remains on average across The global average BII (79%) is well below the proposed lower
the terrestrial ecological communities within a region. It safe limit (90%) and continues to fall, especially in Africa 14,
focuses on the effects of land use and related pressures, which suggesting that the world’s terrestrial biodiversity is already
have so far been the dominant drivers of biodiversity loss 11, 12. dangerously compromised. The BII is very low in some
Because it is estimated across a very large set of ecologically regions, such as Western Europe, that have a long history of
diverse animal and plant species, the BII is a useful index of intensive use of the landscape.
SUMMARY 13Soil biodiversity: saving the world beneath our feet
Soil is a critical component of the natural environment – yet
most people are totally unaware of, or underestimate, the vital role
that soil biodiversity plays in the ecosystem services on which
we depend.
Soil hosts one of the largest reservoirs of biodiversity on Earth:
up to 90% of living organisms in terrestrial ecosystems, including
some pollinators, spend part of their life cycle in soil habitats 75.
The variety of soil components, filled with air and water, create
an incredible diversity of habitats for a myriad of different soil
organisms that underpin our life on this planet.
Without soil biodiversity, terrestrial ecosystems may collapse.
We now know that above- and belowground biodiversity are in
constant collaboration 15-17, and an improved understanding of
this relationship will help to better predict the consequences of
biodiversity change and loss.
Figure 4: Soil communities
Soil biodiversity underpins terrestrial
ecosystems (agricultural, urban, nature
and all biomes, including forests,
grasslands, tundra and deserts)
MEGAFAUNA
MACROFAUNA
MESOFAUNA
MICROBES & MICROFAUNA
WWF LIVING PLANET REPORT 2020 14Are “the little things that run the world” disappearing?
There is evidence of recent, rapid declines in insect abundance,
diversity and biomass, but the picture is complex and most
evidence comes from a few taxa and a few countries in the northern
hemisphere.
E.O. Wilson famously described them as “the little things that run
the world” 18 and in Western Europe and North America, insect
monitoring schemes and long-term studies show startlingly rapid,
recent and ongoing declines in insect numbers, distributions or
collective weight (biomass). Given that the spread of intensive
agriculture occurred earlier in Western Europe and North
America than in other regions 19, it seems likely that the insect
losses being observed there provide a forecast of global insect
losses if anthropogenic disturbance and land-use change continue
worldwide. Initiating long-term and large scale monitoring is key to
understanding current and future levels of insect population change.
50
Number of datasets
40
20
0
1925 1950 1975 2000 2025
Figure 5: Estimates of long-term change in terrestrial insect numbers Key
(abundance or biomass), from 103 studies reviewed by Van Klink et al
(2020) 77. Three-quarters of the studies (77/103) are from Europe and North Trend slope
America, with very few from Africa (1), Asia (5, excluding Russia and the Middle
East) or South America (3). The inset shows a histogram of the number of Decrease Increase
datasets with at least one data point for each year.
SUMMARY 15Plant diversity is in serious decline
Plants are the structural and ecological foundation of virtually all
terrestrial ecosystems and provide fundamental support for life on
Earth. They are vital to human health, food and well-being 20.
Nymphaea thermarum, the world’s
smallest waterlily, known only
from the damp mud created by the
overflow from a single hot spring in
Rwanda. The last plant desiccated
and died when the stream feeding
the hot spring was diverted for
local agriculture in 2008. An ex situ
collection is being maintained at the
Royal Botanic Gardens Kew: in the
hope of a possible reintroduction © Andrew McRobb - Trustees of the Royal Botanic Gardens Kew
if this fragile habitat can be restored.
Plant diversity loss not only
threatens plants and their
ecosystems, but also the invaluable
spectrum of services that plants
provide to people and the planet.
Arabica coffee (Coffea arabica) is
the world’s most popular coffee
bean. An extinction risk assessment
which incorporated the likely effects
of climate change categorised
C. arabica as Endangered, with a
predicted loss of more than half its © Jenny Williams, RBG Kew
natural population by 2088 23.
WWF LIVING PLANET REPORT 2020 16Plant extinction risk is comparable to that of mammals and higher
than for birds. The number of documented plant extinctions is
twice as many as for mammals, birds and amphibians combined 21.
In addition, an assessment of a sample of thousands of species
representing the taxonomic and geographic breadth of global
plant diversity showed that one in five (22%) are threatened with
extinction, most of them in the tropics 22.
The first Global Tree Assessment
will cover all 60,000 known tree
species across the planet to give us a
complete picture of the conservation
status of the world’s trees 24. Beyond
trees, the results will also be vital for
other biodiversity and ecosystems
that depend on trees for their
survival, to guide conservation
action and ensure that biodiversity
is managed, restored and saved
from extinction.
Terminalia acuminata, commonly
known as Guarajuba, is an
Endangered tree endemic to Brazil.
Previously thought to be Extinct
in the Wild, it was rediscovered
© Malin Rivers when reassessed for the Global Tree
Assessment.
Seed banks worldwide hold around
7 million crop samples, helping to
safeguard biodiversity and global
nutritional security. In the past
few decades hundreds of local,
national, regional and international
seed banks have been established.
Perhaps the most well-known,
the Svalbard Global Seed Vault in
Norway, provides a back-up service
for when things go wrong in other
seed banks. Seed banks are used
by researchers and plant breeders
to develop new, improved crop
varieties.
A view of the front of the Svalbard
© Svalbard Global Seed Vault / Riccardo Gangale Global Seed Vault, Svalbard
archipelago, Norway.
SUMMARY 17OUR WORLD IN 2020
In the last 50 years our world has been transformed by
an explosion in global trade, consumption and human
population growth, as well as an enormous move towards
urbanisation, changing how we live unrecognisably. Yet this
has come at a huge cost to nature and the stability of the
Earth’s operating systems that sustain us.
A. gross domestic product (GDP) per person B. extraction of living biomass C. protection of key biodiversity areas
GDP per person x 1,000 (US$ 2010)
average % of key biodiversity areas
50 30 80
covered by protected areas
total million tonnes / year
70
40 25
60
20
30 50
15 40
20 30
10
20
10 5
10
0 0 0
1970 1980 1990 2000 2010 2017 1970 1980 1990 2000 2010 2017 1970 1980 1990 2000 2010 2018
D. total population E. urban population F. child mortality rate
% of the total country population
8 8 250
number of people (billion)
deaths / 1,000 live births
7 7
living in urban areas
200
6 6
5 5 150
4 4
3 3 100
2 2
50
1 1
0 0 0
1970 1980 1990 2000 2010 2017 1970 1980 1990 2000 2010 2017 1970 1980 1990 2000 2010 2017
Key Figure 6: Development pathways since 1970 have featured unequal
benefits and burdens that differ across countries
Developed economies The lowest increases in GDP have occurred in the currently least developed countries
Developing economies (a), while increased consumption in more developed countries has increased
extraction of living materials from nature that largely come from developing
Least developed economies countries (b) and protection of key biodiversity areas has been highest in developed
World countries (c). Total human population has increased more rapidly in developing
countries (d) while urban population is largest in developed countries and increasing
fastest in least developed countries (e). Child mortality has sharply decreased
globally, though challenges remain for least developed countries (f).
Sources: modified from World Bank (2018) 27, IPBES (2019) 26.
This collection of red plastic is just a small selection of the plastic pollutants
collected by the Rame Peninsula Beach Care Group in Whitsand Bay, Cornwall.
WWF LIVING PLANET REPORT 2020 18© Sam Hobson / WWF-UK
SUMMARY 19Humanity now overspends its biological budget every year
Since 1970, our Ecological Footprint has exceeded these resources differs from resource availability,
the Earth’s rate of regeneration. This overshoot since resources are not consumed at the point of
erodes the planet’s health and, with it, humanity’s extraction. The Ecological Footprint per person,
prospects. Both human demand and natural across countries, provides insights into countries’
resources are unevenly distributed across the resource performance, risks and
Earth. The pattern of human consumption of opportunities 28-30.
Figure 7: Global map of
the Ecological Footprint of
consumption per person in 2016
The Ecological Footprint per person is
a function of both total population and
rates of consumption within a country.
A country’s consumption includes
the Ecological Footprint it produces,
plus imports from other countries,
minus exports. Sourced from Global
Footprint Network (2020) 31.
Key
> 5 gha/person
3.5 - 5 gha/person
2 - 3.5 gha/person
1.6 - 2 gha/person
< 1.6 gha/person
Insufficient data
WWF LIVING PLANET REPORT 2020 20Varying levels of Ecological Footprint are due to residents consume, the natural resources they
different lifestyles and consumption patterns, use, and the carbon dioxide emitted to provide
including the quantity of food, goods and services these goods and services.
SUMMARY 21Mapping the last wilderness areas on Earth
Advances in satellite technology allow us to visualise how the Earth
is changing in real time. Human footprint mapping then shows
where we are and aren’t impacting land on Earth. The latest map
Figure 8:
The broad methodological
framework used to create a map
of cumulative human pressure –
adapted from Watson and Venter
(2019) 33.
population density
cropland
railways and roads
HIGH
night-time lights
navigable waterways LOW
built environments
pasture land
1.Identyfie
1. Identifycore
core
human 2.2. Acquire
Acquireor or develop
develop data on 3.3. Assign
Assignrelative
relative
pressure 4.4. OOverlay
verlayindividual
individual
pressures to
pressures
human pressures individual
data onhuman pressures
individual scores to individual
pressure scorespressures
to create Human Footprint
pressures to createmaps
human pressures individual pressure Human Footprint maps
WWF LIVING PLANET REPORT 2020 22reveals that just a handful of countries – Russia, Canada, Brazil and
Australia – contain most of the places without a human footprint,
the last remaining terrestrial wilderness areas on our planet 32.
Key Figure 9:
The proportion of each terrestrial biome (excluding
Damaged Intact Wilderness Antarctica) considered wilderness (dark green, human
High: 50 High: 1 High: 0 footprint value ofOur ocean is in ‘hot water’ Overfishing, pollution and coastal
development, among other pressures,
have impacted the entire ocean, from
DRIVER OF CHANGE POTENTIAL NEGATIVE IMPACTS
Fishing Overexploitation, bycatch of non-target species, seafloor
habitat destruction from seafloor trawling, illegal,
unregulated, and unreported (IUU) fishing, gathering of
organisms for the aquarium trade.
Climate change Warming waters, ocean acidification, increased oxygen
minimum zones, more frequent extreme events, change in
ocean currents.
Land-based pollution Nutrient run-off, contaminants such as heavy metals, micro-
and macro-plastics.
Ocean-based pollution Waste disposal, fuel leaks and dumping from ships, oil spills
from offshore platforms, noise pollution.
Coastal development Destruction of habitats, increased pressure on local
shorelines, increased pollution and waste.
Invasive alien species Invasive species accidentally (e.g. through ballast water) or
deliberately introduced; more climate-driven invasions likely.
Offshore infrastructure
Physical disturbance of the seafloor, creation of habitat
structure.
Shipping
Vessel strikes, pollution from dumping.
Mariculture
(aquaculture of marine organisms) Physical presence of aquaculture facilities, pollution.
Deep-sea mining
Seafloor destruction, settlement plumes on seabed,
potential for leakages and chemical spills, noise pollution.
WWF LIVING PLANET REPORT 2020 24shallow waters to the deep sea, and climate change
will continue to cause a growing spectrum of effects
across marine ecosystems.
EXAMPLES OF ECOLOGICAL CONSEQUENCES
Figure 10:
Reduced population sizes, ecosystem restructuring and trophic cascades, Anthropogenic drivers of change
in marine ecosystems, types of
reductions in body size, local and commercial extinction of species, ‘ghost- negative impact that can arise
fishing’ due to lost or dumped fishing gear. from them, and examples of
potential ecological consequences.
Reef die-off through bleaching, species moving away from warming waters, It is important to recognise that
changes in ecological interactions and metabolism, changes in interactions negative impacts can be mitigated
with human activities (e.g. fishing, vessel strikes) as organisms alter their and must be weighed against
societal benefits in some cases.
location and space use, changes in ocean circulation patterns and productivity, For deep-sea mining, impacts
changes in disease incidence and the timing of biological processes. are projected since it is not yet
applied at scale. Note that impacts
Algal blooms and fish kills, accumulation of toxins up the food web, ingestion for individual drivers can vary
from very local to global scales.
of and entanglement in plastic and other debris. Sourced from IPBES (2019) 26 and
references therein.
Toxic impacts on marine organismal physiology, noise pollution impacts on
marine animal behaviour.
Reduction in area of habitats such as mangroves and seagrasses, limits the
ability of coastal habitats and organisms to shift and migrate to adapt to
climate change.
Invasive species can outcompete native species, disrupt ecosystems and
cause local or global extinctions.
Local seafloor habitat destruction, provision of structures for organisms to
colonise and aggregate around.
Impacts on population sizes of endangered marine mammals hit by vessels,
physiological and physical impacts of pollution.
Potential for nutrient build-up and algal blooms, disease, antibiotic use,
escape of captive organisms and impacts on local ecosystem, indirect impact
of capture fisheries to source fishmeal as foodstuff.
Destruction of physical habitat (e.g. cold-water corals) and benthic layer,
potential smothering of organisms by settlement plumes.
SUMMARY 25CLIMATE CHANGE RISKS TO
BIODIVERSITY
Up to one-fifth of wild species are at risk of extinction this
century due to climate change alone, even with significant
mitigation efforts, with some of the highest rates of loss
anticipated in biodiversity ‘hotspots’.
Just 30 years ago, climate change impacts on species were extremely
rare, but today they are commonplace. Some species are relatively
Figure 11: Species exposed buffered from changes (e.g. deep-sea fishes), but others (e.g. Arctic
to climate change pressures and tundra species) already face enormous climate change pressures.
may be impacted through Such pressures impact species through various mechanisms
five mechanisms, in positive,
negative or combined ways including direct physiological stress, loss of suitable habitat,
Each species’ sensitivity and disruptions of interspecies interactions (such as pollination or
adaptive capacity to these interactions between predators and prey), and the timing of key life
impacts is influenced by its
unique biological traits and life events (such as migration, breeding or leaf emergence) (Figure 11) 34.
history. Together, these pressures,
mechanisms, sensitivities and Recent climate change impacts on flying foxes and the Bramble
adaptive capacity affect each Cay melomys show how quickly climate change can lead to drastic
species’ vulnerability to extinction
(Figure adapted from Foden et al. population declines, and warn of unseen damage to less conspicuous
(2018) 34). species (see boxes).
Exposure to
CLIMATE CHANGE PRESSURES
MECHANISM OF NEGATIVE IMPACT MECHANISM OF POSITIVE IMPACT
1. ABIOTIC CONDITIONS BECOME DECREASINGLY ADA
PTI 1. ABIOTIC CONDITIONS BECOME INCREASINGLY
ALIGNED WITH PHYSIOLOGICAL PREFERENCES ITY VE ALIGNED WITH PHYSIOLOGICAL PREFERENCES
TIV
SI
CAP
IMPACTS ON SPECIES
SEN
2. HABITAT OR MICROHABITAT DECLINES 2. HABITAT OR MICROHABITAT INCREASES
ACIT
IN AVAILABILITY OR QUALITY IN AVAILABILITY OR QUALITY
Y
Changes in population
3. INTERSPECIES INTERACTIONS ALTER. distribution and genetic 3. INTERSPECIES INTERACTIONS ALTER.
DETRIMENTAL, BENEFICIAL BENEFICIAL, DETRIMENTAL
characteristics lead to
altered vulnerability
4. DISRUPTION OF PHENOLOGY 4. BENEFICIAL CHANGE IN PHENOLOGY
to extinction
ADA
IT Y
P TI
CA SI
T IV
VE
5. EXACERBATION OF NON-CLIMATE CHANGE PAC 5. MITIGATION OF NON-CLIMATE CHANGE
IT Y SEN
RELATED THREATS RELATED THREATS
WWF LIVING PLANET REPORT 2020 26The first mammal extinction from climate change
The Bramble Cay melomys
(Melomys rubicola), the first
mammal to become extinct
as a direct result of climate
change, Bramble Cay, Torres
Strait Islands, Australia.
© Bruce Thompson / Auswildlife
The Bramble Cay melomys, Melomys rubicola, mammal extinction to be linked directly to
made headlines in 2016 when it was declared climate change 35. This rodent has been lost. It
extinct following intensive surveys of the will, however, remain immortalised as a stark
5-hectare coral cay in Australia’s Torres Strait reminder that the time to act on climate change
where the species lived. It is the first known is now 36.
Temperatures rise, bats fall
A spectacled flying fox
© Martin Harvey / WWF (Pteropus conspicillatus)
colony leaving roost at sunset,
Australia. Flying foxes roost
en masse, making detection
of population-level impacts of
extreme events easier than for
solitary species.
Flying foxes (genus Pteropus) are not and they begin to clump together in a frenzy to
physiologically capable of tolerating escape the heat. As they drop from the trees,
temperatures above 42oC 37. At these many are injured or become trapped and die.
temperatures, their usual coping behaviours Between 1994 and 2007, more than 30,000
– such as shade-seeking, hyperventilation and flying foxes from at least two species, from a
spreading saliva on their bodies (they can’t global population of less than 100,000, are
sweat) – are insufficient to keep them cool, thought to have died during heatwaves 37, 38.
SUMMARY 27STRETCHING OUR SAFETY NET
ALMOST TO BREAKING POINT
REGULATION OF ENVIRONMENTAL PROCESSES
People value nature in many different ways,
and bringing these together can be used to
shape policies that will create a healthy and
resilient planet for people and nature.
Nature’s contributions to People refers to all the
contributions, both positive and negative that
nature makes to people’s quality of life 40.
The Nature’s Contributions to People concept
includes a wide range of descriptions of human
dependence on nature, such as ecosystem goods
and services, nature’s gifts, and many others.
It recognizes the central role that culture plays in
defining all links between people and nature.
It also elevates, emphasises and operationalises
the role of indigenous and local knowledge 40,26.
This table represents the global trends for some
of these contributions from 1970 to the present
MATERIALS AND ASSISTANCE
day and it was included in the IPBES Summary
for Policy Makers 26.
Figure 12: Key
Global trends from
1970 to the present of the
18 categories of Nature’s
Global trends
Contributions to People:
14 of the 18 categories
NON-MATERIAL
Decrease Increase
analysed have declined
since 1970 (Figure
adapted from Díaz et al.
(2019) 11, IPBES Levels of certainty
(2019) 26).
Well established
Established but incomplete
Unresolved
WWF LIVING PLANET REPORT 2020 28NATURE’S CONTRIBUTION TO PEOPLE 50-YEAR GLOBAL TREND SELECTED INDICATOR
• Extent of suitable habitat
HABITAT CREATION AND MAINTENANCE
• Biodiversity intactness
POLLINATION AND DISPERSAL OF SEEDS • Pollinator diversity
AND OTHER PROPAGULES • Extent of natural habitat in agricultural areas
• Retention and prevented emissions of air pollutants by
REGULATION OF AIR QUALITY ecosystems
• Prevented emissions and uptake of greenhouse gases by
REGULATION OF CLIMATE ecosystems
• Capacity to sequester carbon by marine and terrestrial
REGULATION OF OCEAN ACIDIFICATION environments
REGULATION OF FRESHWATER QUANTITY,
• Ecosystem impact on air-surface-ground water partitioning
LOCATION AND TIMING
REGULATION OF FRESHWATER AND • Extent of ecosystems that filter or add constituent
COASTAL WATER QUALITY components to water
FORMATION, PROTECTION AND DECONTAMINATION
• Soil organic carbon
OF SOILS AND SEDIMENTS
REGULATION OF HAZARDS AND
• Ability of ecosystems to absorb and buffer hazards
EXTREME EVENTS
REGULATION OF DETRIMENTAL ORGANISMS • Extent of natural habitat in agricultural areas
AND BIOLOGICAL PROCESSES • Diversity of competent hosts of vector-borne diseases
• Extent of agricultural land – potential land for bioenergy
ENERGY production
• Extent of forested land
• Extent of agricultural land – potential land for food and feed
FOOD AND FEED production
• Abundance of marine fish stocks
• Extent of agricultural land – potential land for material
MATERIALS AND ASSISTANCE production
• Extent of forested land
MEDICINAL, BIOCHEMICAL AND • Fraction of species locally known and used medicinally
GENETIC RESOURCES • Phylogenetic diversity
• Number of people in close proximity to nature
LEARNING AND INSPIRATION
• Diversity of life from which to learn
PHYSICAL AND
• Area of natural and traditional landscapes and seascapes
PSYCHOLOGICAL EXPERIENCES
SUPPORTING IDENTITIES • Stability of land use and land cover
• Species’ survival probability
MAINTENANCE OF OPTIONS
• Phylogenetic diversity
SUMMARY 29Intrinsically interlinked:
healthy planet, healthy people
The past century has seen extraordinary gains in human health
and well-being. Child mortality among under-5s has halved since
1990 42, the share of the world’s population living on less than $1.90
a day fell by two-thirds over the same period 43, and life expectancy
at birth is around 15 years higher today than it was 50 years ago 44.
This is rightly celebrated, but it has been achieved alongside the
exploitation and alteration of the world’s natural systems, which
threatens to undo these successes.
The links between BIODIVERSITY and HEALTH are diverse, from
traditional medicines and pharmaceuticals derived from plants to
water filtration by wetlands 26, 47, 48.
HEALTH is “A state of complete physical, mental and social well-
being and not merely the absence of disease or infirmity. The
enjoyment of the highest attainable standard of health is one of the
fundamental rights of every human being without distinction of
race, religion, political belief, economic or social condition.”
The World Health Organization, WHO (1948) 45.
BIODIVERSITY is “The fruit of billions of years of evolution, shaped by
natural processes and, increasingly, by the influence of humans.
It forms the web of life of which we are an integral part and upon
which we so fully depend. It also encompasses the variety of
ecosystems such as those that occur in deserts, forests, wetlands,
mountains, lakes, rivers, and agricultural landscapes. In each
ecosystem, living creatures, including humans, form a community,
interacting with one another and with the air, water, and
soil around them.” The Convention on Biological Diversity,
CBD (2020) 46.
WWF LIVING PLANET REPORT 2020 30DISASTER RISK
AGRICULTURAL
BIODIVERSITY
WATER QUALITY
NUTRITION
FOOD & WATER CLIMATE AIR QUALITY
SECURITY CHANGE
TRADITIONAL
MEDICINE
HEALTH
OUTCOMES
MENTAL HEALTH SUSTAINABLE MICROBIAL
DEVELOPMENT BIODIVERSITY
ECOSYSTEMS
BIOMEDICAL/PHARMACEUTICAL
DISCOVERY
INFECTIOUS DISEASES
Figure 13:
Reprinted figure from
“Connecting global priorities:
Biodiversity and human
health a state of knowledge
review,” World Health
Organization (WHO) and
Secretariat of the Convention
on Biological Diversity (CBD),
Copyright (2015) 49
SUMMARY 31Human wealth depends on nature’s health
Our economies are embedded within nature, and it is only by
recognising and acting on this reality that we can protect and
enhance biodiversity and improve our economic prosperity.
COVID-19 is nature sending us a message. In fact, it reads like an
SOS signal for the human enterprise, bringing into sharp focus
the need to live within the planet’s ‘safe operating space’. The
environmental, health and economic consequences of failing to do
so are disastrous.
Now more than ever before, technological advances allow us to
listen to such messages and better understand the natural world.
We can estimate the value of ‘natural capital’ – the planet’s stock of
renewable and non-renewable natural resources, like plants, soils
and minerals – alongside values of produced and human capital –
for example, roads and skills – which together form a measure of a
country’s true wealth.
Data from the United Nations Environment Programme shows
that, per person, our global stock of natural capital has declined
nearly 40% since the early 1990s, while produced capital has
doubled and human capital has increased by 13% 82.
But too few of our economic and finance decision-makers know
how to interpret what we are hearing, or, even worse, they choose
not to tune in at all. A key problem is the mismatch between the
artificial ‘economic grammar’ which drives public and private policy
and ‘nature’s syntax’ which determines how the real world operates.
The result is that we miss the message.
So, if the language of economics is failing us, how and where
do we begin to find better answers? Unlike standard models of
economic growth and development, placing ourselves and our
economies within nature helps us to accept that our prosperity is
ultimately bounded by that of our planet. This new grammar is
needed everywhere, from classrooms to boardrooms, and from
local councils to national government departments. It has profound
implications for what we mean by sustainable economic growth,
helping to steer our leaders towards making better decisions that
deliver us, and future generations, the healthier, greener, happier
lives that more and more of us say we want.
From now on, protecting and enhancing our environment must be
at the heart of how we achieve economic prosperity.
WWF LIVING PLANET REPORT 2020 32© Karine Aigner / WWF-US
Salima Gurau picks vegetables from the gardens
of the homestay her family runs in Nepal.
SUMMARY 33Biodiversity is fundamental to food security
Urgent action is needed to address the loss of the biodiversity that
feeds the world.
LIVELIHOODS FOOD SECURITY
Domesticated
TERRESTRIAL
PLANTS
Around 6000 species 61 of which 9 account for 2/3 of crop production 67
DIRECT: BIODIVERSITY USED AS FOOD
Thousands of varieties, landraces and cultivars (exact numbers unknown) 57 -
some 5.3 million samples are stored in gene banks 66
TERRESTRIAL
ANIMALS
About 40 species of birds and mammals, of which 8 provide more than
95% of the human food supply from livestock 59
About 8800 breeds (distinct within-species populations) 65
AQUATIC ANIMALS
AND PLANTS
Almost 700 species used in aquaculture, of which 10 account for
50% of production 64
Few recognised strains (distinct within-species populations) 64
MICRO-ORGANISMS
AND FUNGI
Thousands of species of fungi and micro-organisms essential for food
processes such as fermentation 55
Around 60 species of edible fungi commercially cultivated 60
INDIRECT: BIODIVERSITY THAT CREATES THE CONDI
GENES, SPECIES AND
ECOSYSTEMS
Thousands of species of pollinators, soil engineers, natural enemies of pests, nitrogen-fixing
bacteria, and wild relatives of domesticated species.
WWF LIVING PLANET REPORT 2020 34In 2019, the UN Food and Agriculture that biodiversity brings to food and agriculture,
Organization (FAO) launched the first report on examines how farmers, pastoralists, forest
The State of the World’s Biodiversity for Food dwellers, fishers and fish farmers have shaped
and Agriculture 55. Five years in the making, and managed biodiversity, identifies major
the report was prepared under the guidance of drivers of trends in the status of biodiversity,
FAO’s Commission on Genetic Resources for and discusses trends in the use of biodiversity-
Food and Agriculture. It details the many benefits friendly production practices.
RESILIENCE
Wild
Figure 14: Key direct and
indirect contributions of
biodiversity to food security
Information for this figure was
drawn from a number of
sources: 55-68.
Over 1160 wild plant species used as food by humans 68
At least 2111 insect 58, 1600 bird, 1110 mammal, 140 reptile and
230 amphibian 68 species eaten by humans
Over 1800 species of fish, crustaceans, molluscs, echinoderms, coelenterates
and aquatic plants harvested by global capture fisheries 63
10 species/species groups account for 28% of production 62
1154 species and genera of edible wild mushrooms 56
ITIONS FOR FOOD PRODUCTION
Ecosystems such as seagrass meadows, coral reefs, mangroves, other wetlands,
forests and rangelands that provide habitats and other ecosystem services to
numerous species important to food security
SUMMARY 35IMAGINING A ROADMAP FOR PEOPLE
AND NATURE
Pioneering modelling has provided the ‘proof of concept’ that
we can halt, and reverse, terrestrial biodiversity loss from
land-use change. With an unprecedented and immediate
focus on both conservation and a transformation of our
modern food system, the Bending the Curve Initiative gives
us a roadmap to restore biodiversity and feed a growing
human population.
Modelling isn’t magic. It is used around the world every day, to plan
traffic, forecast population growth areas to understand where to build
schools – and, in conservation, to understand, for example, how our
climate will continue to change into the future. Now, the remarkable
rise in computing power and artificial intelligence allows us, with
ever-increasing sophistication, to look at a range of complex possible
futures asking not ‘what?’, but ‘what if?’
The Bending the Curve Initiative 69 used multiple state-of-the-
art models and scenarios to investigate whether we can reverse
terrestrial biodiversity declines – and if so, how. Building on
pioneering work that modelled pathways to achieve sustainability
objectives 70 and recent efforts by the scientific community for
the Intergovernmental Panel on Climate Change (IPCC) and the
Intergovernmental Science-Policy Platform on Biodiversity and
Ecosystem Services 71-73, seven different future what-if scenarios
were developed.
The reference what-if scenario is based on the IPCC’s ‘middle-of-
the-road’ scenario (SSP2 in Fricko et al. (2017) 74), and assumes a
business-as-usual future, with limited efforts towards conservation
and sustainable production and consumption. In this model,
human population peaks at 9.4 billion by 2070, economic growth is
moderate and uneven, and globalisation continues. In addition to the
reference scenario, six additional what-if scenarios were developed to
explore the potential effects of different actions.
WWF LIVING PLANET REPORT 2020 36Just as with modelling for climate change, or indeed COVID-19,
interventions to determine possible future pathways were broken
into action ‘wedges’. These include measures around increased
conservation as well as reducing the impact of our global food
system on terrestrial biodiversity, in terms of both production and
consumption.
Scenario’s aimed at bending the curve
Three of the scenarios picture single types of interventions aimed at
bending the curve:
1. The increased conservation efforts (C) scenario included
an increase in the extent and management of protected areas, and
increased restoration and landscape-level conservation planning.
2. The more sustainable production (supply-side efforts or
SS) scenario included higher and more sustainable increases in
both agricultural productivity and trade of agricultural goods.
3. The more sustainable consumption (demand-side efforts
or DS) scenario reduced waste of agricultural goods from field
to fork and included a diet shift to a lower share of animal calories
in high meat-consuming countries.
The three other scenarios modelled different combinations of these
increased efforts:
4. The fourth looked at conservation and sustainable
production (C+SS scenario).
5. The fifth combined conservation and sustainable
consumption (C+DS).
6. T
he sixth scenario investigated interventions in all three sectors at
once. This was known as the ‘integrated action portfolio’ of
interventions, or IAP scenario.
SUMMARY 37Bending the curve
0.05
●
●●●
Difference to 2010 indicator value
0.00
●●
−0.05
●
2000 2010 2050 2100
The projected change
in biodiversity under
each land-use change
Scenario (mean & range across land use change models) model in 2100
Key
Historical Inc. conservation efforts (C)
Baseline (BASE) Inc. conservation & supply-side efforts (C+SS)
Supply-side efforts (SS) Inc. conservation & demand-side efforts (C+DS)
Demand-side efforts (DS) Integrated action portolio (IAP)
2100 values for individual land-use change
AIM GLOBIOM IMAGE MAgPIE
Figure 15: Projected contributions of various efforts to reverse
biodiversity trends from land-use change.
This illustration uses one biodiversity indicator to show how future actions to
reverse biodiversity trends have varying results across the seven scenarios
indicated by different colours. The line and shaded area for each scenario
represent the average and range of the projected relative changes across four
land-use models (compared to 2010). This graph shows the projected response
of one of the biodiversity indicators – mean species abundance, or MSA – using
one of the biodiversity models (GLOBIO – more details about all the biodiversity
indicators and models can be found in the technical supplement). Sourced from
Leclère et al. (2020) 69
WWF LIVING PLANET REPORT 2020 38The thick coloured lines on the graph show how biodiversity is
projected to respond under each scenario. As four land-use models
were used, this shows the average value across all of them.
The grey line shows that in the reference baseline ‘business-as-usual’
scenario, global biodiversity trends continue declining throughout
the 21st century, with a speed similar to recent decades until 2050.
Single interventions:
• The red line shows the effect of putting in place sustainable
production measures alone.
• The blue line shows the effect of putting in place sustainable
consumption interventions alone.
• The green line shows the effect of putting in place more ambitious
conservation measures alone.
Integrated interventions combine these three in different
ways:
• The purple line shows how biodiversity is projected to respond
if increased conservation measures are combined with more
sustainable production efforts.
• The light blue line shows how biodiversity is projected to respond
if increased conservation measures are combined with more
sustainable consumption efforts.
• The yellow line shows how biodiversity responds under the
‘integrated action portfolio’ that combines all three single
interventions: increased conservation measures and more
sustainable production and consumption efforts.
Conservation is critical but not enough – we must also
transform food production and consumption patterns
This research shows that bolder conservation efforts are key to
bending the curve: more than any other single type of action,
increased conservation was found to limit further biodiversity losses
in the future and to set global biodiversity trends on a recovery
trajectory. Only an integrated approach, combining ambitious
conservation with measures targeting the drivers of habitat
conversion – such as sustainable production or consumption
interventions, or preferably both – will succeed in bending the curve
of biodiversity loss.
SUMMARY 39THE PATH AHEAD
The Living Planet Report 2020 is being published at a time
of global upheaval, yet its key message is something that has
not changed in decades: nature – our life-support system –
is declining at a staggering rate. We know that the health of
people and that of our planet are increasingly intertwined;
the devastating forest fires of the past year and the ongoing
COVID-19 pandemic have made this undeniable.
The Bending the Curve modelling tells us that, with
transformational change, we can turn the tide of biodiversity
loss. It is easy to talk about transformational change, but how
will we, living in our complex, highly connected modern society,
make it a reality? We know that it will take a global, collective
effort; that increased conservation efforts are key, along with
changes in how we produce and consume our food and energy.
Citizens, governments and business leaders around the globe
will need to be part of a movement for change with a scale,
urgency and ambition never seen before.
We want you to be part of this movement. For ideas and
inspiration, we invite you to explore our Voices for a Living
Planet supplement. We have invited thinkers and practitioners
from a range of fields in many countries to share their views on
how to bring about a healthy planet for people and nature.
Voices for a Living Planet complements the themes of the
Living Planet Report 2020 by reflecting a diversity of voices
and opinions from all over the globe. Covering ideas ranging
from human rights and moral philosophy to sustainable finance
and business innovation, it provides a starting point for hopeful
conversations, food for thought and ideas for a future in which
people and nature can thrive.
We hope it will inspire you to be part of the change.
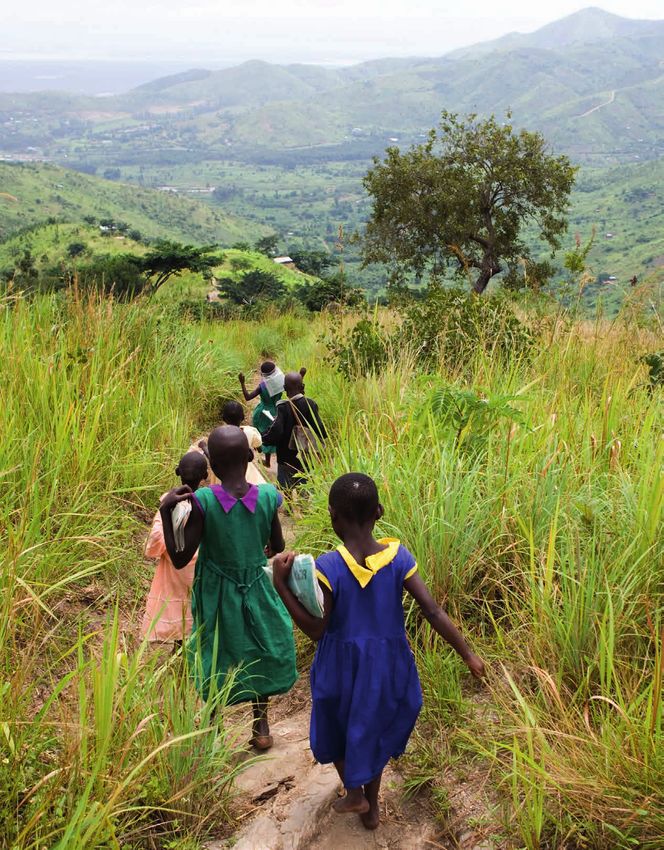
Children walking in the Forest Landscape Restoration HQ and nursery in
Rukoki Sub-County, Kasese District, Rwenzori Mountains, Uganda.
WWF LIVING PLANET REPORT 2020 40You can also read