Lockdowns and their influence on Earth's hum - Nature
←
→
Page content transcription
If your browser does not render page correctly, please read the page content below
www.nature.com/scientificreports
OPEN Lockdowns and their influence
on Earth’s hum
Surendra Nadh Somala
Earth’s hum at higher frequencies is disturbed substantially by human activity. Anthropogenic noise
is more evident in frequencies higher than 1 Hz. The power at 10 Hz power is used from January 2020
to early May (mostly first wave of SARS-CoV-2) across various sites across the world, to show that
there is a clear decrease in noise power during the lockdown period. Furthermore, this anthropogenic
noise across the world during the COVID-19 lockdown period, within which vehicular movement and
industrial activity have stalled in many places, is quantified into a few bins. Implications of easing the
lockdown measures on the onset of second wave of pandemic are discussed.
The COVID-19 crisis is coming in multiple waves and is impacting different countries with varying timeline.
Some of the countries are into the third while a few others are inching into the fourth wave of the pandemic. The
authorities of most of the countries have imposed lockdowns to stop the spread of virus. These lockdowns were
mostly imposed nationwide during the first wave but were largely restricted to small regions during the second
and further waves of SARS-CoV-2. Lockdowns have indirectly contributed to restoring the Earth’s hum at almost
all the frequency bands and shed light on the lowest plausible seismic noise at each place when anthropogenic
activity is at its minimum.
Anthropogenic noise recorded by ground-based vibration is dominant in higher frequencies1,2. The main
contributing factor of this anthropogenic noise is traffic, including noise from the trains3. Another important
source is the machinery operated in the energy s ector4. Diurnal and seasonal patterns of human-induced vibra-
tions have been studied in the l iterature5. The novelty of this study is to quantify how lockdowns have influenced
the noise power in the anthropogenic frequency band across the entire world using publicly available ground
vibration data and to see if there is any correlation between number of daily new cases reported by the World
Health Organization (WHO) and increase in anthropogenic noise beyond the first wave of SARS-CoV-2.
Data and resources
All the seismic stations from the Federation of Digital Seismograph Network (FDSN) are used to examine the
ambient noise power at 10 Hz, downloadable from Incorporated Research Institutions for Seismology (IRIS).
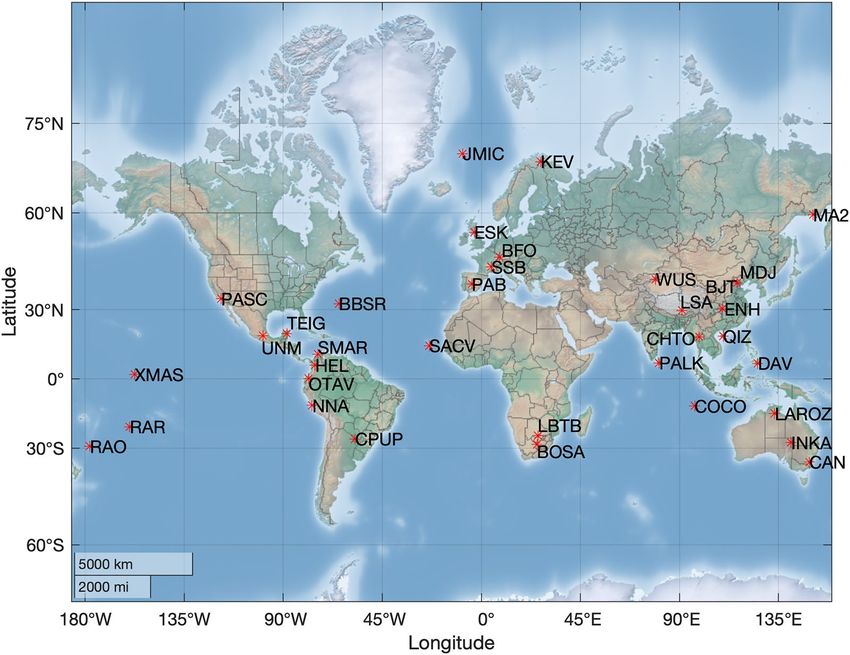
Out of all those station seismic stations in FDSN, the locations where there is a clear decrease in noise power
are shown in Fig. 1. The red stars in Fig. 1 are spread all over the world map indicating the extent of impact the
COVID-19 crisis had on the planet Earth. Large regions without stations in Fig. 1 does not necessarily imply
a lack of reduction in noise power but there is a possibility of data not being freely available. Nevertheless, the
available locations cover almost all the continents along with a few stations in the islands.
Methodology
The power of the ground acceleration signal is computed relative to 1 m2/s4/Hz6 and is expressed in terms of
Decibels (dB) as shown in Eq. (1).
2
P[dB] = 10log10 P/1 m/s2 /Hz (1)
The power can be evaluated any frequency of interest. In this work, to understand the variations within the
anthropogenic band, power at 10 Hz is considered throughout this study. The power at 10 Hz is computed for
each and every day throughout the several months considered in this study. The initial part is focussed on early
part of 2020 during the first wave of COVID-19 to quantify the reduction in anthropogenic noise. The latter
part of the covers almost one and half year from Jan 2020 to July 2021 to understand the correlation with daily
new cases reported by WHO.
Indian Institute of Technology Hyderabad, Hyderabad, India. email: surendra@iith.ac.in
Scientific Reports | (2021) 11:17838 | https://doi.org/10.1038/s41598-021-97459-1 1
Vol.:(0123456789)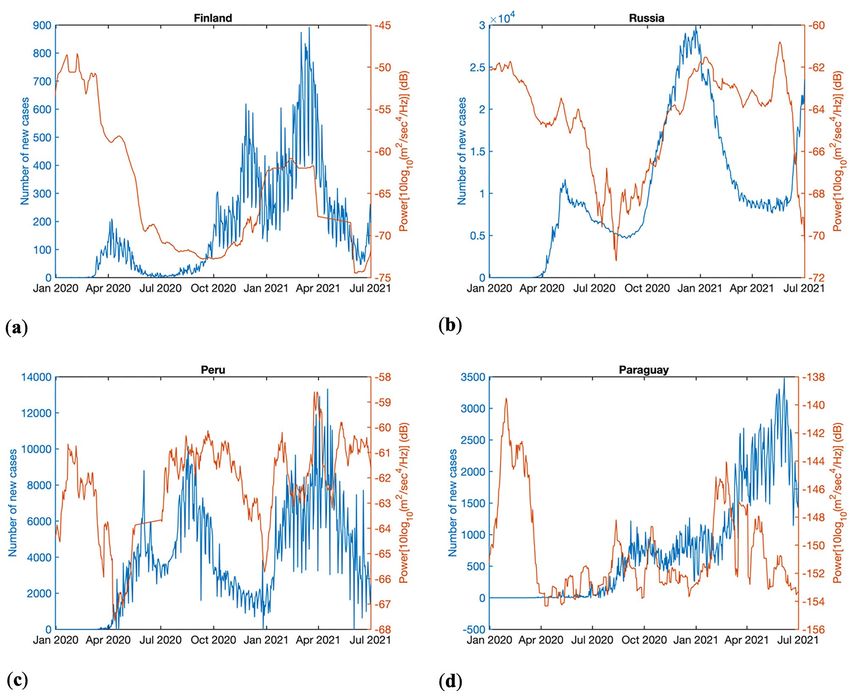
www.nature.com/scientificreports/
Figure 1. Locations across the world where anthropogenic noise reduction is observed during January to early
May 2020. Matlab version 2020a was used to make this map (https://matlab.mathworks.com/).
Results and discussion
The moving-mean over 15 days of noise power relative to 1 m2/s4/Hz6 is shown in Fig. 2 at the locations indicated
by red stars in Fig. 1. It can be observed that for stations with network code IC the lower levels of noise power has
started in the month of January itself. These are stations located in China where the COVID-19 crisis was realised
in December 2019 and lockdown measures have started by January 2020. At these stations, anthropogenic noise
started picking up by mid to late March 2020 possibly implying lifting of lockdown measures. The WUS station
of Geoscope (G) network, which shows lower noise during January and February, is also located in China. The
majority of other locations have shown a greater reduction in noise during March to April time-frame.
The highest contribution to anthropogenic noise is observed in Nana of Peru (NNA), and Innamincka of
Australia (INKA) to be about 18 dB, followed by Bermuda (BBSR), and Santiago Island of Cape Verde (SACV)
showing close to 15 dB reduction. This reduction is in comparison to the overall average of minimum and maxi-
mum power recorded for the months considered in this study.
Among the locations that showed 11–15 dB anthropogenic noise levels are Chiang Mai of Thailand (CHTO),
Enshi in Hubei of China (ENH), Qiongzhong in Hainan of China (QIZ), Larrimah in Northern Territory of
Australia (LAROZ), and Lhasa of Tibet (LSA). There are also a good number of locations showing a reduction
in anthropogenic noise close to 10 dB like the Pasadena Arts College (PASC), Villa Florida of Paraguay (CPUP),
Cocos (Keeling) Islands (COCO), and Wushi in Xinjiang Uygur of China (WUS).
Finally, locations with considerable (> 5 dB) but less than 10 dB anthropogenic noise are Kiritimati Island
(XMAS), Rarotonga of Cook Islands (RAR), Tepich in Yucatan of Mexico (TEIG), Kevo of Finland, Otavalo of
Ecuador (OTAV), Santa Helena in Medellin of Colombia (HEL), Pallekele of Sri Lanka (PALK), Davao of Phil-
ippines (DAV), Eskdalemuir of Scotland (ESK), Raoul of Kermadec Islands (RAO), and Canberra of Australia
(CAN).
Rest of the locations that are shown in Fig. 1 but have not been mentioned thus far have shown < 5 dB
reduction in noise from anthropogenic sources. A few such locations that are worth mentioning are Lobatse in
Botswana of Africa (LBTB), Mudanjiang in Heilongjiang Province of China (MDJ), Black Forest Observatory
in Schiltach of Germany (BFO), San Pablo of Spain (PAB), Saint Sauveur en Rue of France (SSB), Magadan of
Russia (MA2), Beijing of China (BJT), and Boshof of South Africa (BOSA).
Figure 3 shows the number of daily new cases reported by WHO together with the anthropogenic noise
power for four different countries—namely, Finland, Russia, Peru and Paraguay. Each of these countries broadly
correspond to one each from each of the bins of noise reduction identified during the lockdowns. It can be seen
from Fig. 3 that after the initial reduction in anthropogenic ground noise due to lockdowns, the increase beyond a
local minimum could be attributed to the easing of lockdown measures. Such an increase is seen to occur within
Scientific Reports | (2021) 11:17838 | https://doi.org/10.1038/s41598-021-97459-1 2
Vol:.(1234567890)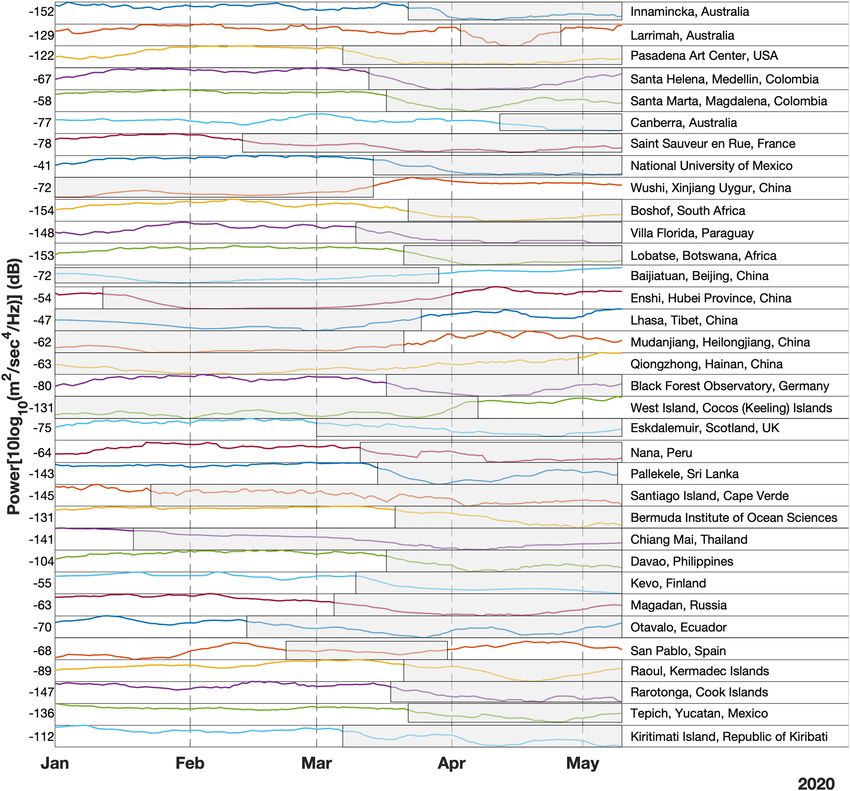
www.nature.com/scientificreports/

                                  Figure 2.  Seismic noise power in dB, highlighting time-period during which anthropogenic noise is lower. The
                                  text to the right of each curve represents the network and station codes. The grey shading represents mostly the
                                  lockdown periods pertinent to those sites. The value to the left of each curve is the mean of upper and lower
                                  limits of noise during the time period considered (January to early May 2020).

                                  the year 2020 itself, when vaccines were still not readily available to public. The secondary peak of number of
                                  cases does appear to align well with the easing of lockdowns. Anthropogenic noise monitoring can thus provide
                                  precursory indicators for secondary and further waves of pandemics.

                                  Conclusion
                                  The reduction in anthropogenic noise during the first few months of 2020 is attributed to the lockdown measures
                                  that were implemented in various countries due to the prevalent COVID-19 crisis. Under this assumption, the
                                  noise power at 10 Hz is evaluated at locations where seismic data access is available through IRIS and classified
                                  them into categories of high (> 10 dB), medium (5–10 dB) and low (< 5 dB) cultural noise sites. While this clas-
                                  sification also has to do with how strictly lockdown measures are implemented in that particular location, this
                                  unprecedented crisis is almost like a once in a lifetime extreme event that it is worth documenting the reduction
                                  in ambient noise powers.
                                      The present study finds that the anthropogenic noise is as high as 18 dB. This is not necessarily an upper
                                  bound as not all the FDSN stations are accessible. Islands fall mostly in the medium to the high category of
                                  anthropogenic noise. Finally, easing of lockdown restrictions after the first wave of SARS-CoV-2 has shown clear
                                  increase in anthropogenic noise, which appear to correlate well with the secondary peak of daily cases related to

Scientific Reports |   (2021) 11:17838 |              https://doi.org/10.1038/s41598-021-97459-1                                                 3

                                                                                                                                            Vol.:(0123456789)
www.nature.com/scientificreports/
Figure 3. Correlation between second wave of peak in new cases and increasing in seismic noise (easing of
lockdowns) for (a) Finland (b) Russia (c) Peru (d) Paraguay.
the second wave. Limitations of this study include restricting it to just one of the frequencies. Moreover, a single
station being representative of a nation is an extrapolation made to overcome the limited available of ground
vibration data. Extensive seismic monitoring has potential to serve as “early warning” for secondary waves of
pandemics. Hence, a more organized seismological monitoring with advanced technologies, within the purview
of the United Nations, can help achieve one of its sustainable developments goals of overseen by the United
Nations Office for Disaster Risk Reduction.
Data availability
All data is freely available to anyone through Incorporated Research Institutions for Seismology (https://www.
iris.edu/hq/). WHO data on daily cases is also publicly accessible on https://covid19.who.int/info/ (last accessed:
6th August, 2021).
Received: 28 March 2021; Accepted: 18 August 2021
References
1. Boese, C. M., Wotherspoon, L., Alvarez, M. & Malin, P. Analysis of anthropogenic and natural noise from multilevel borehole
seismometers in an urban environment, Auckland, New Zealand. Bull. Seismol. Soc. Am. 105, 285–299 (2015).
2. Sheen, D.-H., Shin, J. S., Kang, T.-S. & Baag, C.-E. Low frequency cultural noise. Geophys. Res. Lett. 36, 17 (2009).
3. Riahi, N. & Gerstoft, P. The seismic traffic footprint: Tracking trains, aircraft, and cars seismically. Geophys. Res. Lett. 42, 2674–2681
(2015).
4. Bayne, E. M., Habib, L. & Boutin, S. Impacts of chronic anthropogenic noise from energy-sector activity on abundance of songbirds
in the boreal forest. Conserv. Biol. 22, 1186–1193 (2008).
5. Powell, C. A. Seismic noise in northcentral North Carolina. Bull. Seismol. Soc. Am. 82, 1889–1909 (1992).
Scientific Reports | (2021) 11:17838 | https://doi.org/10.1038/s41598-021-97459-1 4
Vol:.(1234567890)www.nature.com/scientificreports/
6. McNamara, D. E. & Buland, R. P. Ambient noise levels in the continental United States. Bull. Seismol. Soc. Am. 94, 1517–1527
(2004).
Author contributions
S.N.S is the only author responsible for the entire study.
Funding
Funding from the Department of Atomic Energy, India through IUCAA, Pune to IIT Hyderabad through the
project "Seismic Study" is greatly acknowledged. The Ministry of Earth Sciences (MoES), India is also thanked
for funding through sanction number MoES/P.O.(Seismo)/1(304)/2016.
Competing interests
The author declares no competing interests.
Additional information
Correspondence and requests for materials should be addressed to S.N.S.
Reprints and permissions information is available at www.nature.com/reprints.
Publisher’s note Springer Nature remains neutral with regard to jurisdictional claims in published maps and
institutional affiliations.
Open Access This article is licensed under a Creative Commons Attribution 4.0 International
License, which permits use, sharing, adaptation, distribution and reproduction in any medium or
format, as long as you give appropriate credit to the original author(s) and the source, provide a link to the
Creative Commons licence, and indicate if changes were made. The images or other third party material in this
article are included in the article’s Creative Commons licence, unless indicated otherwise in a credit line to the
material. If material is not included in the article’s Creative Commons licence and your intended use is not
permitted by statutory regulation or exceeds the permitted use, you will need to obtain permission directly from
the copyright holder. To view a copy of this licence, visit http://creativecommons.org/licenses/by/4.0/.
© The Author(s) 2021
Scientific Reports | (2021) 11:17838 | https://doi.org/10.1038/s41598-021-97459-1 5
Vol.:(0123456789)You can also read