Logistics Performance Index 2018 - TILOG LogistiX
←
→
Page content transcription
If your browser does not render page correctly, please read the page content below
Logistics Performance Index 2018
Contents
 ▪   About Logistics Performance Index (LPI)

 ▪   LPI 2018: Key Findings

 ▪   Thailand LPI

 ▪   Unbundling Logistics Performance

 ▪   Logistics Trends

                                               2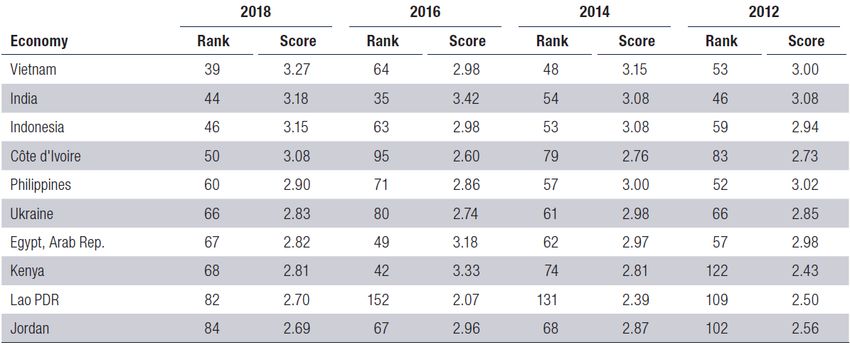
About LPI
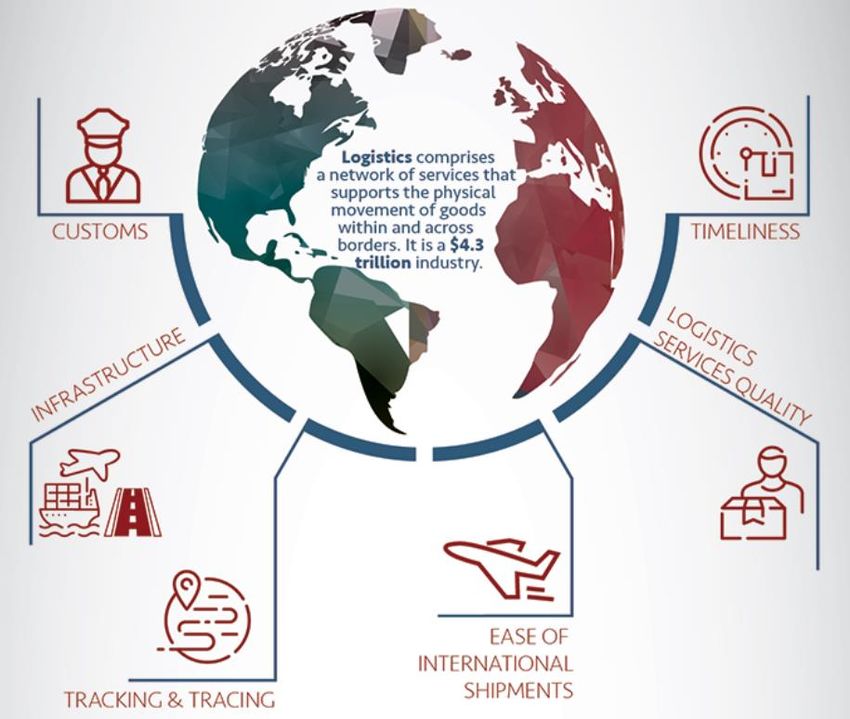
• LPI 2018 ranks countries on six dimensions of trade :-
1. Customs: efficiency of customs and border management clearance
2. Infrastructure: quality of trade and transport infrastructure
3. Ease of arranging shipments: ease of arranging competitively priced shipments
4. Quality of logistics services: competence and quality of logistics services - trucking,
forwarding, and customs brokerage
5. Tracking and tracing: ability to track and trace consignments
6. Timeliness: frequency with which shipments reach consignees within scheduled or expected
delivery times
• Data used in the ranking comes from a survey of logistics professionals who are asked questions
about the foreign countries in which they operate
3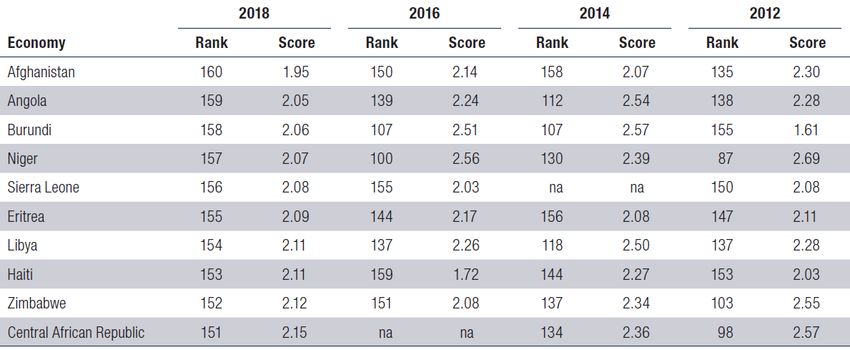
About LPI
 The six LPI indicators can be mapped
 onto two main categories :-

 1. Areas for policy regulation, indicating
    main inputs to the supply chain
    (customs, infrastructure, and
    services)

 2. Supply chain performance outcomes
    (corresponding to LPI indicators of
    time, cost, and reliability - timeliness,
    international shipments, and
    tracking and tracing)

                                                4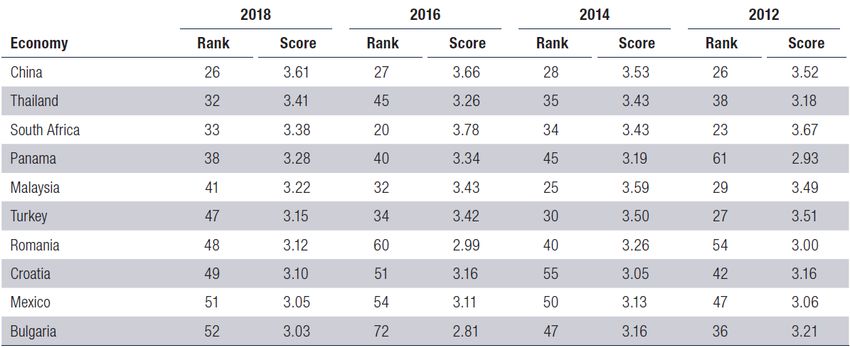
Contents
 ▪   About Logistics Performance Index (LPI)

 ▪   LPI 2018: Key Findings

 ▪   Thailand LPI

 ▪   Unbundling Logistics Performance

 ▪   Logistics Trends

                                               5
LPI 2018: Key Findings
 • Top 10 performing countries have remained relatively unchanged over the past few years and
   tend to include high-income countries in Europe
 • Not surprising, since these countries traditionally have been dominant in the supply chain
   industry

               Top 10 LPI economies, 2018

                                                                                                6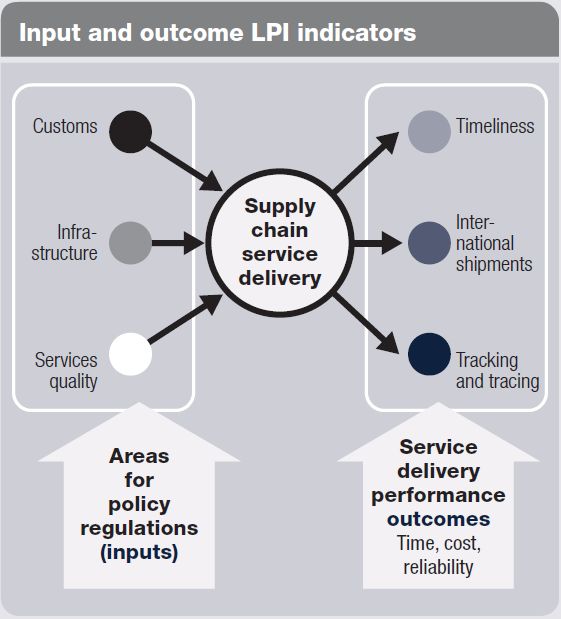
LPI 2018: Key Findings
 • Bottom 10 countries in the ranking are composed of mostly low-income and lower-middle-
   income countries
 • These are either fragile economies affected by armed conflict, natural disasters, political unrest,
   or landlocked countries that are naturally challenged by geography or economies of scale in
   connecting to global supply chains

                 Bottom 10 LPI economies, 2018

                                                                                                         7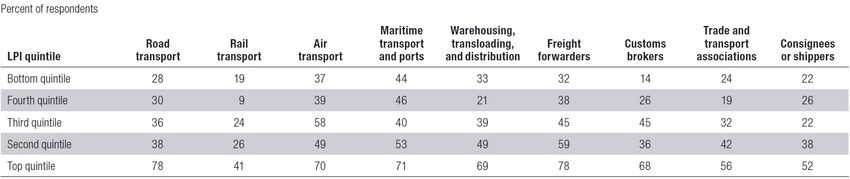
LPI 2018: Key Findings
 • The overall group composition among the top-performing upper-middle-income economies has
   changed marginally, with China, Thailand, and South Africa leading the group, and Croatia and
   Bulgaria improving in their LPI ranking

               Top-performing upper-middle-income economies, 2018

                                                                                                   8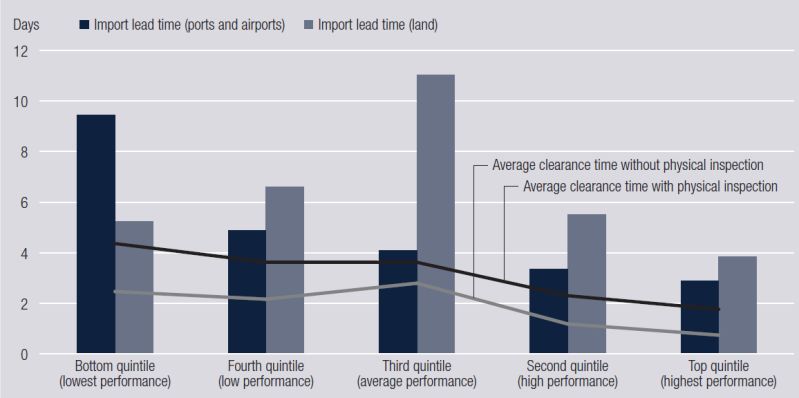
LPI 2018: Key Findings
 • Among the lower-middle-income group countries, large economies such as India and Indonesia
   and emerging economies such as Vietnam and Cote d’Ivoire stand out as top performers
 • Most of these countries either have access to the sea or are located close to major
   transportation hubs.

               Top-performing lower-middle-income economies, 2018

                                                                                                9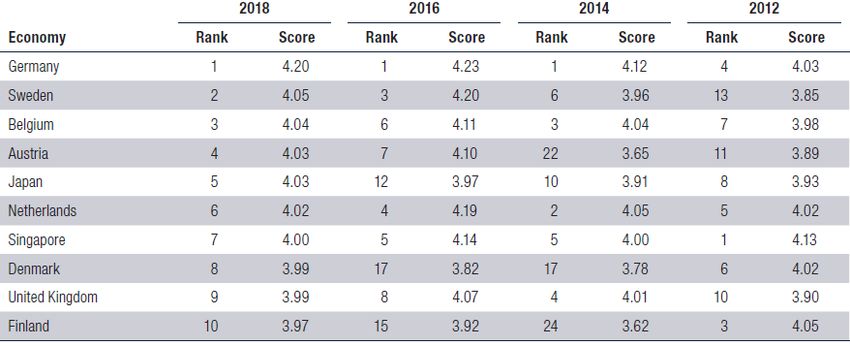
LPI 2018: Key Findings
“Logistics performance is strongly correlated with the quality of service”
 • Timeliness component seems to outperform the other LPI components and is generally viewed as
   the least problematic
 • On the other hand, the performance of customs and border agencies, as well as the quality of
   trade and transport infrastructure, are particularly low in the worst-performing countries

                     LPI components score, by LPI quintile, 2018

                                                                                                  10
LPI 2018: Key Findings
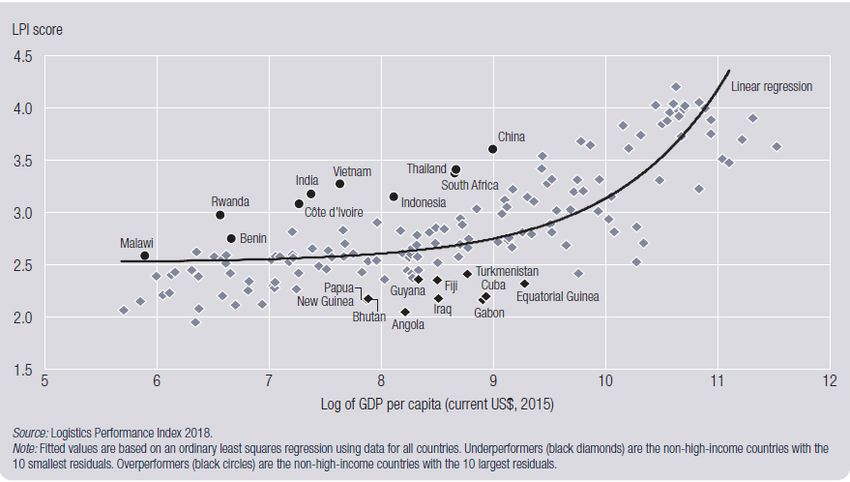
“Logistics performance is more than income”
LPI overperformers and underperformers
11Contents
▪ About Logistics Performance Index (LPI)
▪ LPI 2018: Key Findings
▪ Thailand LPI
▪ Unbundling Logistics Performance
▪ Logistics Trends
12Thailand – International LPI Ranking and Scores
LPI components score, by economy, 2018
Upper-middle-income economies
International Logistics Tracking &
LPI LPI Customs Infrastructure Timeliness
Economy shipments competence tracing
Rank Score
Rank Score Rank Score Rank Score Rank Score Rank Score Rank Score
China 26 3.61 31 3.29 20 3.75 18 3.54 27 3.59 27 3.65 27 3.84
Thailand 32 3.41 36 3.14 41 3.14 25 3.46 32 3.41 33 3.47 28 3.81
Malaysia 41 3.22 43 2.9 40 3.15 32 3.35 36 3.3 47 3.15 53 3.46
Lower-middle-income economies
Vietnam 39 3.27 41 2.95 47 3.01 49 3.16 33 3.4 34 3.45 40 3.67
India 44 3.18 40 2.96 52 2.91 44 3.21 42 3.13 38 3.32 52 3.5
Indonesia 46 3.15 62 2.67 54 2.89 42 3.23 44 3.1 39 3.3 41 3.67
Philippines 60 2.9 85 2.53 67 2.73 37 3.29 69 2.78 57 3.06 100 2.98
Lao PDR 82 2.7 74 2.61 91 2.44 85 2.72 83 2.65 69 2.91 117 2.84
13Contents
▪ About Logistics Performance Index (LPI)
▪ LPI 2018: Key Findings
▪ Thailand LPI
▪ Unbundling Logistics Performance
▪ Logistics Trends
14Unbundling Logistics Performance
Infrastructure: A shared concern across performance groups
• The quality of information and communications technology (ICT) is consistently rated higher than
physical transportation infrastructure
• The difference between the top and bottom is smallest in ICT, suggesting that developing countries
may have been investing heavily in modern technologies
• Though still a constraint in developing countries, infrastructure seems to be improving. The
perception of improvement is higher in the bottom quintile than in the top one
• Disaggregated by World Bank region, Respondents rating the quality of each infrastructure type “high” or “very high,” by LPI quintile
satisfaction with road and rail
infrastructure is especially low in
Latin America and the Caribbean, and
also in South Asia
• Satisfaction with rail infrastructure is
low in all regions, as was the case for
all LPI quintiles
15Unbundling Logistics Performance
Developing logistics services markets
• Respondents in all LPI quintiles are nearly always more satisfied with service providers than with
infrastructure quality
• Freight forwarders are rated highly, typically at or close to the strongest scores among service providers
• A ratings gap between services and infrastructure appears generally across World Bank regions
• These data suggest a need to develop transport-related infrastructure, so that service markets reforms
can bring maximum benefits to users
• Even in challenging environments, governments and the private sector can move toward higher
performance in a fairly short time
Respondents rating the quality and competence of each service provider type “high” or “very high,” by LPI quintile
16Unbundling Logistics Performance
Streamlining border procedures and facilitating trade
The bottom three quintiles clearance times are three times as much and paperwork twice as much as for the top two performance tiers
• Import and Export Time Median import time and average clearance time,
by LPI quintile
• The time to clear goods through customs rises
sharply if goods are physically inspected,
even in high-performing countries
• Countries with low logistics performance need to
cut red tape, physical inspections, and excessive
and opaque procedural requirements
• Red Tape Red tape affecting import and export transactions,
by LPI quintile
• Countries in the top quintile typically require two
supporting documents for trade transactions, and
those in the bottom, four to five
• Simplifying documentation for imports and exports
has long been high on the trade facilitation agenda
17Unbundling Logistics Performance
Supply chain reliability: A key concern for all countries
• The contrast is striking between the top and bottom LPI quintiles, especially in three areas: informal (corrupt)
payments, compulsory warehousing, and preshipment inspection
• Indeed, highly uncertain lead times can disrupt production and exporting, forcing firms to adopt costly
strategies such as express shipping or sharply higher inventories, eroding competitiveness within global and
regional value chains that use just-in-time production
• Causes of unexpected delays - including unpredictability in clearance, inland transit delays, and low service
reliability - should be an important part of logistics reform in low-performing countries
• The most important quality criterion in freight forwarding is delivery within the promised time window.
Almost as important is the absence of errors in cargo composition or documentation.
Respondents reporting that shipments are “often” or “nearly always” delayed, by delay category and
LPI quintile
18Contents
▪ About Logistics Performance Index (LPI)
▪ LPI 2018: Key Findings
▪ Thailand LPI
▪ Unbundling Logistics Performance
▪ Logistics Trends
19Logistics Trends – The importance of skill development for logistics
• Developed countries need more blue-collar workers, such as truck drivers while
developing countries seek more managerial-level workers
• Reasons for the shortages include the low prestige and status of operational logistics workers
• Logistics developments, particularly in information technology, demand new competencies that the workforce does
not possess
• Developing countries lag behind developed ones in training budgets, course content, and the quality of the
educational experience and training provider
• Public interventions promoting logistics competence include the following:
• Education and training by public institutions, or financial support to training
• Education policy and curricula development
• Advocacy, public–private dialogue, and multi-stakeholder collaboration
• Regulation of freight and logistics services, including customs brokerage and trucking
• Setting and harmonizing competency standards for different jobs
• Raising skill levels in state-owned logistics enterprises (typically ports and railways)
• Investing in human capital as a component of the development of logistics and freight infrastructure.
20Logistics Trends – Supply chain resilience
• Local events create disturbances much beyond the area directly affected when
supply chains are interrupted with no backup
• In 2011, the tsunami in Japan and the floods in Thailand disrupted trade by striking key nodes of global value chains
• In such severe events, supply chain links can take a long time to rebuild and may even be permanently altered
• More countries perceive cybersecurity threats a risk to logistics
• In mid-2017, cyberattacks on global Cybersecurity threats in logistics Our firm’s preparedness for
have… cyberthreats has…
providers created significant physical
supply chain disruption for weeks
• 78% of high-income countries have
increased their preparedness.
• Only 26% of low-income countries
have done so
21Logistics Trends – Asking for green logistics?
• Environmental sustainability of logistics is The demand for green logistics
an important emerging trend given that
23% of all energy-related CO2 emissions
can be attributed to transport
• Strong performers in logistics are the most likely to seek
eco-friendly shipping options
• In the top quintile of LPI performers, 28% of respondents
indicated that shippers often or nearly always ask for
environmentally friendly shipping options – in emission
levels and choices of routes, vehicles and schedules
• Higher costs and fewer choices for shipping are likely the
chief culprits for the discrepancy between higher and lower
performing countries, as are fears of adding transit time in
an already long and unpredictable supply chain.
22Thank You
http://lpi.worldbank.orgSupplementary Slides
2425
You can also read