Maine Workforce Outlook
     2012 to 2022
←
→
Page content transcription
If your browser does not render page correctly, please read the page content below
Maine Workforce Outlook
2012 to 2022
Introduction
The landscape of work has been transformed in the last several decades. First, the baby boom
generation that poured into the labor force from the 1960s until the 1980s is aging to retirement.
Next, international trade barriers have been significantly reduced, creating opportunity for some
companies, industries and communities while devastating others. In addition, technology has become
a pervasive part of our lives, both at work and home, providing the means to do old things better,
faster, and less expensively, and to do new things that, not long ago, few imagined could be done.
The deep 2008–2009 downturn accelerated the pace of change, causing massive job displacement
from certain sectors, especially manufacturing, construction, retail trade, and government. The
recovery brought job growth, but it has been concentrated in a few sectors, especially education,
healthcare, professional and business services, and leisure and hospitality. The education, knowledge,
and skill requirements for the jobs in growing sectors differ from what was required of workers
displaced from declining sectors.
We face major workforce development challenges in the years ahead from the restructuring of
employment; this restructuring is reallocating not only the types of jobs available, but also the
performance requirements of jobs. It is further complicated by our advancing age structure that is
slowing labor force growth. The future direction of our economy depends on how we manage these
challenges to fully and effectively staff companies to meet demand for their products and services. If
employers are not able to find enough staff, or staff with the appropriate education and skills, they
won’t be able to expand in Maine.

Demographic Challenge
Maine is the oldest state in the nation by median age. The leading edge of the large baby boom
generation has reached retirement age and all of that group will surpass age 65 in the next 15 years.
A great deal of high-value experience will be lost to employers with their exodus from the workforce.
Combined with a much smaller population of youths and young adults to replace them in the labor
force, the situation makes for a slow job growth outlook in the near term, and, if we do not foster an
environment that will entice higher rates of in-migration to stem this demographic tide, we will see
outright decline longer-term.

The Job Matching Challenge
Job trends over the last 30 years in two sectors illuminate the momentous changes occurring in
workplace performance requirements. From 1982 to 2012, the number of wage and salary jobs
increased 44 percent. Like the nation, growth was uneven across sectors. In 1982 the 109,000
manufacturing jobs made it the largest sector, accounting for more than one quarter of wage and
salary jobs. The 36,000 healthcare jobs comprised less than one tenth of jobs. Today the situation is
nearly reversed. We have fewer than half as many manufacturing jobs (50,000) and healthcare is now
the largest employing sector, with nearly three times as many jobs (101,000).
This is just one of many examples of the structural shifts that are reallocating knowledge and skill
requirements of workers. Technology and automation have become much less expensive and more

                                                                                                         1
capable of performing both routine and advanced functions. The skills required on an assembly line
performing repetitive tasks not only differ greatly from those required to diagnose and to treat
patients, but also differ from the techniques advanced manufacturers use—techniques that
increasingly involve math, problem solving, effective communication, decision making, and other
attributes not required in assembly-line production.
This is a two-headed problem. Many individuals need work or better work, but their years of
experience are no longer in demand; many employers need staff for specific functions but are
challenged to find the workers with the education, experience, or skills needed for critical operations.
Demand for workers in healthcare, information technology, and social and business services is rising.
The staffing needs of those industries primarily require, first, professional and technical functions
and, second, service functions. Jobs in professional and technical occupations generally require post-
secondary education or training (and often a specific credential) and offer higher-than-average
earnings; jobs in service occupations generally do not require post-secondary education or training
and offer lower-than-average earnings. Job growth is expected to continue to be concentrated at the
upper and lower ends of both the education and earnings spectrums and more limited in the middle.
The recent recession caused massive displacement in production, construction, administrative
support, and associated functions that have been the primary source of a middle-class lifestyle for
those without a college education. Some individuals who have been displaced have gained new skills
through education or job-training programs, but the supply of these workers has not declined as fast
as demand for their services has, causing wage stagnation for those who continue to work in these
fields. The result for many has been re-employment in lower-skill, lower-paying occupations for many
who must settle for whatever job they can find.
The long-term outlook by occupation is remarkably similar to the current demand situation.
Projections through 2022 indicate that 68 of the 100 fastest-growing occupations require some form
of post-secondary credential; 24 of the 40 fastest-growing occupations will be healthcare-related; and
business, financial operations, computer, mathematical, science, and legal occupations will grow
faster than average. On the other end of the spectrum, of the 40 occupations expected to lose the
most jobs, 13 are in production occupations and 12 are administrative support.
In addition to the trend toward jobs at the upper and lower ends of the education and earnings
spectrums, the flattening of organizations in all sectors puts a premium on self-organization, self-
management, and personal initiative by workers at all organizational levels. Jobs that once required
little more than a strong back or manual dexterity now require higher levels of reading
comprehension, communication, and decision making.
The nature of work in the twenty-first century increasingly demands higher levels of literacy and
more sophisticated technology competencies. We can generalize that primary performance
attributes of jobs in growing occupations are concentrated around critical thinking, problem
identification, mathematics, reading comprehension, active listening, oral communication,
instruction, and decision making. Those contrast with the primary work activities or knowledge
requirements of occupations that are expected to have the highest rates of job loss, which include
handling and moving objects, controlling machines, repairing and maintaining equipment, and clerical
functions.

                                                                                                       2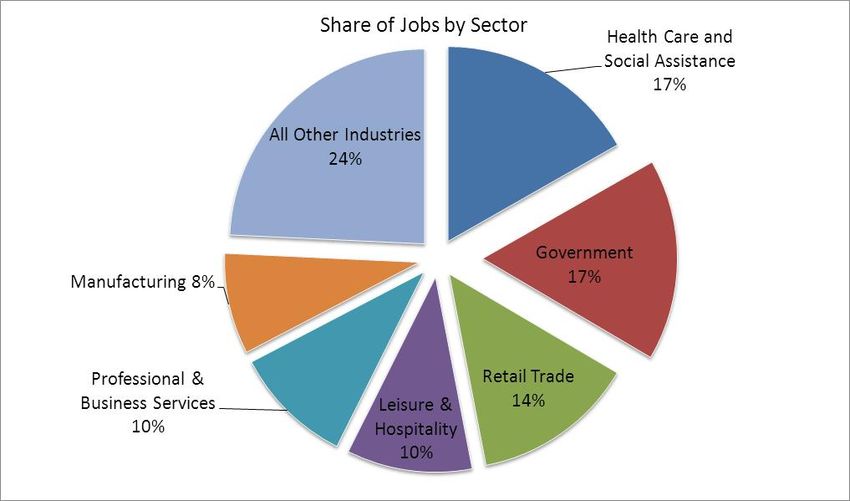
Workers can be better equipped if they understand the forces that will impact their future. Educators
and those charged with workforce development have the important responsibility of anticipating job
performance requirements and future needs. The charts and narrative in this publication broadly
highlight the demographic and workforce trends and challenges Maine faces through 2022. A more
detailed look at job projections for industries and occupations is available
at www.maine.gov/labor/cwri/outlook.html.

                                                                                                    3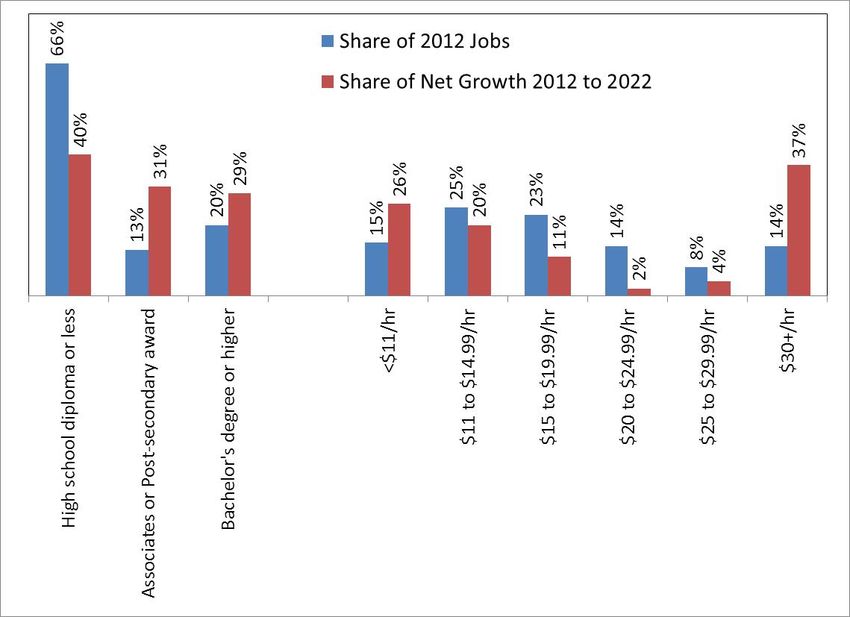
Section 1 – Labor Force Outlook

The economy is constantly changing. New products and services emerge and others fade; technology
and process improvements make us more productive. The labor force also constantly changes. The
rate of growth and composition of the population as well as the share of the population participating
in the labor force differs among demographic groups and changes over time. In addition, human-
capital resource needs of employers — the knowledge, skills, abilities, and other attributes of work
— also constantly change. These dynamics have been interplaying at an ever-increasing pace. The
relationships between all these factors produce the types of job openings occurring at a point in time.

                                                                                                     4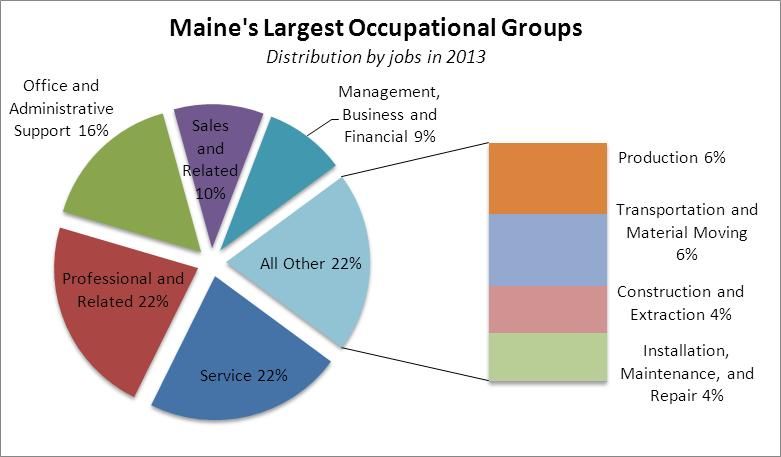
Labor Force Outlook – Components of Population Growth
           Our population is not growing because births are way down

After decades of consistent growth, the size of Maine’s population has been flat since 2008.
Population change is driven by two factors: natural change, which is the difference between the
number of births and deaths, and net migration, which is the difference between the number of
people moving into and out of the state.
For more than a century, Maine had positive natural change, which peaked during the 1946 to 1964
baby boom. Since then the number of births per year has trended lower and the number of deaths
per year has trended higher—to the point that we no longer have any natural increase in population.
Given the advanced age of much of our population, this trend is not likely to be reversed in the next
two decades.
Without positive natural change, Maine will depend on net in-migration to maintain our population
and workforce. The good news is that, since the 1960s, we have had more people moving into than
out of the state, with the exception of three periods, each of which coincided with a recession and
two coinciding with a military-base closure that took thousands out of the state.* In the recent
recovery, net-migration to and from Maine has remained near zero. That trend must be reversed to
maintain the size of our workforce.
*(Loring Air Force Base closed in the early 1990s. Brunswick Naval Air Station closed recently with
most personnel leaving Maine in 2008 and 2009).

                                                                                                      5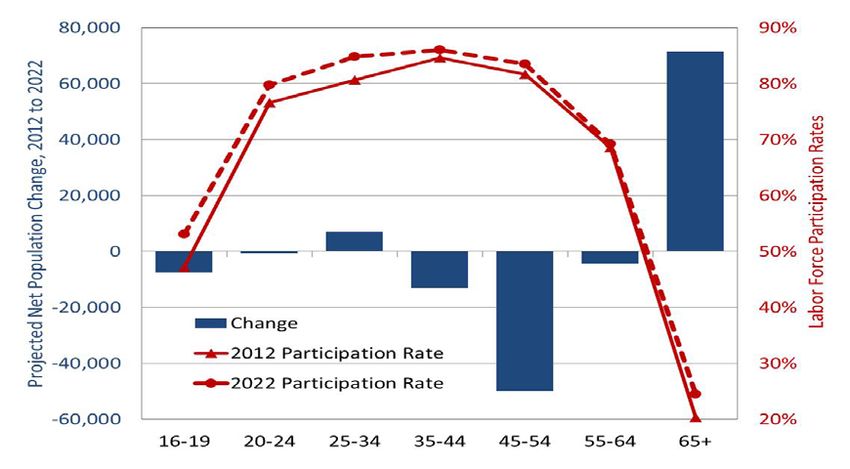
Labor Force Outlook – Aging Population
                    In 2022, nearly 1 in 4 Mainers will be age 65 or over

Though the total population of Maine has not changed significantly since 2008, the age composition
has advanced. Forecasts indicate the trend of a flat total population advancing in age will continue
over the next two decades. This will have major implications for the size of our workforce.
To illustrate this point, it is instructive to look at our current population composition. In 2012 the
number of residents age 45 to 64 numbered 411,000. Most of that group will be labor force “leavers,”
retiring in the next two decades. At the other end of the spectrum are the 302,000 residents under
age 20, most of whom will be labor force “entrants.” The 109,000 gap between potential labor force
leavers and entrants poses a significant challenge, particularly when our labor force totals just
700,000.
Lack of working-age population growth can significantly impact businesses’ abilities to attract the
staff they need to meet demand for their products and services. As the economy continues to recover
from the recent downturn, our ability to attract and retain young working people will be an
increasingly important issue.

                                                                                                       6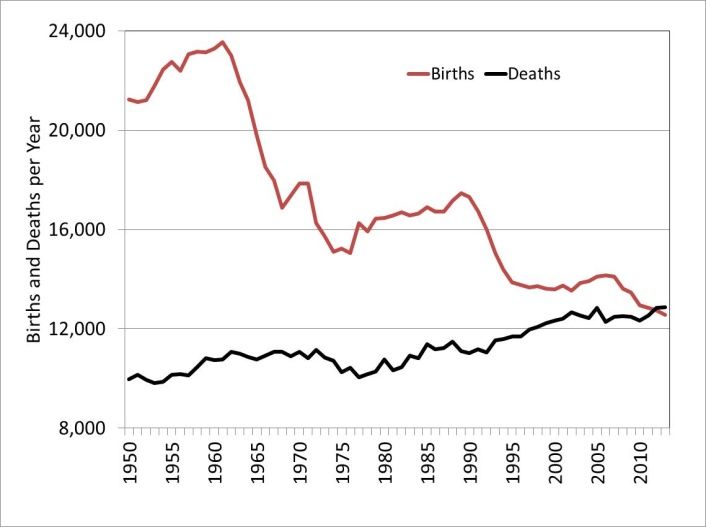
Labor Force Outlook – Impact of Aging
        The population in their peak years of labor force participation is declining

Labor force growth is driven by changes in the size and composition of the population— especially
among age groups—and changes in labor force participation. The labor force participation rate is the
share of the population age 16+ who are employed or unemployed (jobless people are counted as
unemployed only if they are actively seeking work). Participation rates differ significantly among
demographic groups, with higher rates among men than women, often due to family considerations,
and higher rates among those 25 to 54 years of age than younger or older people.
Participation rates for demographic groups can change over time. The share of women in the labor
force doubled between 1950 and 2000 while the participation of men remained relatively unchanged.
Since 2000 labor force participation has trended lower for both men and women. This is due to a
higher share of population in their fifties and sixties, beyond their peak years of labor force
attachment.
The outlook to 2022 is for rising labor force participation among all age groups, especially those
under 35 and over 65. For younger people this reflects greater opportunity as the economy
strengthens and large numbers of seniors retire. For seniors this reflects financial need, changes in
eligibility for retirement benefits, changing norms about work and retirement, and a higher share of
jobs that are not physically demanding, but it primarily reflects the rising share of “young seniors” in
their upper sixties and early seventies. “Young seniors” have always been more likely to work than
those in their upper seventies and beyond. This rise in participation of those ages 65 and older is
expected to last for about the next ten to 15 years, and then turn lower as most baby boomers age
into their seventies and eighties. Despite rising participation among all age groups, the overall labor
force participation rate is expected to continue to trend lower as more people move beyond prime
working age.

                                                                                                           7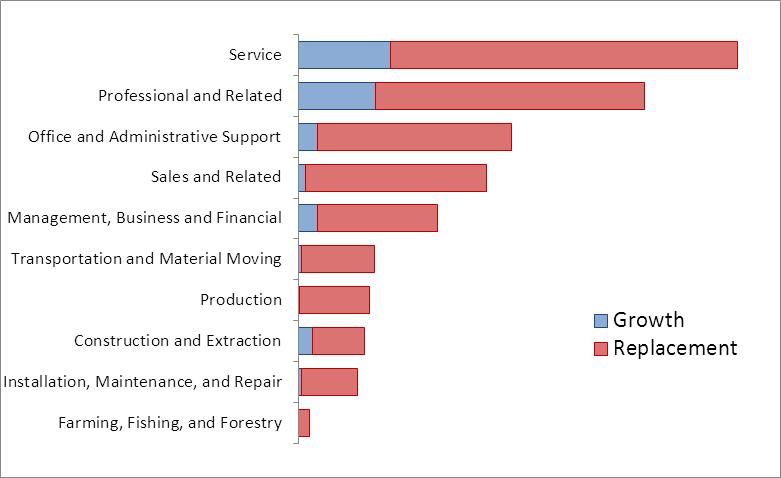
Labor Force Outlook – Growth Outlook Slowing
     The size of the labor force is not expected to change significantly through 2022

The net effect of these population and participation trends is significant slowing in labor force growth
from more than 20 percent per decade in the 1970s and 1980s, to single digits the last two decades,
to a small decline expected from 2012 to 2022.

                                                                                                       8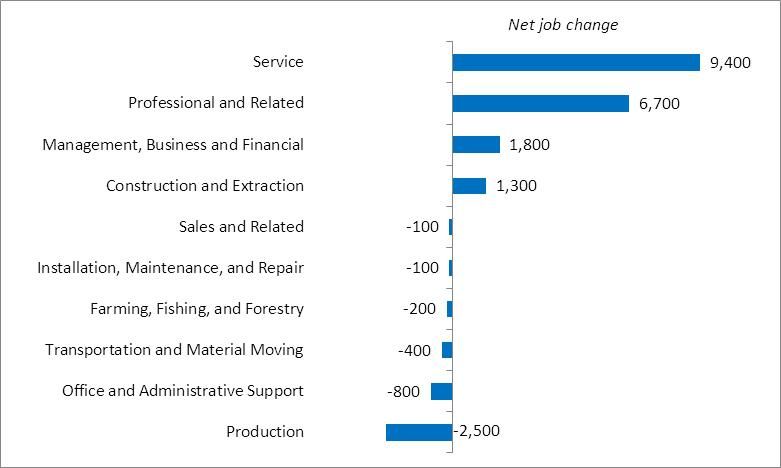
Labor Force Outlook – Job Growth
        Job growth is expected to exceed labor force growth reflecting declining
                       unemployment from elevated 2012 levels

Though the size of the labor force is expected to decline slightly through 2022, employment is
expected to rise by 15,000. How can employment increase without labor force growth?
Unemployment is expected to continue to trend lower from the 7.2 percent average in 2012, as
thousands become re-employed.
Most growth is expected in wage and salary jobs, which are projected to increase 14,000 to nearly
606,000. The number of self-employed, private household and unpaid family workers is expected to
rise about 1,000 to 65,000.
The projected 2.3 percent rise in total employment between 2012 and 2022 is well below the 11.3
percent growth the U.S. Bureau of Labor Statistics projects for the nation. This slower expected
growth reflects our larger share of population approaching retirement. Beyond 2022, job growth is
expected to be further constrained by our advancing age structure, which also will impact demand for
products and services and the types of available jobs. Aging will keep demand for health and
retirement services high and limited labor force growth is likely to cause employers to pursue
improvements in productivity through automation and more efficient work practices.

                                                                                                    9
Section 2 – Industry Employment Outlook
Goods-Producing
Service-Providing
56% 44%
32%
68% 18%
1950 13%
82%
1975
87%
2000
2022, projected
The structure of employment shifts over time as some industries add and other industries lose jobs.
Over short periods of time these shifts tend to be small, but over decades the profile of employment
changes significantly. Many of Maine’s cities were built around paper or textile mills or shoe shops.
Large brick buildings in the center of some cities attest to the prominence those industries once had
as the economic backbone of an entire region. Today some of those buildings have been torn down,
others stand empty, while others have been redeveloped for housing, retail, medical, and other uses.
The redeveloped uses of many of those buildings symbolize the major changes our economy has
undergone in just a few decades.
In 1950, Maine had 109,000 manufacturing jobs, accounting for 43 percent of nonfarm jobs. A full 11
percent of nonfarm jobs were in textile and apparel mills; 10 percent were in forest products,
including paper and lumber mills and logging; 7 percent were in shoe shops and tanneries; and 4
percent were in food manufacturing. In the following 62 years to 2012, the total number of nonfarm
jobs more than doubled, adding 344,000 jobs, yet manufacturing declined by 58,000 jobs to just 8
percent of jobs today.
10Industry Outlook – Structure of Employment
With 101,000 jobs, healthcare and social assistance is now our largest employing sector. Government
(federal, state, and local, including public schools, colleges, and universities) is nearly as large, with
97,000 jobs. Retail trade (81,000 jobs), leisure and hospitality (62,000), and professional and business
services (58,000), and manufacturing (51,000) are the next largest.
11Industry Outlook – Projected Industry Employment Change
Only four sectors are expected to have more jobs in 2022 than in 2008
Employment in Maine peaked in 2008 at the beginning of the recent recession. From 2008 to 2012,
including the recession and early recovery, nine sectors experienced net job losses and five
experienced net job gains. Job losses were primarily in industries that make, move, or sell products,
particularly manufacturing, construction, retail and wholesale trade, as well as information and
government. Job gains were primarily in human capital-intensive sectors including educational
services, healthcare and social assistance, professional and business services as well as leisure and
hospitality.
The outlook from 2012 to 2022 is for growth to continue to be uneven among sectors. Those shaded
green in the chart are expected to reach new highs, while those in white are expected to have about
the same number of jobs in 2022 as they had at the onset of the recession in 2008. The six sectors
shaded gray are expected to recover fewer jobs than were lost during and shortly after the recession
or to continue to lose jobs (manufacturing, government, and information). The following four pages
look at employment in certain sectors in 2008 and 2012 and our projections for 2022.
12Industry Outlook – Sectors Reaching New Job Highs
Healthcare and social assistance added 2,300 jobs from 2008 to 2012 and is expected to add 13,100
additional jobs through 2022, creating job opportunities in healthcare practitioner and technician,
healthcare support, community and social service, and office and administrative support occupations.
Private educational services (not including public schools) added 1,200 jobs from 2008 to 2012 and is
expected to add 500 additional jobs through 2022, creating job opportunities in education and
training, administrative support, and management occupations.
13Industry Outlook – Sectors Reaching New Job Highs
Professional and business services added 1,400 jobs from 2008 to 2012 and is expected to add
another 3,500 jobs through 2022, creating job opportunities in business and financial, management,
computer and mathematical, architecture and engineering, and legal occupations.
The leisure and hospitality sector added 1,500 jobs between 2008 and 2012 and is expected to add
2,400 additional jobs through 2022, creating job opportunities in food preparation and serving,
building and grounds cleaning and maintenance, office and administrative support, and management
occupations.
14Industry Outlook – Sectors Expected to Grow, But Not Recover to Pre-Recession
Levels
Construction jobs fell 3,900 from 2008 and 2012. The industry is projected to add just 500 jobs
through 2022, not fully recovering to pre-recession job levels. This affects job growth and openings
primarily in construction and extraction occupations.
The situation in retail trade is similar. The industry shed 3,700 jobs from 2008 to 2012. Retail is
projected to add 1,200 jobs through 2022, not fully recovering to pre-recession levels. This affects job
growth and openings in sales and related, office and administrative support, transportation and
material-moving, and buildings and grounds cleaning and maintenance occupations.
15Industry Outlook – Sectors Expected to Continue to Lose Jobs
Manufacturing shed 8,000 jobs from 2008 to 2012 and is expected to shed 4,400 additional jobs
through 2022. This adversely impacts the number of job openings in production, office and
administrative support, transportation and material-moving, and installation, maintenance and repair
occupations.
Government shed 3,400 jobs from 2008 to 2012 and is expected to shed 2,900 additional jobs
through 2022. This adversely impacts the number of jobs and opening in education, protective
service, and office and administrative support occupations. (Much of the decline in government is in
local schools due to a declining population of children.)
16Section 3 – Occupational Employment Outlook
As massive as the changes in employment have been across industries, the changes in the
occupational structure of employment have been even greater over the last several decades. Many
factors drove these changes. The reallocation of jobs across industries was a primary factor.
Manufacturers require large numbers of production-line workers and hospitals require large numbers
practitioners and support workers to care for patients. Declines in manufacturing jobs have required
many production workers to learn new skills or gain additional education to become employed in
other sectors.
Within each industry there also is a reallocation of functions as technology and work-practice
improvements change how we produce goods or deliver services. Banks were once heavily staffed by
tellers, but the rise of ATM machines, then online and mobile banking, allowed customers to perform
transactions on their own. Lower paying, entry-level teller jobs were replaced by information
technology jobs to design and maintain these systems. The IT jobs have much higher education and
skill requirements and offer much higher earnings. Similarly, rising automation of manufacturing
production lines require fewer assembly line workers and more technicians to operate and
troubleshoot advanced machinery. This sort of reallocation is occurring across all industries.
We can generalize that the share of jobs in occupations physically making, building, moving, or fixing
things is declining, while the share in human-capital intensive occupations is rising.
17Occupational Outlook – Change in Employment by Occupational Group
Growth is expected to be concentrated in a few occupational groups
The occupational job outlook is largely for a continuation of those same long-term trends. Most job
growth is expected in the two largest groups of occupations, professional-related and service jobs, as
well as management and financial occupations and construction and extraction occupations. Most
other occupational groups are expected to experience little change, though jobs in office
administrative support, production, and transportation and material-moving occupations are
expected to decline.
18Occupational Outlook – Jobs by Education Requirement and by Earnings
Growth is expected to continue to be concentrated in occupations that require post-
secondary education that pay well or in low-skill, low-paying occupations
The result of these trends is a concentration of job growth in occupations with generally higher-than-
average education and skill requirements that fall at the upper end of the earnings spectrum
(professional and management/finance jobs), on the one hand, and in occupations with generally
lower education and skill requirements that fall at the lower end of the earnings spectrum (service
jobs), on the other. Jobs in occupations that require a post-secondary credential accounted for just
one third of employment in 2012, but are expected to produce 60 percent of net job growth through
2022. Meanwhile, the two thirds of jobs in occupations that generally do not require a post-
secondary credential are expected to account for just 40 percent of net growth.
The number of jobs in many occupations in the middle of the earnings spectrum that generally do not
to require post-secondary education, such as production, transportation, repair and installation, and
administrative-support jobs, are either expected to continue to grow very slowly or decline.
19Occupational Outlook – Training and Work Experience for Jobs Requiring a High
School Diploma or less
Job Training (OJT = on-the-job training)
TOTALS,
HS diploma or
Work
less None Short-term Moderate Long-term Apprentic
Experience
specified OJT OJT OJT eship
Work Experience
None specified 1% 58% 18% 6% 5% 88%
Less than 5 years 9%Occupational Outlook – Average Annual Openings: Opportunities from Growth and
Replacement
Job openings stem from replacement demand as well as job creation. Nearly 6 of 7
openings will be due to replacement needs.
We focus on job openings occurring due to expansion or not occurring due to contraction in
industries and occupations because that is what drives the structural shifts that are reallocating the
types of jobs and the associated knowledge, skills, and abilities in demand. However, the largest
source of job openings each year occurs due to the need to replace those who retire or leave an
occupation. Openings due to replacement demand outnumber those due to growth by nearly 6 to 1.
In occupations growing extremely rapidly the ratio is much lower.
The number of job openings is very high in some occupations with little or no growth. This is
especially true in lower-paying, high-turnover functions, such as retail clerks and hospitality
occupations. Alternatively, the number of openings is relatively low in some jobs with high rates of
growth, especially occupations with low levels of employment.
21Occupational Outlook – Annual Openings by Occupational Group
Replacement openings are expected even in occupations losing jobs
Retirements and turnover will create job openings in all occupational groups. Increased use of
robotics and automation to meet demand over the last three decades limited hiring in the
manufacturing sector, which led to an older workforce than most other sectors. Nearly 28 percent of
the manufacturing workforce is over 55. Thus, despite a projected decline in manufacturing jobs
through 2022, there will still be substantial numbers of openings each year in production,
transportation and material moving, and installation and repair occupations, which comprise a large
share of manufacturing.
Similarly, the workforce in retail trade and food services is younger and turnover rates are higher
than average, leading to large numbers of jobs openings in those kinds of occupations.
22Occupational Outlook – STEM Jobs
Report after report over the last two decades from educational, trade, and other interest groups
exhorted the need to educate more people for STEM* jobs. Many portray an impending shortage of
workers in highly skilled, well-paying science, technology, engineering, and math based occupations.
Most treat STEM jobs as a homogeneous group with similar growth prospects.
The problem with these characterizations is that there is a great deal of diversity of functions and an
equally wide range in growth prospects not only between science and technology, for example, but
also the range of occupations within sciences, within technology, within engineering, and within
mathematics. The variety of STEM occupations creates very different growth prospects.
Under the Standard Occupational Classification system used by economic agencies to classify and
count jobs there are 653 occupations in which there is employment in Maine and for which we have
developed projections. Of that number, 181 occupations are designated as STEM by either the O*Net
consortium or the U.S. Bureau of Labor Statistics. Collectively, the number of jobs in those 181
occupations is expected to rise 6.5 percent from 2012 to 2022, which is nearly three times the rate
for all occupations. The expected gain of 6,800 jobs in STEM occupations accounts for 46 percent of
expected net job growth.
Individually, 107 of those STEM designated occupations are expected to grow faster than average,
another 13 are expected to grow more slowly than average, and 61 are expected to be unchanged or
lose jobs. Like other types of functions, slowly growing or declining STEM occupations generally are
those being impacted by new or changing technologies that are improving or replacing processes.
*Science, Technology, Engineering and Mathematics
23Occupational Outlook – The Nature of Work
Work attributes valued in growing and declining occupations differ
The nature of work increasingly demands higher levels of literacy and more sophisticated technology
competencies. The primary performance attributes of jobs in growing occupations are concentrated
around critical thinking, problem solving, reading comprehension, effective communication, and
decision making. Those contrast with the primary work activities or knowledge requirements of
occupations that are expected to have the highest rates of job loss, which include handling and
moving objects, controlling machines, repairing and maintaining equipment, and clerical functions.
Detailed projections for individual industries and occupations are available
at www.maine.gov/labor/cwri/outlook.html.
24You can also read