Manatee: detection and quantification of small non-coding RNAs from next-generation sequencing data - Nature
←
→
Page content transcription
If your browser does not render page correctly, please read the page content below
www.nature.com/scientificreports

            OPEN           Manatee: detection and
                           quantification of small non-coding
                           RNAs from next-generation
                           sequencing data
                           Joanna E. Handzlik1,2, Spyros Tastsoglou1,3, Ioannis S. Vlachos               4,5,7
                                                                                                                 &
                           Artemis G. Hatzigeorgiou1,3,6,7*
                           Small non-coding RNAs (sncRNAs) play important roles in health and disease. Next Generation
                           Sequencing (NGS) technologies are considered as the most powerful and versatile methodologies to
                           explore small RNA (sRNA) transcriptomes in diverse experimental and clinical studies. Small RNA-Seq
                           (sRNA-Seq) data analysis proved to be challenging due to non-unique genomic origin, short length, and
                           abundant post-transcriptional modifications of sRNA species. Here, we present Manatee, an algorithm
                           for the quantification of sRNA classes and the detection of novel expressed non-coding loci. Manatee
                           combines prior annotation of sRNAs with reliable alignment density information and extensive rescue
                           of usually neglected multimapped reads to provide accurate transcriptome-wide sRNA expression
                           quantification. Comparison of Manatee against state-of-the-art implementations using real and
                           simulated data demonstrates its high accuracy across diverse sRNA classes. Manatee also goes beyond
                           common pipelines by identifying and quantifying expression from unannotated loci and microRNA
                           isoforms (isomiRs). It is user-friendly, can be easily incorporated in pipelines, and provides a simplified
                           output suitable for direct usage in downstream analyses and functional studies.

                           The discovery of short functional RNA classes such as microRNAs (miRNAs) and small interfering RNAs (siR-
                           NAs) revealed their involvement in pervasive regulation of gene expression and inaugurated the RNA revolu-
                           tion. NGS techniques offer a powerful high-throughput means for the quantification and discovery of many
                           sRNA classes1. sRNA-Seq has been established as the gold standard technique for high-throughput detection and
                           quantification of sRNAs typically ranging between 18 and 35 nucleotides in length, enabling expression studies
                           of sRNA species, as well as for the discovery of novel sncRNAs. miRNAs have been the focal point of such anal-
                           yses, since they play a pivotal role in post-transcriptional regulation of gene expression2 controlling pathways in
                           health and disease3,4. Other sRNAs identified in NGS experiments, such as ribosomal RNAs (rRNAs), transfer
                           RNAs (tRNAs) and small nucleolar RNAs (snoRNAs), were usually conceived as findings of secondary signifi-
                           cance. However, recent studies have provided insight into novel biological roles of such sRNAs5–7. Using rele-
                           vant approaches, new sRNA families with biological functions that are still under debate have been discovered.
                           tRNA-derived RNA fragments (tRFs), a novel class of sRNAs second in abundance only to miRNAs5 or box C/D
                           snoRNAs7 comprise characteristic examples of such classes. The majority of tRF sequences are derived from pre-
                           cise cleavage and processing at the 5′ or 3′ end of mature or precursor tRNAs, and studies indicate their possible
                           involvement in miRNA-like RNA targeting as well as global translational suppression8. snoRNAs, known to serve
                           functions in RNA modification processes9, have been recently shown to host specific miRNA-like short RNAs and
                           have been found deregulated in various diseases and malignancies6,7. Hence, accurate quantification and analysis
                           of the full sRNA spectrum is of great interest.

                           1
                            DIANA-Lab, Department of Electrical & Computer Engineering, University of Thessaly, Volos, 38221, Greece.
                           2
                            Department of Biology, University of North Dakota, Grand Forks, North Dakota, 58202, USA. 3Hellenic Pasteur
                           Institute, Athens, 11521, Greece. 4Harvard Medical School Initiative for RNA Medicine, Department of Pathology,
                           Cancer Research Institute, Beth Israel Deaconess Medical Center, Harvard Medical School, Boston, Massachusetts,
                           02115, USA. 5Broad Institute of MIT and Harvard, 02142, Cambridge, MA, USA. 6Department of Computer Science
                           and Biomedical Informatics, University of Thessaly, Lumia, 35131, Greece. 7These authors contributed equally:
                           Ioannis S. Vlachos and Artemis G. Hatzigeorgiou. *email: arhatzig@inf.uth.gr

Scientific Reports |   (2020) 10:705 | https://doi.org/10.1038/s41598-020-57495-9                                                           1
www.nature.com/scientificreports/ www.nature.com/scientificreports
Small RNA-seq data contain a plethora of processing and maturation products potentially including yet
unknown RNA species10. The non-coding RNA (ncRNA) field is rapidly expanding with an increasing number of
newly identified and biologically relevant and important ncRNAs11. These considerations highlight the need for
sensitive, accurate and efficient bioinformatics tools that can properly handle any kind of small ncRNA present
in sRNA-seq datasets.
Currently the analysis of sRNA-Seq data is not as mature as for longer RNAs, and their usefulness is impacted
by major hindrances. Particularly, the short length (usually ~18–30 nt) of sRNA-Seq reads introduces the prob-
lem of multi-mapping, where a single read may align to multiple genomic locations with equal alignment scores.
This issue is exacerbated if we consider that many sRNAs are transcribed from repeat loci12. As a consequence,
the most common approaches adopted for RNA-Seq data13 cannot be successfully applied here: retaining only
uniquely aligned mappings14 leads to the omission of a significant portion of reads, while other strategies such as
equal distribution15,16, random read placement17 or reporting all possible alignment positions of multimapping
reads18, inevitably leads to incorrect or indirectly quantifiable results13. Additionally, the analysis of numerous
intermediate and terminal products of sRNA biogenesis, as well the potential discovery of yet unknown RNA
species in sRNA-Seq data, remains undermined with current approaches11.
State-of-the-art methods employ direct alignment against known miRNA or sRNA annotations and not on the
genome, in order to diminish the extent of multi-mapping13. However, these methods are bound to quantifying
only known sRNAs, while reads that could align better in other genomic loci are forced to map with lower scores
in the reduced search space19. The ambiguity of the genomic origin of sRNAs may also lead to cross-mappings,
in which a short RNA originating from one locus is partially or completely assigned to a different location20.
Moreover, most available algorithms are dedicated to studying a single sRNA biotype21, which further restricts
the alignment space and can lead to the misclassification of reads.
Current implementations for sRNA-Seq quantification can be divided in two categories based on their analysis
scope: those that quantify only a single sRNA family, such as miRDeep221, and those pursuing to cover the broad
sRNA space such as miRge22, sRNAbench23, and ShortStack24. miRDeep2 is an extensively used tool dedicated
entirely to miRNA quantification, while miRge prioritizes the miRNA biotype over the rest of the sRNAs by uti-
lizing a step-wise alignment strategy against mature miRNAs, miRNA hairpins, ncRNAs, mRNAs, and a modified
miRNA library. Implementations such as sRNAbench or ShortStack have sought to address the positioning of
multimapping reads in a more refined manner. sRNAbench either assigns multimaps wholly to all their mapping
positions, or divides their counts equally between them. Both practices could potentially lead to misinterpretation
of transcript expression, especially in cases where multimapping positions pertain to different RNA biotypes.
Read mapping, as implemented in the ShortStack tool, is based on local-weighting read alignments. The attempt
for improved multimaps placement in ShortStack, relies on unique or fractional weighting schemes and their
calculated probabilities for each alignment. This probabilistic placement of multimaps may lead to disparate
expression profiles in repeated executions of the same sample. Additionally, highly multi-mapped reads, which
can still carry biologically important information, are discarded by this approach.
Since multimaps are a major obstacle for accurate analysis of sRNA-Seq datasets, we first analyzed 30
sRNA-Seq libraries from diverse tissues to assess the distribution of uniquely aligned and multimapping reads
across samples. We further examined the mappings with respect to existing annotation and identified interesting
aspects of sRNA-Seq data and assessed the underlying complexity in the placement of multimapping reads. Based
on our findings, we implemented the sMAll rNa dATa analysis pipElinE (MANATEE) for detection and quanti-
fication of known and unknown small RNAs by efficiently rescuing and utilizing multimapping reads. Manatee
is not limited to a single sRNA class and achieves highly accurate results, even for elements residing in heavily
repeated loci, by making balanced use of existing sRNA annotation and observed read density information dur-
ing multi-mapping read placement. Manatee does not prioritize any particular sRNA type, enabling the accurate
quantification of diverse RNA classes. Additionally, Manatee exploits sRNA-Seq reads to detect expressed unan-
notated genomic loci that could harbor still unknown sRNA products. The user-friendly pipeline of Manatee
returns ncRNA expression counts that can be directly utilized in downstream analyses, such as differential expres-
sion analyses, rendering it easily integrable in larger bioinformatics workflows.
Results
Multimaps analysis. In order to study the characteristics of multi-mapping reads, we performed an ini-
tial analysis of 30 distinct human sRNA-Seq libraries derived from hepatoblastoma, liver, brain, gallbladder,
colon, lung, pancreas, skin, tongue, thyroid, and heart tissue, embryonic stem cells, as well as MCF7 and HepG2
cell lines, in order to assess the extent of multimaps and uniquely aligned reads (UARs) in sRNA-Seq data-
sets (Supplementary Table 1). All the above libraries were obtained from Gene Expression Omnibus25 (GEO).
Figure 1a presents the average percentage of UARs, multimaps, and unaligned reads across the samples. Five
examined cases of positioning multimaps were based on reads with 2 to 17 multimapping regions (Fig. 1b).
According to the analyzed cases, a multimap may fall into:
(1) unannotated regions of UAR clusters (denoted as blue in Fig. 1b)
(2) annotated regions lacking UAR clusters (red)
(3) annotated regions that also contain UAR clusters (green)
(4) unannotated regions that also lack UAR clusters (orange)
(5) annotated regions and regions with UAR clusters with no concordance (pink).
Case 3, which includes multimaps falling into regions with both existing annotation and UAR clusters, was
further analyzed and examined for the number of such regions per multimap (Fig. 1c). For example, the majority
of multimaps with two possible mapping loci had UARs and annotation for both mapping positions. The majority
Scientific Reports | (2020) 10:705 | https://doi.org/10.1038/s41598-020-57495-9 2www.nature.com/scientificreports/ www.nature.com/scientificreports
a b
UARs
20M A
Number of reads
UARs+A
45% UAR 19% Other 15M No indication
UARs+A (no accordance)
10M
5M
0M
2 3 4 5 6 7 8 9 10 11 12 13 14 15 16 17
36% Multimaps < 50
Number of mapping loci
c
1
2 1 1
1
1
5 6
5
3
2 4
4 4 3
23 23 2
2 mapping loci 3 mapping loci 4 mapping loci 5 mapping loci 6 mapping loci
1
1 1
1 2 1 2 2
5 3
2 2 4
3
7 mapping loci 8 mapping loci 9 mapping loci 10 mapping loci 11 mapping loci
UARs+A = 1 UARs+A = 2 UARs+A = 3 UARs+A = 4 UARs+A = 5 UARs+A = 6
Figure 1. Frequency, proportions, and characteristics of multimaps in sRNA-Seq libraries. (a) The average
number of UARs, multimaps, and other reads (i.e. unaligned/multimaps exceeding the defined threshold)
across all samples. (b) Multimap read categories based on available annotation and UARs. Colors mark
five examined cases where each multimap is screened for available annotation and UARs. (c) Proportion of
multimaps and the number of their mapping regions with both UAR clusters and available annotation.
of reads with four possible mapping loci had UARs and annotation for one of the four mapping positions. The
distribution of the five examined cases across numbers of multi-mapping regions was evaluated across different
numbers of randomly selected samples to estimate whether the selected sample size introduced biases in the anal-
ysis of multimaps in sRNA-Seq libraries (Supplementary Fig. 1). As shown in Supplementary Fig. 1, the distri-
butions of the multimap cases across different sample sizes are consistent, providing confidence that the selected
sample size is sufficient in the current analysis of small reads.
A large portion of sRNA-Seq reads (36%) in the analyzed datasets mapped to multiple genomic loci (Fig. 1a).
19.7% of total multimaps fell into regions with UARs lacking annotation and for 15.2% no straightforward infor-
mation of positioning or annotation was available (Fig. 1b). Algorithms based on genomic alignment that rely
entirely on UAR information, may fail to account for cases of multimaps that could otherwise be assigned to exist-
ing annotation (red in Fig. 1b, 13.3% of total multimaps). On the other hand, multimaps assigned to more than
one genomic feature using annotation from a broader spectrum of ncRNAs (Fig. 1c) showed that tools dedicated
entirely to a specific RNA biotype may be biased towards that type (Supplementary Fig. 2).
Manatee. The conclusions yielded by the multimaps analysis constituted the basis for the Manatee algo-
rithm which attempts to approach the multimap issue by simultaneously incorporating information from UARs
and existing annotation. We aimed to combine into a single step the crucial information of uniquely mapped
reads and annotation without prioritizing any particular sRNA type (Fig. 2 and Methods section). The algorithm
also attempts to salvage highly multimapping and unaligned reads, which are usually discarded in many avail-
able sRNA analysis pipelines. Additionally, Manatee exploits sRNA-Seq reads to detect expressed unannotated
genomic loci that could harbor yet unknown small RNA products.
Comparison to other methods using simulated data. The accuracy of Manatee was initially evaluated
using a simulated short read dataset (https://github.com/jehandzlik/Manatee/tree/simulatedData). Bowtie v117
was used as a baseline, since it is a commonly used aligner in sRNA-Seq pipelines, while miRge, ShortStack, and
sRNAbench were employed as state-of-the-art approaches in the evaluation. miRge and ShortStack perform read
alignment with singular functionality, against sRNA annotation (miRge) and against the genome (ShortStack),
Scientific Reports | (2020) 10:705 | https://doi.org/10.1038/s41598-020-57495-9 3www.nature.com/scientificreports/ www.nature.com/scientificreports
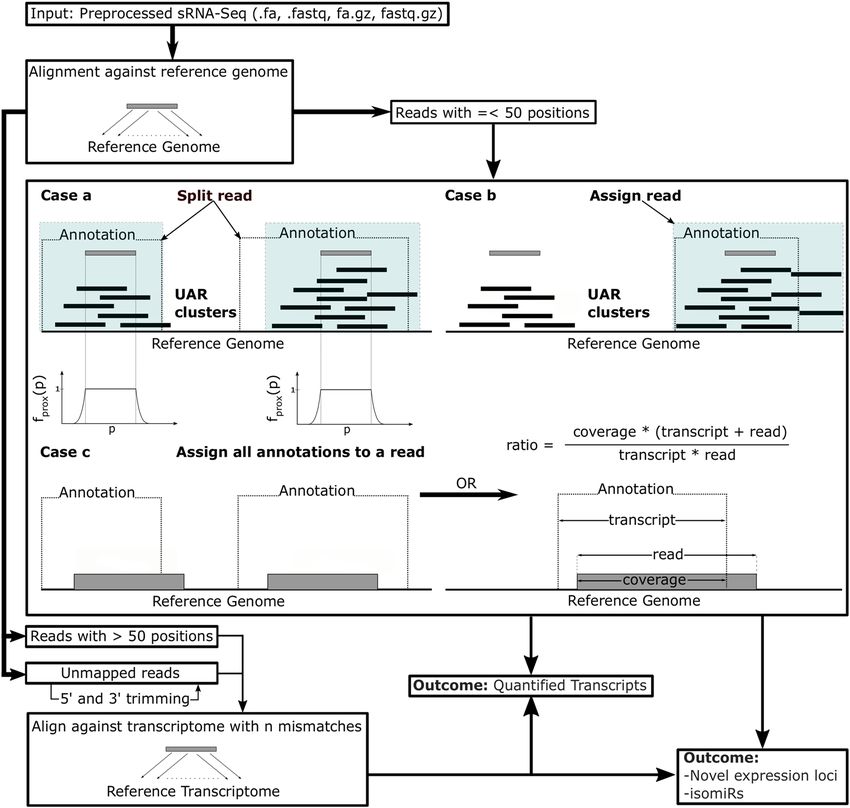
Figure 2. Manatee workflow. Reads with up to 50 multi-mapping positions are either: (a) split among their
annotated and UAR-containing loci according to Eq. 1, (b) assigned to regions containing both annotation
and UARs, or (c) assigned to loci with existing annotation. In case of (c), if an annotated miRNA is within
the annotated loci, a ratio for selecting the best fitted transcript is used to prioritize mature miRNAs over
precursors. Reads with more than 50 mapping positions, reads which could not be mapped to the genome,
and reads that could not be assigned to regions with existing annotation and UARs are aligned against the
transcriptome with gradual increment of allowed mismatches. The output results contain quantified transcripts,
putative novel expression loci, and isomiR sequences.
while sRNAbench extends the functionality of miRanalyzer by applying genomic/transcriptomic alignment of
multiple sRNA types in a hierarchical step-wise manner. Those diverse approaches of sRNA quantification con-
stitute attractive candidates for direct comparisons with the Manatee algorithm. miRge, ShortStack, sRNAbench
(genomic alignment mode), and Manatee were executed under their default settings. Bowtie was executed per-
mitting a maximum of 1 mismatch and up to 5 multimaps, while transcript quantification was performed with
HTSeq-Count14 using the intersection-nonempty mode and “nonunique all” parameter. The selected parameters
for both Bowtie and HTSeq-Count were found to be optimal for the input in question.
Estimated sRNA counts for HTSeq-Count, Manatee, miRge, ShortStack, and sRNAbench were contrasted
to the ground truth (i.e. simulated counts) (Fig. 3a). All tools tend to over-estimate numerous transcripts that
have zero abundance in the simulated dataset (Fig. 3a, Sim. = 0 & Est. > = 5). However, the opposite behavior
was observed at the other end of the spectrum: expressed and highly expressed transcripts were not assigned any
reads (Fig. 3a, Sim. >5 & Est. = 0). Among the tested tools, counts estimated by Manatee appeared closest to the
simulated abundances (Fig. 3).
Manatee is not only able to map and accurately quantify diverse sRNA classes, but it also fares favorably
when compared to methods specifically designed for miRNAs. miRDeep2, which uses Bowtie to map sequencing
reads against precursors and discards or assigns multimaps equally to their valid loci, was executed against the
same dataset, with default settings. These results vividly depict that Manatee users can quantify and investigate
underexplored small RNA classes, while also obtaining accurate and robust results for miRNAs (the superstar of
sncRNA class).
Scientific Reports | (2020) 10:705 | https://doi.org/10.1038/s41598-020-57495-9 4www.nature.com/scientificreports/ www.nature.com/scientificreports
a 100
80
60
% of reads
40
20
0
ShortStack
ShortStack
HTSeq−Count
miRge
HTSeq−Count
miRge
Manatee
sRNAbench
Manatee
miRDeep2
sRNAbench
FC = 1 1.1 < FC 3 Sim. = 0 & Est. >= 5
1 < FC 5 & Est. = 0 denotes percentage
of reads where the simulated transcript counts >5 were estimated as zeros by the examined tools. Sim. = 0 &
Est. > = 5 relates with proportion of estimated transcript counts >5 for which the true simulated count was
zero. (b) Comparison between the ground truth count sum of simulated reads and the total estimated transcript
counts across implementations.
The sum of simulated transcript counts was contrasted against the estimated counts by the six tools. ShortStack
displayed tendency for count inflation, while HTSeq-Count, miRge, miRDeep2, and sRNAbench underestimated
transcript counts (Fig. 3b). Precision metrics were also calculated to assess the performance of the examined
algorithms by comparing simulated to estimated read counts for the entire pool of small ncRNA transcripts, as
well as for miRNAs only (Table 1). Root-mean-squared deviation (RMSD), distance metrics, and correlation
coefficient values computed for estimated counts versus the ground truth all indicate that Manatee outperforms
the other implementations by providing less inflated/deflated transcript counts that are more closely associated
with the simulated counts. A major driving force for this increase in accuracy is the rescue of multimapping reads.
Manatee aligns against the genome using Bowtie but rescues efficiently the multimapping reads by assigning
them to the most probable loci. In comparison, the use of uniquely aligned reads from Bowtie, a commonly used
approach, is one of the lowest performers.
Scientific Reports | (2020) 10:705 | https://doi.org/10.1038/s41598-020-57495-9 5www.nature.com/scientificreports/ www.nature.com/scientificreports
Jaccard Euclidean Pearson Spearman
Tool RNA type RMSD distance distance correlation correlation
HTSeq-Count 372.614 0.298 20439.478 0.798 0.577
Manatee 341.494 0.173 15730.981 0.879 0.796
miRge small ncRNAs 408.08 0.503 26553.417 0.641 0.581
ShortStack 456.499 0.271 20939.313 0.801 0.655
sRNAbench 361.399 0.395 22805.388 0.744 0.556
HTSeq-Count 369.164 0.442 8813.660 0.529 0.392
Manatee 107 0.031 2556.831 0.929 0.954
miRge 249.67 0.216 6419.008 0.731 0.684
miRNAs
ShortStack 236.657 0.151 5738.626 0.683 0.737
sRNAbench 215.574 0.138 5218.504 0.752 0.725
miRDeep2 155.313 0.078 3867.274 0.893 0.827
Table 1. Performance metrics for the accuracy of evaluated implementations using simulated data.
Comparison to other methods using real sRNA-Seq data. Although using simulated datasets offers
the advantage of knowing the true transcript abundance, this practice can be prone to shortcomings (e.g. lack
of complexity observed in real data sets). The alternative of using real data, allows the examination of agree-
ment among different quantification algorithms. For this reason, we used sRNA-Seq data derived from breast
cancer MCF7 cells (Study ID: SRP060224, Sample ID: SRR2084358) and obtained from GEO to cross-correlate
the compared sRNA/miRNA quantification methods using Pearson correlation (Fig. 4). Seven genomic fea-
tures exhibiting read counts above 10,000 reads in all executions were removed from the comparison as outliers
(Supplementary Table 3). Removing these few features excluded factors that would have spuriously inflated and
skewed the correlations between the estimated transcript counts among the examined tools.
Real data enabled the comparison and the assessment of concordance between the tools. In the total sRNA
space, the highest concordance (r = 0.93) was observed for the performance of Bowtie + HTSeq-Count and
ShortStack, followed by the Manatee-sRNAbench pair-wise comparison (r = 0.77). For miRNAs, Manatee exhib-
ited >0.8 correlation coefficient with ShortStack, sRNAbench and miRDeep2, and exhibited the highest correla-
tion (r = 0.94) with miRDeep2 which is the reference tool in miRNA quantification. When comparing the total
sRNA transcriptome results, a substantial divergence between estimated counts was observed across executions.
These findings indicate that the tools may each have intrinsic properties that result, at least in some cases, in mis-
classification and erroneous quantification of sRNAs.
Unannotated clusters. Manatee supports the detection of expressed unannotated loci that can be used to
identify novel sRNAs and sRNA classes in diverse research settings. Execution of Manatee with default settings
on the MCF7 sRNA-Seq sample (Study ID: SRP060224, Sample ID: SRR2084358) detected a total of 588 unan-
notated clusters. 503 clusters with cluster lengthwww.nature.com/scientificreports/ www.nature.com/scientificreports
Figure 4. The analyzed sRNA-Seq sample was compared across 5 methods for all sRNA types (lower left
panels) and across 6 methods for miRNAs (upper right panels). Pearson correlation was calculated for each pair
of compared tools and denoted on each plot with the red line indicating the perfect correlation.
Number of clusters
80
40
0
19 22 25 28 31 34 37 40 43 46
Unannotated cluster length
Figure 5. Length distribution of uniquely aligned read clusters lacking annotation in real sRNA-Seq sample.
Methods
Multimap analysis. Quality-check and pre-processing of all libraries utilized in multimaps analysis was
performed as in Vlachos et al.28. In brief, dataset quality control was performed using FastQC29. Cutadapt30 was
used for adapter and contaminant removal. Reads were mapped against the GRCh38 human reference assembly
using Bowtie. UARs and multimaps with up to 50 genomic positions were retained for further analysis. Clusters
of UARs were created across the genome for each sample. UARs were considered as reads mapping uniquely to
the genome with one allowed mismatch and Bowtie “best strata”17. Genomic position of UAR includes the infor-
mation about the mapping chromosome, strand, start, and end position. The minimum density of a UAR cluster
was set to one read. Non-coding annotation available in Ensembl v8527, GtRNAdb 2.031, and miRBase v2132 was
used to construct a reference for genomic features. Specifically, long ncRNA (lincRNA), mitochondrially encoded
rRNA (mt-rRNA), mitochondrially encoded tRNA (mt-tRNA), processed transcript, rRNA, small cytoplasmic
RNA (scRNA), snoRNA, small nuclear RNA (snRNA), and vault RNA (vtRNA) gene types were derived from
Ensembl, tRNAs were derived from GtRNAdb, while miRNA precursor and mature annotation was derived from
miRBase. A minimum 1 nucleotide overlap between the genomic position of aligned read and an annotated tran-
script was required to assign the read to that specific transcript. All transcripts and UARs were extended by 50nt
at each end to allow flexibility in the assignment of reads without adding bias.
Scientific Reports | (2020) 10:705 | https://doi.org/10.1038/s41598-020-57495-9 7www.nature.com/scientificreports/ www.nature.com/scientificreports
Manatee algorithm. Input. Manatee requires FASTQ/FASTA sRNA-Seq data files that have been
pre-processed for 3′ adapter and barcode removal. Genomic annotation for ncRNAs is required as input in GTF
format with the following tags in the attributes field: gene_name, gene_id, and gene_biotype.
Alignment and quantification. The full outline of NGS reads abundance estimation adopted by Manatee is pro-
vided in Fig. 2. Mapping of sequencing reads is carried out using Bowtie aligner. In the primary phase, reads
aligned uniquely to the genome are used to form the UAR clusters across the genome. Multimaps are assigned to
loci based on the following approach:
f
score i i
(x , y )
fsplit (xi , yi ) =
∑ iMML
= 1 fscore (xi , yi ) (1)
yi + r
fscore (xi , yi ) = ∑ fcov (p) ⋅ f prox (p)
p = x i− r (2)
1, xi ≤ p ≤ yi
1 , xi − r < p < xi
f prox (p) =
e(xi−p)/n
1
, y < p < yi + r
e
(p − yi)/ n i
(3)
where xi and yi are the start and end placement positions of the multimap i and r is the range in the close prox-
imity of the read (default 50). Function fcov denotes the UAR density at genomic position p and fprox assigns
weights to fcov based on the position p within the genomic region [xi − r, yi + r]. The multimap is split across its
valid multi-mapped loci (MML) according to the score calculated using function fsplit. n denotes the relevance of
approximate density distribution and is set by default to 10. For multimaps with non-matching annotation and
positioning of UAR clusters, annotation is preferred and used to guide the final placement of the reads. If a multi-
map falls into regions which are annotated completely or partially, all relevant transcripts are noted in the output
file in the form of alternative transcripts. In case where at least one annotated miRNA is present among those
features, the read is assigned to the transcript which exhibits the highest coverage score (ratio):
coverage ⋅ (transcript length + read length)
ratio =
transcript length ⋅ read length (4)
Coverage is the number of overlapping nucleotides between the annotated feature (transcript) and the read
length. The ratio heuristic prioritizes the annotation with the highest coverage, while also considering read and
transcript lengths.
Salvaging reads by secondary transcriptome alignment. Reads that exceed the multi-mapping threshold and
reads that could not be mapped to the genome are additionally aligned against the transcriptome based on the
provided annotation. In the latter case, the number of allowed mismatches is gradually augmented (maximum
default 3). In both cases, reads that can be assigned to transcripts with existing mapping densities calculated in
previous steps are assigned to those transcripts. If no expression estimates exist, up to five transcripts with the
highest mapping quality are retained and assigned as alternative transcripts.
IsomiR detection. All reads assigned and quantified as miRNA type are retained and stored in a separate output
file. Each detected putative isomiR sequence is stored independently along with its estimated count. Since each
read represents the actual sequence of the sRNA molecule, it can be used to identify diverse miRNA modifica-
tions, such as post transcriptional modifications, 5′ and 3′ templated additions, or single nucleotide variations.
Manatee saves all reads and clusters them per miRNA. These results may serve as the foundation for a down-
stream isomiR analysis.
Detection of novel unannotated expression loci. UARs mapping to loci lacking genomic features are organized
into read clusters based on their genomic positions. Manatee identifies clusters as genomic regions which contain
at least five reads and no gap longer than 50 nt between consecutive reads with the default parameters, which can
be altered by the user. The output of this step is a single file comprising the unannotated genomic loci and their
associated read counts.
Output. Manatee execution generates three, tab-separated count files (Transcripts, IsomiRs, Unannotated Loci)
that can be readily incorporated in downstream analysis pipelines, such as counts-based methods for differential
expression analyses (e.g. limma33, DESeq 234, or edgeR35). Apart from information regarding the quantified tran-
scripts (“Transcript ID”, “Biotype”, “Transcript Name”) and estimated non-normalized counts (“Count” column),
the files provide also other useful metrics, such as reads per million reads mapped on small RNAs (“RPM”) and
uniquely mapped reads (“Unique Reads”). If the reads could have been assigned to a different transcript with
equal probability, its ID is provided in the “Alternative Transcripts” column.
Scientific Reports | (2020) 10:705 | https://doi.org/10.1038/s41598-020-57495-9 8www.nature.com/scientificreports/ www.nature.com/scientificreports
Similarly, the isomiR results file provides detailed information about the identified expressed isomiRs and
comprises the “Transcript Name”, “Count”, and “RPM” columns. The isomiR-specific “Sequence” column
describes the genomic sequence of reads assigned to the identified isomiR.
The third output file describes in detail novel expressed unannotated loci and comprises the following col-
umns: “Chromosome”, “Strand”, “Start”, “End”, “Cluster Length”, and “Count”. The columns “Chromosome”,
“Strand”, “Start”, and “End” provide genomic location information of the unannotated clusters. “Cluster Length”
is the nucleotide length of the unannotated cluster and “Count” is the number of reads that were assigned to the
unannotated feature.
Simulated data. A simulated short read dataset (https://github.com/jehandzlik/Manatee/tree/simu-
latedData) was created using random sampling with a Monte Carlo inversion technique. Human annotation
was derived from Ensembl v85, GtRNAdb 2.0, and miRBase v21. Three randomly selected sRNA-Seq libraries
(Supplementary Table 2) obtained from GEO were also employed in the process. Samples were aligned against
GRCh38 human reference assembly after 3′-adapter sequences were removed using Cutadapt. Since processed
sRNA fragments/features are derived from their precursors by biogenesis/cleavage mechanisms that are distinct
to each biotype, simulated reads were designed to follow this rationale. Based on uniquely aligned reads observed
in the real data, probability mass functions (PMFs) were created for each biotype describing the read start posi-
tions. Nine different PMFs were created for the following RNA types: miRNA, tRNA, mt-tRNA, rRNA, mt-rRNA,
snRNA, snoRNA, lincRNA and processed transcript. Likewise, SNPs and read lengths for each sRNA type were
also estimated based on PMFs of UARs. More details on the creation process and the dataset characteristics are
available in the Supplementary File (Section “Simulated Reads Analysis” and Supplementary Figs. 3–5).
Data availability
The simulated data set is available at https://github.com/jehandzlik/Manatee/tree/simulatedData.
Code availability
Manatee code is available at the project home page: https://github.com/jehandzlik/Manatee.
Received: 21 June 2019; Accepted: 8 December 2019;
Published: xx xx xxxx
References
1. Martens-Uzunova, E. S., Olvedy, M. & Jenster, G. Beyond microRNA–novel RNAs derived from small non-coding RNA and their
implication in cancer. Cancer letters 340, 201–211 (2013).
2. Baek, D. et al. The impact of microRNAs on protein output. Nature 455, 64–71 (2008).
3. Vlachos, I. S. & Hatzigeorgiou, A. G. Online resources for miRNA analysis. Clinical biochemistry 46, 879–900 (2013).
4. Giza, D. E., Vasilescu, C. & Calin, G. A. Key principles of miRNA involvement in human diseases. Discoveries 2, e34 (2014).
5. Lee, Y. S., Shibata, Y., Malhotra, A. & Dutta, A. A novel class of small RNAs: tRNA-derived RNA fragments (tRFs). Genes &.
development 23, 2639–2649 (2009).
6. Langenberger, D., Bermudez-Santana, C.I., Stadler, P.F. & Hoffmann, S. Identification and classification of small RNAs in
transcriptome sequence data. Pacific Symposium on Biocomputing. Pacific Symposium on Biocomputing, 80–87 (2010).
7. Stepanov, G. A. et al. Regulatory role of small nucleolar RNAs in human diseases. BioMed research international 2015, 206849
(2015).
8. Keam, S. P. & Hutvagner, G. tRNA-Derived Fragments (tRFs): Emerging New Roles for an Ancient RNA in the Regulation of Gene
Expression. Life 5, 1638–1651 (2015).
9. McMahon, M., Contreras, A. & Ruggero, D. Small RNAs with big implications: new insights into H/ACA snoRNA function and
their role in human disease. Wiley interdisciplinary reviews. RNA 6, 173–189 (2015).
10. Fasold, M., Langenberger, D., Binder, H., Stadler, P. F. & Hoffmann, S. DARIO: a ncRNA detection and analysis tool for next-
generation sequencing experiments. Nucleic acids research 39, W112–117 (2011).
11. Bussotti, G., Notredame, C. & Enright, A. J. Detecting and comparing non-coding RNAs in the high-throughput era. International
journal of molecular sciences 14, 15423–15458 (2013).
12. Borchert, G. M. et al. Comprehensive analysis of microRNA genomic loci identifies pervasive repetitive-element origins. Mobile
genetic elements 1, 8–17 (2011).
13. Conesa, A. et al. A survey of best practices for RNA-seq data analysis. Genome biology 17, 13 (2016).
14. Anders, S., Pyl, P. T. & Huber, W. HTSeq–a Python framework to work with high-throughput sequencing data. Bioinformatics 31,
166–169 (2015).
15. Trapnell, C. et al. Transcript assembly and quantification by RNA-Seq reveals unannotated transcripts and isoform switching during
cell differentiation. Nature biotechnology 28, 511–515 (2010).
16. Li, B. & Dewey, C. N. RSEM: accurate transcript quantification from RNA-Seq data with or without a reference genome. BMC
bioinformatics 12, 323 (2011).
17. Langmead, B., Trapnell, C., Pop, M. & Salzberg, S. L. Ultrafast and memory-efficient alignment of short DNA sequences to the
human genome. Genome biology 10, R25 (2009).
18. Dobin, A. et al. STAR: ultrafast universal RNA-seq aligner. Bioinformatics 29, 15–21 (2013).
19. Schopman, N. C., Heynen, S., Haasnoot, J. & Berkhout, B. A miRNA-tRNA mix-up: tRNA origin of proposed miRNA. RNA biology
7, 573–576 (2010).
20. de Hoon, M. J. et al. Cross-mapping and the identification of editing sites in mature microRNAs in high-throughput sequencing
libraries. Genome research 20, 257–264 (2010).
21. Friedlander, M. R., Mackowiak, S. D., Li, N., Chen, W. & Rajewsky, N. miRDeep2 accurately identifies known and hundreds of novel
microRNA genes in seven animal clades. Nucleic acids research 40, 37–52 (2012).
22. Baras, A. S. et al. miRge - A Multiplexed Method of Processing Small RNA-Seq Data to Determine MicroRNA Entropy. PloS one 10,
e0143066 (2015).
23. Barturen, G. et al. sRNAbench: profiling of small RNAs and its sequence variants in single or multi-species high-throughput
experiments. Methods in Next Generation Sequencing 1 (2014).
24. Johnson, N. R., Yeoh, J. M., Coruh, C. & Axtell, M. J. Improved Placement of Multi-mapping Small RNAs. G3 6, 2103–2111 (2016).
Scientific Reports | (2020) 10:705 | https://doi.org/10.1038/s41598-020-57495-9 9www.nature.com/scientificreports/ www.nature.com/scientificreports
25. Edgar, R., Domrachev, M. & Lash, A. E. Gene Expression Omnibus: NCBI gene expression and hybridization array data repository.
Nucleic acids research 30, 207–210 (2002).
26. Faridani, O. R. et al. Single-cell sequencing of the small-RNA transcriptome. Nature biotechnology 34, 1264–1266 (2016).
27. Zerbino, D. R. et al. Ensembl 2018. Nucleic acids research 46, D754–D761 (2018).
28. Vlachos, I. S. et al. DIANA-mirExTra v2.0: Uncovering microRNAs and transcription factors with crucial roles in NGS expression
data. Nucleic acids research 44, W128–134 (2016).
29. Andrews S. A quality control tool for high throughput sequence data. Babraham Bioinformatics (2010).
30. Martin, M. Cutadapt removes adapter sequences from high-throughput sequencing reads. EMBnet.journal 17, 10–12 (2011).
31. Chan, P. P. & Lowe, T. M. GtRNAdb 2.0: an expanded database of transfer RNA genes identified in complete and draft genomes.
Nucleic acids research 44, D184–189 (2016).
32. Kozomara, A. & Griffiths-Jones, S. miRBase: annotating high confidence microRNAs using deep sequencing data. Nucleic acids
research 42, D68–73 (2014).
33. Ritchie, M. E. et al. limma powers differential expression analyses for RNA-sequencing and microarray studies. Nucleic acids research
43, e47–e47 (2015).
34. Love, M. I., Huber, W. & Anders, S. Moderated estimation of fold change and dispersion for RNA-seq data with DESeq2. Genome
biology 15, 550–550 (2014).
35. Robinson, M. D., McCarthy, D. J. & Smyth, G. K. edgeR: a Bioconductor package for differential expression analysis of digital gene
expression data. Bioinformatics (Oxford, England) 26, 139–140 (2010).
Acknowledgements
This work is supported by Project “ELIXIR-GR: The Greek Research Infrastructure for Data Management
and Analysis in Life Sciences” (MIS-5002780) which is implemented under the Action “Reinforcement of the
Research and Innovation Infrastructure” and the Operational Programme “Competitiveness, Entrepreneurship
and Innovation” (NSRF 2014–2020), and co-financed by Greece and the European Union (European Regional
Development Fund). It was also co-financed (Greece and European Social Fund-ESF) through the Operational
Programme “Human Resources Development, Education and Lifelong Learning” in the context of the project
“Strengthening Human Resources Research Potential via Doctorate Research” (MIS-5000432), implemented by
the State Scholarships Foundation (ΙΚΥ). I.S.V. was supported by the Harvard Medical School “George and Marie
Vergottis Fellowship”. We thank Artemis Fakorelli and Stephen Nelson for editing the manuscript.
Author contributions
J.E.H. designed the algorithm and performed further analysis. S.T. tested the algorithm and executed tool
comparison. I.S.V. and A.G.H. supervised the research. J.E.H., S.T., I.S.V. and A.G.H. wrote the manuscript. All
authors reviewed and approved the manuscript.
Competing interests
The authors declare no competing interests.
Additional information
Supplementary information is available for this paper at https://doi.org/10.1038/s41598-020-57495-9.
Correspondence and requests for materials should be addressed to A.G.H.
Reprints and permissions information is available at www.nature.com/reprints.
Publisher’s note Springer Nature remains neutral with regard to jurisdictional claims in published maps and
institutional affiliations.
Open Access This article is licensed under a Creative Commons Attribution 4.0 International
License, which permits use, sharing, adaptation, distribution and reproduction in any medium or
format, as long as you give appropriate credit to the original author(s) and the source, provide a link to the Cre-
ative Commons license, and indicate if changes were made. The images or other third party material in this
article are included in the article’s Creative Commons license, unless indicated otherwise in a credit line to the
material. If material is not included in the article’s Creative Commons license and your intended use is not per-
mitted by statutory regulation or exceeds the permitted use, you will need to obtain permission directly from the
copyright holder. To view a copy of this license, visit http://creativecommons.org/licenses/by/4.0/.
© The Author(s) 2020
Scientific Reports | (2020) 10:705 | https://doi.org/10.1038/s41598-020-57495-9 10You can also read