March 2022 - The Aga Khan University
←
→
Page content transcription
If your browser does not render page correctly, please read the page content below
March 2022
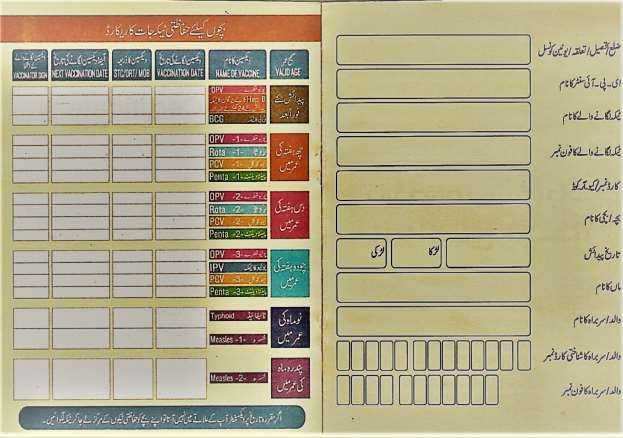
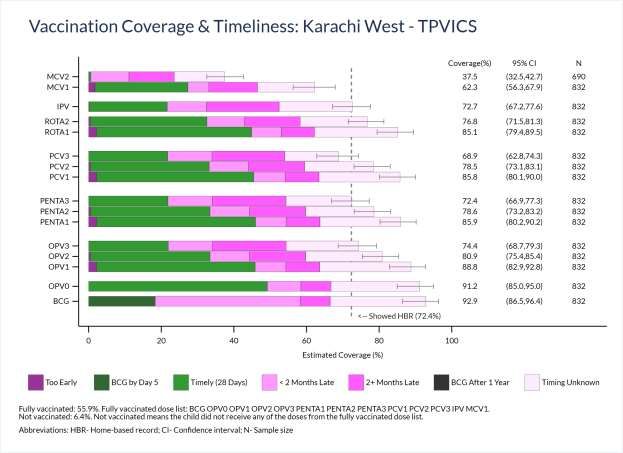
Table of Contents
List of figures and tables..................................................................................................................... ii
Abbreviations ................................................................................................................................... iv
Key definitions ................................................................................................................................... v
Executive summary .......................................................................................................................... vii
1. Background and objectives ............................................................................................................. 1
2. Survey design and methods ............................................................................................................ 3
 2.1. Sampling ............................................................................................................................................. 3
 2.2. Survey instrument development ......................................................................................................... 5
 2.3. Survey manuals and standard operating procedures (SOPs).............................................................. 5
 2.4. Approval processes ............................................................................................................................. 5
 2.5. Field teams for data collection and supervision ................................................................................. 6
 2.6. Training and fieldwork ........................................................................................................................ 7
 2.7. Pilot testing of survey instruments and protocol ................................................................................ 7
 2.8. Data collection and timeline ............................................................................................................... 8
 2.9. Data collection monitoring and quality control procedures ............................................................... 9
 2.10. Data processing and analysis ......................................................................................................... 10
3. Survey results............................................................................................................................... 14
 3.1. Survey coverage and household demographic characteristics ......................................................... 14
 3.1.1 Survey target and coverage ....................................................................................................... 14
 3.2. Vaccination home-based record (card) availability .......................................................................... 16
 3.2.1 Reasons for non-availability of vaccination cards...................................................................... 18
 3.3. Vaccination coverage and timeliness ............................................................................................... 20
 3.3.1. Areas for improvement in vaccination coverage and timeliness.............................................. 51
 3.4. Vaccination coverage status, by district, TPVICS & SHRUCs ............................................................. 52
 3.5 Drop-outs between vaccination visits ................................................................................................ 54
 3.6. Dose intervals.................................................................................................................................... 56
 3.7. Missed opportunities for simultaneous vaccination ......................................................................... 62
 3.8. Reasons for not vaccinating children ................................................................................................ 70
4. Discussion .................................................................................................................................... 72
References....................................................................................................................................... 74

 i
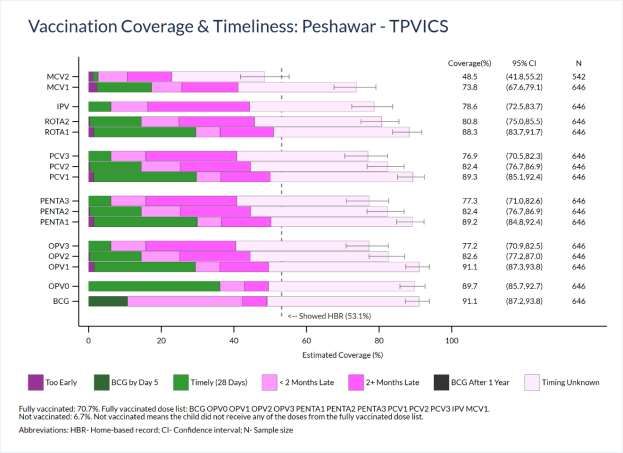
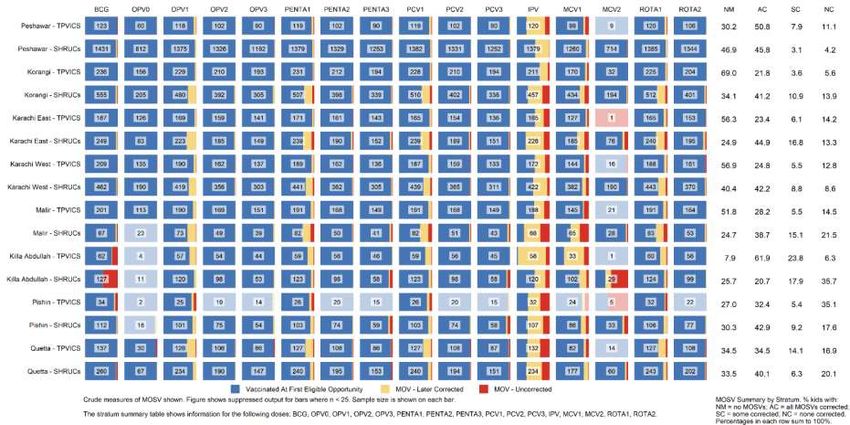
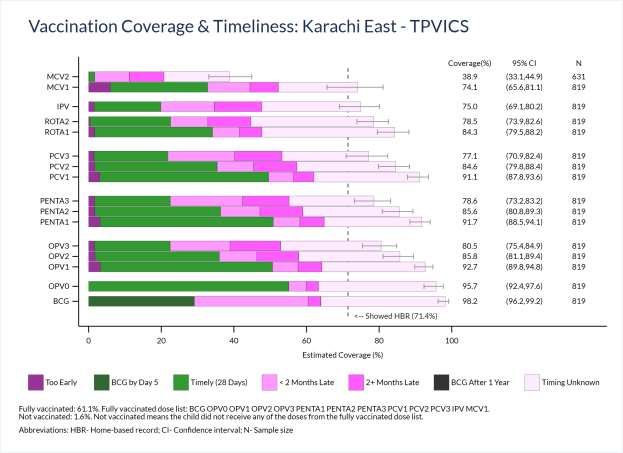
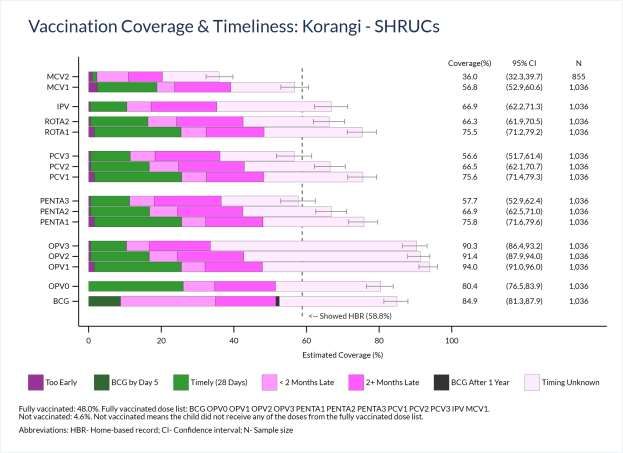
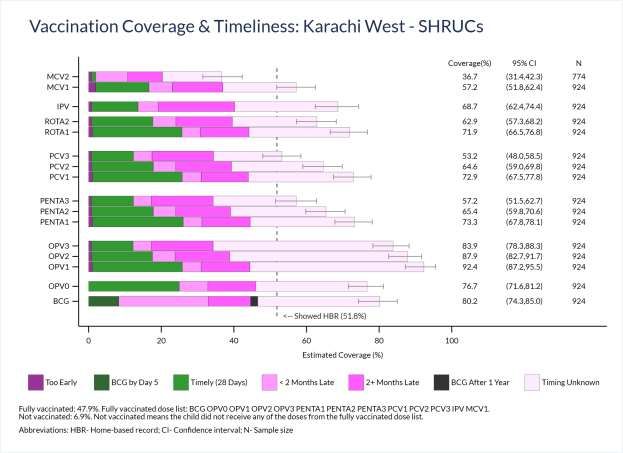
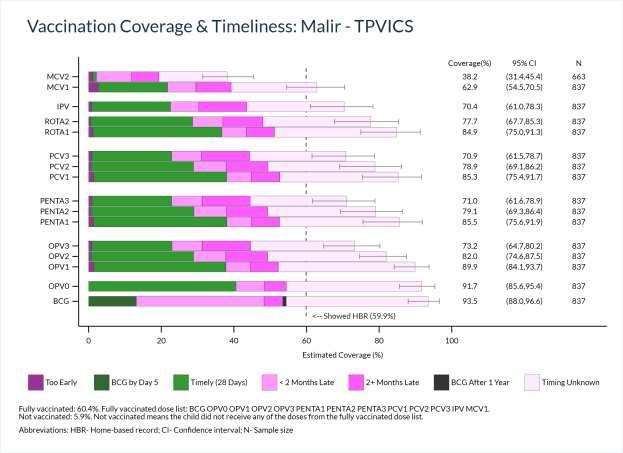
List of Figures

Figure 1 Proportion of children aged 12-23 months who ever had a card, TPVICS & SHRUCs 16
 Proportion of children aged 12-23 months whose card was seen by the survey interviewer,
Figure 2 18
 TPVICS & SHRUCs
Figure 3 Vaccination coverage among children aged 12-23 months, Peshawar District, TPVICS 21
Figure 4 Vaccination coverage among children aged 12-23 months, Peshawar District, SHRUCs 22
Figure 5 Vaccination coverage among children aged 12-23 months, Korangi District, TPVICS 25
Figure 6 Vaccination coverage among children aged 12-23 months, Korangi District, SHRUCs 26
Figure 7 Vaccination coverage among children aged 12-23 months, Karachi East District, TPVICS 29
Figure 8 Vaccination coverage among children aged 12-23 months, Karachi East District, SHRUCs 30
Figure 9 Vaccination coverage among children aged 12-23 months, Karachi West District, TPVICS 33
Figure 10 Vaccination coverage among children aged 12-23 months, Karachi West District, SHRUCs 34
Figure 11 Vaccination coverage among children aged 12-23 months, Malir District, TPVICS 37
Figure 12 Vaccination coverage among children aged 12-23 months, Malir District, SHRUCs 38
Figure 13 Vaccination coverage among children aged 12-23 months, Killa Abdullah District, TPVICS 41
Figure 14 Vaccination coverage among children aged 12-23 months, Killa Abdullah District, SHRUCs 42
Figure 15 Vaccination coverage among children aged 12-23 months, Pishin District, TPVICS 45
Figure 16 Vaccination coverage among children aged 12-23 months, Pishin District, SHRUCs 46
Figure 17 Vaccination coverage among children aged 12-23 months, Quetta District, TPVICS 49
Figure 18 Vaccination coverage among children aged 12-23 months, Quetta District, SHRUCs 50
 Vaccination coverage status among children aged 12-23 months, by district, TPVICS &
Figure 19 53
 SHRUCs
 Penta dose interval categories among children aged 12-23 months, by district, TPVICS &
Figure 20 57
 SHRUCs
 OPV dose interval categories among children aged 12-23 months, by district, TPVICS &
Figure 21 58
 SHRUCs
 PCV dose interval categories among children aged 12-23 months, by district, TPVICS &
Figure 22 59
 SHRUCs
 Rota dose interval categories among children aged 12-23 months, by district, TPVICS &
Figure 23 60
 SHRUCs
Figure 24 Percent of respondents with MOSVs 65
Figure 25 Respondents with MOSV for IPV 66
Figure 26 Sample of home-base record being used in Pakistan 66
Figure 27 Time to MOSV correction 68

 ii
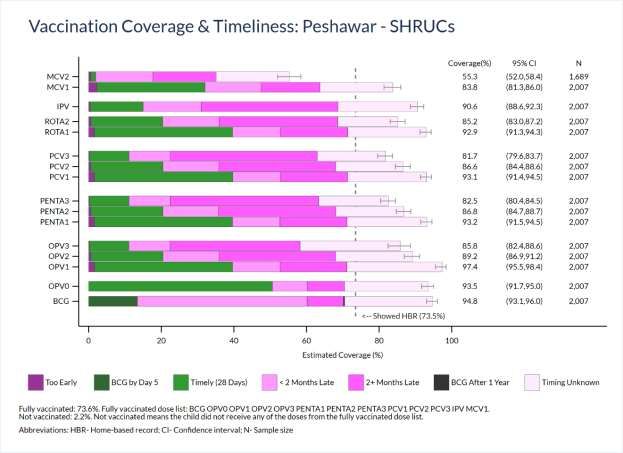
List of Tables

Table 1 Summary of survey design 3
Table 2 Number of PSUs per SHRUC by province and district 5
Table 3 Timelines for survey implementation 8
Table 4 Survey targets and coverage by district 14
Table 5 Demographic characteristics of target districts, TPVICS & SHRUCs survey 15
Table 6 Reasons for never having received a vaccination card, by district, TPVICS & SHRUCs 19
Table 7 Reasons for not showing a vaccination card, by district, SHRUCs 19
Table 8 Vaccination coverage bar segment lengths (%), Peshawar District, TPVICS 21
Table 9 Vaccination coverage bar segment lengths (%), Peshawar District, SHRUCs 22
Table 10 Vaccination coverage bar segment lengths (%), Korangi District, TPVICS 25
Table 11 Vaccination coverage bar segment lengths (%), Korangi District, SHRUCs 26
Table 12 Vaccination coverage bar segment lengths (%), Karachi East District, TPVICS 29
Table 13 Vaccination coverage bar segment lengths (%), Karachi East District, SHRUCs 30
Table 14 Vaccination coverage bar segment lengths (%), Karachi West District, TPVICS 33
Table 15 Vaccination coverage bar segment lengths (%), Karachi West District, SHRUCs 34
Table 16 Vaccination coverage bar segment lengths (%), Malir District, TPVICS 37
Table 17 Vaccination coverage bar segment lengths (%), Malir District, SHRUCs 38
Table 18 Vaccination coverage bar segment lengths (%), Killa Abdullah District, TPVICS 41
Table 19 Vaccination coverage bar segment lengths (%), Killa Abdullah District, SHRUCs 42
Table 20 Vaccination coverage bar segment lengths (%), Pishin District, TPVICS 45
Table 21 Vaccination coverage bar segment lengths (%), Pishin District, SHRUCs 46
Table 22 Vaccination coverage bar segment lengths (%), Quetta District, TPVICS 49
Table 23 Vaccination coverage bar segment lengths (%), Quetta District, SHRUCs 50
Table 24 Drop-out rates between dose pairs in target districts, TPVICS and SHRUCs 55
Table 25 Long intradose interval summary, TPVICS and SHRUCs 61
Table 26 Percent of visits with MOSVs 63
Table 27 Excess days unprotected: children with a corrected MOSV for IPV 67
Table 28 Excess days unprotected: children with an uncorrected MOSV for IPV 67
Table 29 Reasons children are not fully vaccinated, by district, TPVICS & SHRUCs 70

 iii
Abbreviations
AKU Aga Khan University
BCG Bacille Calmette-Guérin
BMGF Bill and Melinda Gates Foundation
CAPI Computer Assisted Personal Interviews
CES Coverage Evaluation Survey
CI Confidence Interval
cVDPV2 Circulating Vaccine-derived Poliovirus Type 2
DMU Data Management Unit
EB Enumeration Block
EPI Expanded Program on Immunization
ERC Ethical Review Committee
HH Household
IPV Inactivated Polio Vaccine
KP Khyber Pakhtunkhwa
MCV Measles-Containing-Vaccine
MDGs Millennium Development Goals
MoNHSRC Ministry of National Health Services Regulation & Coordination
MOSV Missed opportunities for simultaneous vaccination
NBC National Bioethics Committee
NEAP National Emergency Action Plan
NEOC National Emergency Operations Center
NISP National Immunization Support Project
NOCs No Objection Certificates
OPV Oral Polio Vaccine
PBS Pakistan Bureau of Statistics
PCV Pneumococcal Conjugate Vaccine
 Pentavalent vaccine to protect against: Diphtheria, Pertussis, Tetanus, Haemophilus influenza
PENTA
 type b & Hepatitis B
PEOC Provincial Emergency Operations Center
PSU Primary Sampling Unit
ROTA Rotavirus Vaccine
RV Rotavirus Vaccine
SHRUC Super High-Risk Union Council
SOP Standard Operating Procedure
SSU Secondary Sampling Unit
TAG Technical Advisory Group
TPVICS Third-party Verification Immunization Coverage Survey
ToR Terms of Reference
ToT Training of Trainers
UC Union Council
VPD Vaccine-preventable Diseases
VCQI Vaccination Coverage Quality Indicator
WB World Bank
WHO World Health Organization
WPV1 Wild Poliovirus Type 1

 iv
Key definitions

Fully Vaccinated: Fully vaccinated is defined as a child who has completed their vaccinations through
 the first dose of measles-containing-vaccine (MCV1; given at 9 months of age) per
 the schedule of the Expanded Program on Immunization (EPI; i.e., BCG, OPV0,
 OPV1, OPV2, OPV3, Penta1, Penta2, Penta3, PCV1, PCV2, PCV3, IPV, and MCV1 ).
 ROTA1 and ROTA2 are excluded from this analysis because they are the doses
 introduced into the EPI schedule most recently.

Partially A child who has received at least one, but also missed any of the vaccines given
Vaccinated:
 under the national immunization program until one year of age is classified as
 partially vaccinated [1].

Mother’s/Father’s The parental education level is classified into four categories: None (has not
Education Level:
 attended formal schooling), Primary education (1-5 years of formal education),
 Middle (6-8 years of formal education), Secondary (9-10 years of formal
 education), Higher (formal education of 11 years and above).

Literate: Those who have attended one or more years of formal education.
Formal Education: Formal education means schooling of one or more years at a public or a
 recognized private institution.

Household: A household is either one person living alone or a group of people, who may or
 may not be related, living at the same address, with common housekeeping, who
 either share at least one meal a day or share common living accommodations
 (i.e. a living room or sitting room) [2].

Wealth Quintiles: Households are divided into five equal categories (poorest, poor, middle, rich,
 and richest), each with 20% of the population, based on the number and kinds
 of consumer goods they own, ranging from a television to a bicycle or car, and
 housing characteristics such as source of drinking water, toilet facilities, and
 flooring materials [3,4].

 v
Suggested Citation
Center of Excellence in Women and Child Health, Aga Khan University, and Biostat Global Consulting,
Supplementary Immunization Coverage Survey in Super High-Risk Union Councils of Pakistan (TPVICS-
SHRUCs) Survey Report, March 2022.
Available at www.biostatglobal.com/downloads/TPVICS_SHRUCS_Survey_2021_Report.pdf
 or
 https://www.aku.edu/coe-wch/pk/Documents/TPVICS_SHRUCS_Survey_2021_Report.pdf

 vi

Executive summary
Vaccination programs are key to averting vaccine-preventable diseases. The Expanded Program on
Immunization (EPI) was launched in 1994 in Pakistan. Since that time, the Program has been delivering
services extensively to reduce the burden of vaccine-preventable disease in the country. To augment this
effort, Pakistan started its National Immunization Support Project (NISP) in 2016 to coordinate efforts for
vaccination and reduce vaccine-preventable diseases. Additionally, to address the recurring endemic
poliovirus in the country, the National and Provincial Emergency Operations Centers (NEOC and PEOCs)
for polio eradication identified 40 union councils as Super-High Risk Union Councils (SHRUCs) for targeted
interventions. The national EPI and the co-financing partners of NISP (the World Bank; the United States
Agency for International Development (USAID); Gavi, the Vaccine Alliance; and the Bill and Melinda Gates
Foundation) agreed to carry out a Union Council (UC)-specific vaccination survey in these SHRUCs.

To obtain more granular information on vaccine coverage and vaccination service delivery, a team from
Aga Khan University (AKU), supported by EPI Pakistan, implemented a supplementary vaccination
coverage survey. One of the key survey indicators was the assessment of full vaccination among children
ages 12-23 months in the target SHRUCs. For the purposes of the survey, a fully vaccinated child was a
child who had completed all of their vaccinations through Measles dose 1 (given at 9 months of age) per
the EPI schedule (i.e., BCG, OPV0, OPV1, OPV2, OPV3, Penta1, Penta2, Penta3, PCV1, PCV2, PCV3, IPV,
and MCV11). The team conducted the survey in 39 SHRUCs from eight districts in three provinces: eight
SHRUCs from four districts in Sindh, 17 SHRUCs from one district in Khyber Pakhtunkhwa (KP), and 14
SHRUCs from three districts in Balochistan. The timeframe for survey data collection was July 2021 to
October 2021.

Overall, 610 clusters, 7,549 households (HHs), and 6,976 children born between September 2018 and
January 2019 were enrolled in the survey. Of the children enrolled, 3,694 (53%) were male, while 3,282
(47%) were female.

The survey sample was allocated in a fashion to power for detecting change over the next few years not
at the union council level, but at the level of districts that hold SHRUCs. Results in this report are
aggregated up to the district level. SHRUCs survey results are portrayed beside the corresponding

1Rotavirus doses 1 and 2 are excluded from the analysis of fully-vaccinated children because they are the newest vaccine in the national schedule and may not have
been available when these children were scheduled to receive them.

 vii
outcome from the recent TPVICS survey, for context. Note that the SHRUCs constitute a subset of these
districts, so the SHRUCs results are not meant to represent the entire district.

Of the SHRUCs covered, those from district Peshawar recorded higher rates of vaccination coverage
indicators and the SHRUCs from the districts in Balochistan recorded comparatively low rates of home-
based record (HBR or vaccination card) availability and low rates for the vaccination indicators.

The proportion of respondents who showed HBRs and the proportion who were fully vaccinated tended
to be lower in the SHRUCs survey than in the TPVICS survey. Vaccination coverage of OPV doses tended
to be higher in SHRUCs than in the surrounding district as estimated in TPVICS. Coverage of all other
antigens tended to be (with a few exceptions) lower in the SHRUCs than in the district as a whole. The
proportion of unvaccinated, or zero-dose children in Balochistan SHRUC districts was much lower in the
SHRUCs than in the TPVICS survey, expressly because OPV coverage is much higher in the SHRUCs than in
the remainder of those districts.

Timeliness of vaccination in SHRUCs showed similar patterns as TPVICS, with a notable portion of children
with HBRs indicating that they received the EPI doses more than two months after the age when they
were scheduled. And a larger portion of respondents receives the later doses more than two months late
than the early doses. There is room for improvement in the timeliness of vaccination in the SHRUCs and
in these districts as a whole.

Encouragingly, the EPI doses are given in most cases in the groupings reflected in the national
immunization schedule, with most children who showed HBRs showing evidence of receiving most doses
at the first vaccination visit when they were eligible for the dose. Missed opportunities for simultaneous
vaccination (MOSVs) were rare for most doses. For three-dose antigens, MOSVs were more common for
the first dose than the later two doses, and most of the MOSVs were corrected when the child received
the dose at a later visit. IPV showed a noticeably high rate of MOSVs and a concerningly high proportion
of those MOSVs had not been corrected by the time of the survey. IPV is scheduled to be delivered at age
14 weeks with OPV3, Penta3, and PCV3. Because of poor timeliness and delayed vaccination visits, many
children with HBRs show evidence of receiving their ten-week doses (OPV2, Penta2, PCV2 and Rota2) after
age 14 weeks. Some even receive the six-week doses, OPV1, Penta1, PCV1 and Rota1 after age 14 weeks.
If the child is 14 weeks old, they could also receive IPV with those 6- or 10-week doses, but that is not the
practice, so the child experiences a MOSV for IPV and spends more time under-protected against polio
than would be the case if every child received IPV at the earliest visit after age 14 weeks.

 viii
The consistently high delivery of OPV in the SHRUCs is commendable. Some work is warranted to increase
OPV coverage elsewhere in those districts up to the SHRUC levels. Work inside the SHRUCs is warranted
to bring the delivery of other doses up to the level of OPV and to deliver doses in a more timely fashion –
as near as possible to the ages in the national immunization schedule, to minimize the time children spend
under-protected. The EPI staff are doing a good job administering all the doses that are scheduled to be
delivered together. In cases where the 6-week or 10-week doses are given to children who are 14 or more
weeks old, it may be worthwhile to consider guidance to also deliver the IPV dose at that time.

 ix
1. Background and objectives
Pakistan has posted substantial progress in curtailing the transmission of poliovirus in the recent past.
Efforts including the National Emergency Action Plan (NEAP) for Polio Eradication resulted in a significant
reduction in polio incidence. The country recorded an all-time low number of polio cases, eight cases in
2017 and 12 cases in 2018 [5], after witnessing an outbreak in 2014 when 304 polio cases were recorded
[6]. Despite continuous efforts, the persistence of polio in Pakistan poses a significant challenge for global
eradication, as the country is affected by ongoing endemic Wild Poliovirus type 1 (WPV1) transmission
and circulating vaccine-derived poliovirus type 2 (cVDPV2) [7]. In 2020, a total of 84 WPV1 and 135 cVDPV2
cases were reported in the country [5]. With these recurring incidences, Pakistan is still one of the two
polio-endemic countries in the world, a position it holds alongside neighboring Afghanistan [8].

The National and Provincial Emergency Operations Centers (NEOC and PEOCs) for polio eradication have
identified 40 union councils in the country as Super-High Risk Union Councils (SHRUCs) because they are
significant poliovirus reservoirs [9]. There are 8 UCs from Sindh, 18 from KP, and 14 UCs from Balochistan.
Together, these areas have an estimated population of around 3 million, including 574,000 children under
five years of age [9].

Though Pakistan has made considerable progress, vaccination indicators have yet to reach the expected
benchmarks. The key goals of polio and measles eradication have not been achieved [10], and the country
continues to experience endemic polio transmission and periodic measles outbreaks and all districts
remain vulnerable. A variety of factors are responsible for failing to reach all children with sufficient doses
of vaccines, including weak governance and accountability mechanisms [11]. Further, the lack of quality
data collection and management [12] have impeded the assessment of EPI performance in the country.

AKU with the support of EPI Pakistan conducted a district-specific Third-party Verification Immunization
Coverage Survey (TPVICS)2 from September 2020 to January 2021. The survey was meant to assess the
progress of four out of the ten DLIs under the NISP. TPVICS covered all four provinces i.e. Sindh, Punjab,
Khyber Pakhtunkhwa (KP), Balochistan and three federal regions i.e. Islamabad, Azad Jammu and Kashmir
(AJK) and Gilgit-Baltistan (GB). After reviewing the results of the TPVICS, the National Immunization

2
 https://www.aku.edu/coe-wch/Documents/TPVICS%20Survey%20Report.pdf

 1|Page
Program Pakistan, and the key partners supporting NISP, enlisted AKU to conduct a supplementary survey
targeting 39 out of the 40 SHRUCs3. The three objectives of this supplementary survey were:

 • To assess vaccination coverage precisely in the target SHRUCs.
 • To compare coverage in SHRUCs with coverage in the districts that contain the SHRUC, as
 estimated in the 2021 TPVICS survey (hereafter simply called TPVICS).
 • To create a baseline for the SHRUCs to assess the impact of interventions over time.

3One HRUC in Peshawar located in the Cantonment area has been dropped from the scope of survey, as the Cantonment areas do not allow private organizations
to carry out such surveys due to security concerns.

 2|Page
2. Survey design and methods
This section describes the survey sampling methods, development of the survey instrument, manuals, and
standard operating procedures (SOPs), along with approval processes, hiring of field teams for data
collection and supervision, and training and fieldwork. Furthermore, pilot testing of the survey
instruments and protocol, and the data collection process and timeline are also discussed in this section.

2.1. Sampling

The team employed a two-stage, stratified cluster, cross-sectional survey. Additional details about the
survey and sampling design are provided in table 1.
Table 1. Summary of survey design
Survey design Two-stage stratified cluster, cross-sectional survey
 • The primary target group was all children of age 12-23 months. Data were also collected on
 the convenience sample of younger children aged 6-11 months in the households that had
Target age group
 children aged 12-23 months. It is not common for a couple to have two children born in a span
 of 18 months, so the sample of younger children is comparatively small.

 • Samples from all Primary Sampling Units (PSUs) (also known as clusters) were aggregated at
Unit/domain of the UC level and analysis was conducted on UCs and then on upper administrative levels i.e.
analysis (strata)
 District level.

 Maps developed and finalized during the provincial workshops organized by BMGF for the
Sampling design operationalization of Essential Immunization (EI) work plans in SHRUCs were used for
and strategy
 demarcation and selection of sample areas and clusters.

 A two-stage cluster sampling technique was adopted for the implementation of the
 supplementary TPVICS.
 • Stage I: The required number of the PSUs from each SHRUC were selected randomly with
 necessary identification information and boundary demarcations using the maps developed
 by BMGF for SHRUCs.
Selection of primary
sampling units, • Stage II: All households in each selected PSU were visited to screen for the presence of
households, and children of age 12-23 months. Households with children in that age range were treated as
respondents
 Secondary Sampling Units (SSUs). In every PSU, 13 households with eligible children were
 selected using systematic random sampling. Those households were visited to collect data for
 the survey.
 • Stage III: Vaccination status data were collected for all children aged 12-23 months, and all
 children aged 6-11 months in the selected households.

 3|Page
2.1.1 Selection of primary sampling units:

To demarcate and select sample areas/clusters, the survey team used the maps developed and finalized
during the provincial workshops organized by BMGF for the operationalization of essential vaccination
work plans in SHRUCs. A total of 2,447 clusters containing 100 to 150 households were demarcated in all
39 SHRUCs. Of the demarcated clusters, 612 PSUs were selected randomly by the team from Biostat
Global Consulting from the 39 SHRUCs.

2.1.2 Sample size calculation and estimated vaccination coverage

The sample size estimates were finalized after a series of meetings with key technical stockholders. WHO
2018 Vaccination Coverage Surveys Reference Manual was also consulted for sample size estimation[16].

The inferential goal is to have 80% statistical power to detect a 15% improvement in coverage outcomes
in the SHRUCS within each district comparing outcomes in two surveys: this one conducted in 2021 and
another comparable survey envisioned for perhaps two years later. The WHO 2018 manual’s Table B-4
indicates that an effective sample size of 183 respondents per district should yield 80% power with 95%
confidence. Table 2 lists the number of SHRUCs per district and the target number of PSUs per SHRUC.
With 90 PSUs per district and a target of at least ten eligible respondents per cluster, the achieved sample
size will be over 900 children, so the inferential goal should be achievable even if the observed design
effect is as high as four or five. Recall that the effective sample size is the actual sample size divided by
the design effect; 915 / 5 = 183. To be quite likely of finding at least ten respondents aged 12-23 months
per cluster, the team targeted visiting 13 households per cluster.

Following cluster selection, trained listing teams visited each cluster. Cluster boundaries were identified
using cluster maps and local guides/knowledgeable persons. The teams visited all structures and dwellings
in the cluster and identified households with children aged 12-23 months. To further increase the
probability of achieving the target sample size, a central team at the district level randomly selected 13
households in each cluster that were known to hold at least one child aged 12-23 months. A total of 7,956
households were targeted for visitation by survey interview teams.

 4|Page
Table 2. Number of PSUs per SHRUC by province and district
 Province District Number of SHRUCs PSUs per SHRUC
 Karachi East 1 45a
 Sindh Karachi West 5 18
 Malir 2 37b & 45
 Quetta 6 15
 Balochistan Killa Abdullah 5 18
 Pishin 3 15c
 KP Peshawar 17 10d
 a It was considered that the design effect in Karachi East would probably be small enough for 45 PSUs to yield an effective sample size of 183.
 b Fewer than 45 PSUs were selected in one SHRUC due to a small number of PSUs there.
 c Due to small numbers of PSUs
 d Ten PSUs may be too small to characterize the heterogeneity of coverage across a SHRUC; the WHO 2018 reference manual recommends a minimum of 15 PSUs

 per stratum, but to strike a balance between precision and budget, a maximum of 170 PSUs were allocated to Peshawar district. More emphasis should be placed
 on estimates combined across SHRUCs in Peshawar than on outcomes in individual SHRUCs.

2.2. Survey instrument development

This survey used the same tools developed and employed to implement the primary TPVICS conducted
previously. Three sets of questionnaires were used in the survey: 1) a household line listing questionnaire
to collect household information about key demographic indicators to generate a sampling frame for the
selection of target households; 2) a household questionnaire which was used to collect basic demographic
information on all de jure household members (usual residents), the household, and the dwelling; and 3)
a questionnaire for eligible children to assess vaccination coverage in each targeted household.
Questionnaires were adopted from the WHO Vaccination Coverage Cluster Surveys Reference Manual
2018 [16] and modified in accordance with the objectives of the survey. To ensure that question meaning
was consistent in both English and the local language (Urdu), questionnaires were translated into Urdu
and translated back to English.

2.3. Survey manuals and standard operating procedures (SOPs)
This survey used the SOPs for data collection and manuals developed to conduct the TPVICS line listing
and household survey.

2.4. Approval processes
The AKU team prepared and submitted applications to the National Bioethics Committee (NBC) and AKU
Ethical Review Committee (ERC) for approval to implement proposed survey activities in target areas of
Pakistan. Both committees approved the survey activities.

No objection certificates (NOCs) and approvals were obtained from the provincial authorities with the
support of provincial program leadership. The National EPI Program Manager and Ministry of National
Health Services Regulation & Coordination (MoNHSRC), Islamabad issued the support letters to respective

 5|Page
provincial authorities for their support and facilitation of supplementary TPVICS activities. Following that
each province granted NOCs and approvals to carry out the survey operations.

2.5. Field teams for data collection and supervision

All field team staff hired for the project had the requisite qualifications, including field-based data
collection experience, fluency in the local language, and willingness to travel. District-specific networks
were used to identify experienced data collectors and supervisors who had worked with AKU in past.
Preference was given to candidates who were locals, were well versed with local languages and culture,
had the experience of working in similar large-scale surveys, and could operate handheld data collection
devices.

The hiring of the survey implementation team was initiated in two phases. In phase one, the core team
including data supervisors, programmers, master trainers, district supervisors, and provincial managers
were hired. In phase two, a district-specific team responsible for data collection and line listing was hired.
In each district, three teams were hired for the household survey. Each team consisted of one team leader,
two data collectors (one male, one female), and one data entry operator/logistics assistant.

Provincial managers were responsible for district-specific hiring with the support of district supervisors.
They were also responsible for conducting quality checks by revisiting a portion of randomly selected
households already surveyed to verify that the household listing and interviews were conducted properly,
that all eligible respondents in those households completed questionnaires, and that vaccination dates
(and possibly other responses) were recorded correctly in HHs where cards were available.

District supervisors were responsible for coordination with the provincial managers for day-to-day
progress and plans. District supervisors reported daily to the provincial managers.

Team leaders were responsible for day-to-day supervision, monitoring, coordination, and providing
logistical support to the team. Team leaders were also responsible for revisiting a set of households to
ensure data accuracy.

Data collectors were responsible for visiting sampled/selected households for interviews and completing
the filling of forms. Also, the data collectors were responsible for checking the completed forms and,
where required, revisited the households to correct any discrepancies or obtain missing information.

The data entry operator (DEO) was responsible for data entry when data collectors were not able to

 6|Page
directly enter the data on handheld devices due to the reluctance of respondents or other issues. In cases
where data collectors gathered data on paper-based forms, the DEOs were responsible for data entry on
the same day with the support of the corresponding data collector.

For the line listing/mapping of households, three teams were hired in each district, with each team
consisting of three-line listers. The supervisors in their respective jurisdiction did the identification of the
boundaries of the clusters a day before HH line listing. The line listers did the household listing and
completed the household listing questionnaires. The three teams of line listers (nine in total) were able to
cover all selected PSUs in a district in four weeks. District supervisors oversaw the household listing teams
to ensure the household listing had been done correctly and tallied eligible respondents in each home.
Line listers also accompanied the data collection teams to assist and guide them in the identification of
areas and target households.

2.6. Training and fieldwork

Team leaders, data collectors, and line listers were trained using the survey questionnaires on handheld
devices and were encouraged to give comments and suggestions to improve the clarity of the data
collection instruments. An important additional benefit of this exercise was to provide an environment
where the data collectors understood the deliverable and the reasons behind each question. This exercise
also enabled field staff to probe more effectively while conducting the interviews in the field. On the last
day of the training, teams were sent to a nearby location and the questionnaire was tested in the field.
This exercise ensured field staff comprehension of the survey questionnaires and field protocols. A
feedback session with the data collectors was also conducted to address their comments and issues. To
measure the impact of training on the knowledge and skills of participants, pre and post-tests were
conducted. Capable data collectors who passed the final test were deployed for the actual survey. In
addition, each data collector was observed during the data collection process to assess their performance,
and feedback was provided accordingly.

2.7. Pilot testing of survey instruments and protocol

The survey instruments were pilot tested for during TPVICS. Approximately 1,000 interviews were
conducted in different locations of Pakistan in households with eligible children to identify potential
problems with the survey instruments and protocol. The final version of the questionnaires was shared
with the representatives of key project stakeholders for their review and feedback and was shared with
members of the Technical Committee for their review and endorsement.

 7|Page
Before starting survey field activities, the team conducted a pilot survey in 20 different locations of the
country. This exercise was done only in non-targeted PSUs. All steps of the survey data collection and
quality analysis protocol were conducted, and revisions were made based on the lessons learned.

2.8. Data collection and timeline

Data collection of the supplementary TPVICS was implemented in two stages in each district. In the first
stage, household line listing was conducted in the selected PSUs. The household listing was used to select
13 eligible households for the survey to target in each PSU.

Stage two was dedicated to the collection of information on household socio-economic status and
information about routine vaccination of children 12-23 months of age from the 13 sampled households in
each PSU. Two custom-made data collection applications were designed using native Java language for the
interface/front end with SQL Lite running at the backend. The data collection applications were Android
compatible. The data stored in the handheld devices were transmitted to the AKU data centre using the
internet. At the AKU data centre, a dedicated database hosted on a Microsoft SQL Server was used to
store and retrieve the data received from the handheld devices. For error checking, cleaning, data analysis,
and final storage, data were transferred into Stata version 16.1 [17]. Data backups were conducted in
accordance with the shared Data Management Unit ( DMU) Data Back-up SOP.

During the data collection process, Pakistan faced a fourth wave of COVID-19. AKU staff continued to
conduct field activities during this period and adhered to guidelines for reducing risk and exposure to
COVID-19. Field activities, including identifying travel routes to and from field locations, were developed
to either circumvent the areas of high COVID risk or minimize encounters with the public and local
authorities while in the area. All field staff were trained on the precautionary methods to avoid COVID
and necessary personal protective equipment (PPE) such as gloves, masks, and sanitizers were provided to
the entire field staff. The timeline for survey implementation is summarized in table 3.

Table 3. Timelines for survey implementation
 Districts Start date of HH data collection End date of HH data collection
 Peshawar 5 July 2021 24 August 2021
 Korangi 7 July 2021 20 August 2021
 Karachi West 10 July 2021 3 August 2021
 Karachi East 25 August 2021 27 August 2021
 Malir 30 August 2021 31 August 2021
 Killa Abdullah 20 September 2021 20 October 2021
 Quetta 13 July 2021 8 September 2021
 Pishin 10 August 2021 26 August 2021

 8|Page
2.9. Data collection monitoring and quality control procedures

A dedicated “TPVICS dashboard” was also developed on the PHP programming language. The PHP version
used in this dashboard was 8.1.2. The “CodeIgniter” framework was used for backend, and the HTML, CSS,
JQUERY, Bootstrap were used for front-end development. The database used in this dashboard was “SQL
Server”.

TPVICS dashboard provided live information on the progress of data collection activities and offered other
features including facility for the survey managers to carry out randomization of the households, access
soft copy or print the list of randomized households for each PSU. The access of dashboard was also
provided to key partners to check the day to day progress of the field activities.

There were four main user roles for dashboard, which were “Super Admin”, “Admin”, “Supervisor”, and
“User”.

 • The Super Admin group had all the rights of dashboard, including adding, editing, and deleting. It
 is mostly for Senior Managers, PI, etc.
 • The admin group had also almost all rights. They were mostly DMU staff, and coordinators.
 • Supervisors had limited rights only to add or edit the data but not the right to delete the data.
 They were site staff supervisors.
 • The user group had very limited rights. They could only view the data of their respective PSU.

Survey activities were regularly and rigorously monitored through the dashboard and in-field by the
supervisors/managers. The district-level data collection was supervised by the district supervisors and
monitored by the provincial manager, who was specially trained to supervise this task. All filled-in data
was checked by the team leader/supervisor for completeness before leaving the field. After completing
their work, they returned to the office and checked their collected data on the dashboard. The team leader
checked the entire filled questionnaires for completeness, accuracy, and vaccination card visibility. The
regional manager and district supervisors were responsible for reviewing vaccination cards on the
dashboard to ensure the quality of data transcription by data collectors. The district supervisors were also
responsible for timely syncing of line listing data and acquisition of randomization sheets as well as syncing
of the household data along with the vaccination cards.

The following steps were ensured during monitoring and quality control in the field:

• Each data collector was expected to submit/sync only completed and accurate questionnaires. Every
 day, the supervisor checked data for completeness and timely syncing. The supervisor checked the
 household list indicating that questionnaires had been completed for all eligible children, and if not,

 9|Page
the reasons for missing questionnaires were recorded (for example, caretaker not available after two
 visits or refused to participate). All forms were checked and corrected before leaving the cluster area
 and syncing data. The district supervisor/team leader gave feedback immediately to interviewers. Any
 discrepancy or missing data was resolved through discussions with the interviewers, a review of
 photographs of the vaccination card (if available), or revisits to households if necessary.

• To ensure the quality of the data collected, the team leader/district supervisor validated household
 listing activities to check that the household lists had been done correctly, cluster or segment
 boundaries were correctly identified, and that field workers did not skip (either intentionally or by
 mistake) interviews for eligible children, and to tally eligible respondents in each home. The selection
 of clusters was based on data indicators related to the number of listed households and eligible
 children. Clusters with a smaller number of reported households and eligible children than expected
 were selected for validation.

• A dedicated quality control associate at the data management unit reviewed pictures of vaccination
 cards taken by survey teams and compared them with the data entered from the card to validate the
 quality of data transcription by data collectors. This exercise was very helpful for notifying teams
 about possible errors in a timely fashion.

2.10. Data processing and analysis

2.10.1 Data cleaning
In addition to human-initiated review in the field, an automated data quality script was run regularly to
evaluate relationships between vaccination dates, the child’s date of birth, and the date of the interview.
Discrepancies were identified and initiated another round of review of the photos of children’s home-
based records. 952 cards were corrected. In some cases, logical discrepancies remained because they
accurately reflect what was recorded on the home-based record. Those discrepancies were handled
downstream in the WHO Vaccination Coverage Quality Indicator (VCQI) software, described below.

Every home-based record was reviewed at least twice, once by the primary data collector in the home
and a second time by their supervisor using the dashboard. All records that contained logical discrepancies
were reviewed a third time using the dashboard.

 10 | P a g e
2.10.2 Weighting

Survey weights were calculated in accordance with Annex J of the 2018 WHO Vaccination Coverage
Cluster Survey Reference Manual [16]. Base weights were calculated as the inverse probability of
respondent selection:

 1
 =
 1 2 3 4

Where:

 • P1 is the probability the PSU was selected = number of PSUs selected in the UC / total number of
 PSUs in the UC
 • P2 is the probability the household has at least one child aged 12-23 months = # of HH found to
 hold a child 12-23m / # of HHs listed
 • P3 is the probability of selecting a specific HH = Number of HH selected (usually 13) / Number of
 HH found to hold at least one child age 12-23 months
 • P4 is the probability of selecting an eligible child in the household = 100% (because the teams
 collected data on all eligible children)
The base weights were inflated to represent a contribution for a small number of PSUs that contained
only commercial buildings and a small number of households where residents were not at home when
visited.

 # ℎ
 1 =
 # ℎ ℎ

 # ℎ
 2 = 1
 # ℎ ℎ ℎ

Because data are to be combined across UCs to estimate SHRUC coverage at the district level, the weights
were post-stratified so the sum of weights in each UC would be proportional to the estimated population
of eligible children there. Administrative estimates of the population of children under 5 years of age in
each SHRUC were obtained from the BMGF polio program. The number of children aged 12-23 months
was assumed to be proportional to the number of children under 5 years of age, so the post-stratified
weights were calculated thus:

 ( 5 ℎ ⁄5)
 1 = 2
 2 ℎ 12 23 ℎ ℎ

 11 | P a g e
The values of PsWt1 may be used to estimate the number of children aged 12-23 months in the UCs and
to estimate the number of those children who received the various vaccine doses. The values are less
programmatically meaningful for the younger siblings aged 6-11 months in this dataset. Their relative
values are meaningful, representing the probability of household selection, but their absolute values do
not correspond to anything that should be interpreted as a count of children aged 6-11 months in the UCs.

The weights for children aged 12-23 months were rescaled in a final step so the overall sum of weights is
equal to the number of children in the survey sample.

 ℎ 12 − 23
 2 = 1
 1 ℎ 12 − 23
The values of PsWt2 were used in the analysis of vaccination coverage among children aged 12-23 months.
Identical estimated proportions (coverage results) would be obtained if the analysis used PsWt1. A similar
set of weights were calculated for children aged 6-11 months.

2.10.3 Data analysis – pre-processing

The survey dataset was designed to provide estimates of key indicators at UC level. Analyses were
performed after data cleaning and satisfactory quality assurance. The SHRUC data were combined with
TPVICS data from the SHRUC districts and analyzed in a way to show TPVICS district results alongside
results from the SHRUCS within those districts. Vaccination coverage and its associated indicators were
calculated using the freely available software known as Vaccination Coverage Quality Indicators (VCQI)
[18]. VCQI analyses were conducted using Stata version 17 [17]. The primary analysis examined coverage
for children aged 12-23 months to compare directly with TPVICS.

VCQI employs its own data cleaning process that makes edits to the data. Vaccination evidence can take
the form of date from an HBR, a tick mark from an HBR (indicating that there was a pen or pencil mark or
signature to indicate that the child received the dose, but no date, or that the date was illegible), or yes/no
caregiver recollection concerning whether the child received for each dose. In several well-defined
circumstances, VCQI converts a date to a tick mark before estimating coverage indicators. Dates are
converted to a simple yes/no tick marks under these conditions:

 • If the date is only partially specified

 • If the date is nonsensical (e.g., Feb 30 or Sep 31)

 • If the date falls outside the possible period for eligible respondents (in this case, dates of birth

 12 | P a g e
should fall between 12 and 24 months before the survey interview and dates of vaccination should
 fall between the child’s date of birth and the date of the survey interview)

 • If doses in a series have dates that are equal (e.g., Penta1 date is the same as Penta2)

 • If doses in a series have dates that are out of order (e.g., Penta2 date is before Penta1)

2.10.4 Data analysis – indicators

After the data are cleaned in that manner, coverage indicators are calculated. Indicators reported here
include:

 • Card availability - proportion of children for whom a home-based record (HBR or vaccination card)
 was seen.

 • Crude coverage – What proportion of children had any evidence of receiving the dose, either via
 the home-based record (HBR) or via the recollections of the child’s caregiver?

 • Drop-out – What portion of children who began a dose series, did not complete the series?

Date-based analyses – For children with vaccination dates on HBRs, several other indicators may be
calculated.
 • Timeliness – What portion of children have documented evidence of receiving the dose too early?
 Within 28 days of the appropriate age? 1-2 months late? Or more than two months late?
 • Dose interval assessment – What portion of dose pairs in a series is given with an interval that is
 < 28 days? An interval of 28-56 days? What portion of intervals exceeds 56 days?
 Missed opportunities for simultaneous vaccination (MOSVs) – An MOSV occurs when a child receives
 one or more doses on a particular day but does not receive all the doses that s/he was eligible for.
 • Visits with MOSVs – What portion of vaccination visits include one or more MOSVs?

 • Children with MOSVs – What portion of children experience one or more MOSVs? Overall? By
 dose?

 o Corrected MOSVs – What portion of those doses that were missed at the first eligible
 visit were received at a later visit? What portion of MOSVs were still uncorrected at
 the time of the survey?
 o Time-to-MOSV correction – Among children who missed a dose at their first eligible
 visit and received it later, what was the median time to correction, in days?

 13 | P a g e
3. Survey results
The survey results are presented in eight sections. Section 3.1 presents findings related to survey
coverage, and household demographic characteristics for each district. Section 3.2 provides survey
findings regarding vaccination card availability and reasons associated with the non-availability of
vaccination cards. Section 3.3 presents findings regarding vaccination coverage and timeliness among
children ages 12-23 months; Section 3.4 describes antigen coverage status in districts and SHRUCs; Section
3.5 presents drop-outs between vaccination visits; Section 3.6 reports results on dose intervals, and
Section 3.7 presents findings related to MOSV, and Section 3.8 reflects on reasons associated with not
vaccinating the children.

3.1. Survey coverage and household demographic characteristics

The survey targets and demographic characteristics of the target districts are presented in this section.
3.1.1 Survey target and coverage

The survey covered a total number of 610 clusters from 39 target SHRUCs spreading over eight districts.
Seventeen SHRUCs were located in district Peshawar in KP, eight SHRUCs in four districts in Sindh, and
fourteen SHRUCs in three districts of Balochistan. In total, interviews were completed at 7,549 HHs in the
SHRUCs against the target of 7,956: a 99.3% response rate. The household response rate was 100% in the
SHRUCs in districts Killa Abdullah and Quetta in Balochistan and in the SHRUCs in four districts of Sindh. In
Peshawar, the response rate was 99.8%, and in Pishin, where two PSUs in strictly commercial districts
were dropped, the response rate was 92%. District-wise survey targets, coverage, and number of SHRUCs
are summarized in table 4.

Table 4. Survey targets and coverage by district
 Number Clusters Households
 Districts of Response
 Sampled Randomized Surveyed Target Randomized Completed
 SHRUCs rate
 Overall 39 612 610 610 7,956 7,904 7,549 99.3%
 Peshawar 17 170 170 170 2,210 2,205 2,049 99.8%
 Korangi 2 82 82 82 1,066 1,066 1,066 100%
 Karachi East 1 45 45 45 585 585 585 100%
 Karachi West 4 72 72 72 936 936 935 100%
 Malir 1 18 18 18 234 234 234 100%
 Killa Abdullah 5 90 90 90 1,170 1,170 1,163 100%
 Pishin 3 45 43 43 585 538 466 92%*
 Quetta 6 90 90 90 1,170 1,170 1,051 100%
* Two PSUs in Pishin were dropped because they were commercial neighborhoods with no residents .

 14 | P a g e
3.1.2 Demographic characteristics of target districts

Overall, the survey covered 6,976 children ages 12 to 23 months from the 8 districts of the target SHRUCs.
Of the children covered, 53.0% were male and 47.0% were female. In all districts, there were more male
children in the sample than females.

Concerning parental education in the districts, the survey found the highest literacy4 rate among mothers
of eligible children in SHRUCs district Korangi (44.7%). It was followed by districts Karachi West (39.1%),
Peshawar (32.7%), Malir (30.2%), and Karachi East (21.3%). In the districts of Balochistan, the literacy of
mothers of eligible children was relatively low: 9.2% in district Quetta, 11.0% in Pishin and only 1.6% in
Killa Abdullah. (Table 5)

Regarding the education level of the fathers of eligible children , the survey found that more than 50% of
fathers were literate in two districts: Peshawar, and Korangi. For districts Karachi West, Malir, Karachi East,
Quetta, and Pishin, the paternal literacy rates were 48.5%, 30.2%, 27%, 22.1%, and 20.4% respectively.
District Killa Abdullah recorded the lowest percentage at 1.7%. Overall, parental education level was low
in the target districts of Balochistan. (Table 5)

Table 5. Demographic characteristics of target districts, TPVICS & SHRUCs survey
 Education
 Children 12-23 months
 (% literate)
 Districts
 TPVICS (N)=6,267 Age in months % male
 Mothers Fathers
 SHRUC (N)= 6,976 (mean ± sd) children
 Khyber Pakhtunkhwa – Peshawar –
 646 17.5 ± 3.3 52.2 36 59.2
 TPVICS
 - SHRUC 2,007 17.6 ± 3.4 51.1 32.7 52
 Sindh - Korangi - TPVICS 839 17.4 ± 3.4 55.4 86.1 87.9
 - SHRUC 1,036 17.2 ± 3.5 53.9 44.7 54.7
 Sindh - Karachi East - TPVICS 819 17.4 ± 3.6 59.7 79.3 83.5
 - SHRUC 571 17.0 ± 3.4 55.2 21.3 27
 Sindh - Karachi West - TPVICS 832 17.6 ± 3.2 49 62 66.3
 - SHRUC 924 17.5 ± 3.5 53 39.1 48.5
 Sindh - Malir - TPVICS 837 17.4 ± 3.6 51.4 56.3 67.4
 - SHRUC 226 16.8 ± 3.4 53.6 30.2 30.2
 Balochistan - Killa Abdullah - TPVICS 728 18.3 ± 2.7 65.4 8.5 6.5
 - SHRUC 896 15.8 ± 2.5 52.7 1.6 1.7
 Balochistan - Pishin - TPVICS 745 17.5 ± 2.6 44.7 9.3 46.2
 - SHRUC 420 17.2 ± 3.3 55.7 11 20.4
 Balochistan - Quetta - TPVICS 821 17.6 ± 3.1 52.7 25.9 29.1
 - SHRUC 896 16.8 ± 3.2 56.2 9.2 22.1

4
 In this report, literacy is defined as having received one or more years of formal education.

 15 | P a g e
3.2. Vaccination home-based record (card) availability
Vaccination cards are considered a quality measure in vaccination services and one of the reliable sources of
information about vaccination history. Information about vaccination card availability in the target
districts of TPVICS and SHRUCs are presented in Figures 1 and 2. SHRUC survey detail at the UC level is
available in an electronic annex5.

Figure 1. Proportion of children aged 12-23 months who ever had a card, TPVICS & SHRUCs

Three-quarters or more of the children in Sindh and KP SHRUCs received a card whereas only one- to two-
thirds of the children in the Balochistan SHRUCs did so. In Peshawar, about 90% of respondents in both
TPVICS and SHRUCs surveys had received a card. In Sindh, the TPVICS results were higher than the SHRUC
results, whereas, in Balochistan, the portion of children who ever received a card was higher for the
SHRUC respondents than TPVICS respondents in both Pishin and Quetta districts, but lower than TPVICS
in Killa Abdullah.

5
 https://www.dropbox.com/sh/wkb5nenf8tx1dot/AAAojoSVtR_SWiG7jlDI1WHSa?dl=0

 16 | P a g e
The report does not include p-values for a formal statistical hypothesis test of whether outcomes are
higher in the TPVICS or SHRUC datasets (one blue bar vs. the following orange bar) but in many cases an
informal eyeball test is sufficient. If two 2-sided 95% confidence intervals do not overlap, as is the case for
Pishin district in figure 1, then we can confidently say that the difference would be statistically significant
with 95% confidence. If the intervals overlap substantially (i.e., the 95% confidence interval from one
survey includes the point estimate from the other survey) then we can say that the difference would not
be statistically significant. If the two intervals overlap sightly, then it is not possible to tell by eye, and a
formal test would be required to draw a confident conclusion. In figure 1, we might use an eyeball test to
say the following:

 • Peshawar - inconclusive

 • Korangi – significant – The TPVICS estimate is significantly higher than the SHRUC estimate.

 • Karachi East - inconclusive

 • Karachi West – significant – Again, TPVICS is higher.

 • Malir - inconclusive

 • Killa Abdullah - inconclusive

 • Pishin – significant – The SHRUC estimate is significantly higher than the TPVICS estimate.

 • Quetta – significant – Again, the SHRUC estimate is higher.

 17 | P a g e
Figure 2. Proportion of children aged 12-23 months whose card was seen by the survey interviewer, TPVICS & SHRUCs

Note that every bar in Figure 2 is shorter than the corresponding bar in 1 so for every district and every
set of SHRUCs, a substantial portion of caregivers who reported having received a card for the child were
not able to show it to the survey interviewer. District Peshawar recorded the highest percentage of cards
observed in the SHRUC survey, where for 73.5% of the children, the vaccination cards were seen by the
survey team at the time of the interview. That figure is significantly higher than the 53.1% of TPVICS
respondents in the same district. Killa Abdullah had the lowest availability; Figure 1 indicates that 34.2%
of children in SHRUCs ever received a card, but Figure 2 shows that interview teams only saw cards for
18% of respondents aged 12-23 months in the SHRUC survey.

3.2.1 Reasons for non-availability of vaccination cards
Reasons for never having received a vaccination card are summarized in Table 6. In the target districts, a
primary reason for the non-availability of vaccination cards was unawareness of the importance of the
card. Another important reason was that family members of the children never visited a health facility to
obtain a vaccination card for their children.

 18 | P a g e
You can also read