Market Information AUSTRALIA & NEW ZEALAND - Brand USA
←
→
Page content transcription
If your browser does not render page correctly, please read the page content below
Market
Information

                2019
AUSTRALIA
& NEW ZEALAND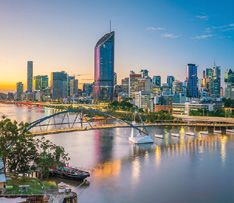
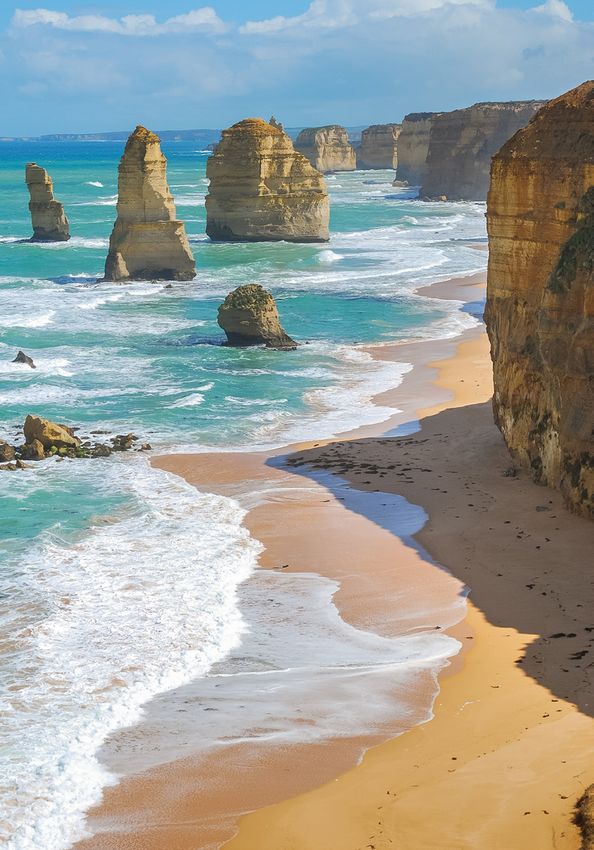
About This Guide
Brand USA is pleased to present this guide in partnership with the U.S. Commercial
Service and the National Travel and Tourism Office (NTTO). It includes snapshots
of the economies in Australia and New Zealand along with information about travel
from this region (booking channels, consumer trends, U.S. international inbound
visitation data, and key travel motivators and indicators).

Cover photo: Victoria, Australia
Brand USA....................................................................................................... 4
     Who We Are.................................................................................................................................4
     A Message from Christopher L. Thompson.................................................................. 6
     Brand USA Executive & Senior Leadership.................................................................. 8

Market Facts................................................................................................... 9
     Geography.................................................................................................................................... 9
     Demographics........................................................................................................................... 10
     Economy...................................................................................................................................... 10
     Vacation Allocation...................................................................................................................11

Travel Trends................................................................................................. 12
     International Travel Trends: Australia..............................................................................12
     International Travel Trends: New Zealand.....................................................................13
     Inbound Travel Trends: Australia.......................................................................................14
     Traveler Characteristics: Australia....................................................................................15
     Traveler Characteristics: New Zealand...........................................................................18

Air Travel Information................................................................................ 20

Market Snapshot.......................................................................................... 22

Brand USA Resources................................................................................ 27
     Online Channels........................................................................................................................27
     Brand USA Traveler Research........................................................................................... 30
     Highlights of Success............................................................................................................ 36
     Brand USA Markets................................................................................................................ 38

Brand USA Partnerships............................................................................40
     Visit USA Committees, Australia & New Zealand...................................................40
     About the U.S. Department of Commerce...................................................................41
Brand USA

Who We Are

Our Mission
As the destination marketing organization for the United States,
Brand USA’s mission is to increase incremental international visitation,
spend, and market share to fuel the nation’s economy and enhance the
image of the USA worldwide.

Established by the Travel Promotion Act of 2009 as the nation’s first
public-private partnership to spearhead a globally coordinated marketing
effort to promote the United States as a premier travel destination and to
communicate U.S. visa and entry policies, Brand USA began operations
in May 2011.

Building on Success
As one of the best levers for driving economic growth, international travel to
the United States currently supports 1.8 million American jobs (directly and
indirectly) and benefits virtually every sector of the U.S. economy. Since its
founding, Brand USA has worked in close partnership with more than 800
partner organizations to invite the world to explore the exceptional, diverse,
and virtually limitless travel experiences and destinations available in the
United States of America.

Photos: Sydney, Australia (left); Uluru-Kata Tjuta National Park, Australia (right)

4       AUSTRALIA & NEW ZEALAND
Our Partnerships
                                             According to studies by Oxford
Brand USA’s operations are
                                             Economics, over the past six
supported by a combination of                years Brand USA’s marketing
non-federal contributions from               initiatives have helped welcome
destinations, travel brands, and             nearly 7 million incremental
                                             visitors to the USA, benefiting
private-sector organizations plus            the U.S. economy with $47.7
matching funds collected by the              billion in total economic impact
U.S. government from international           and supporting nearly 52,000
                                             incremental jobs each year.
visitors who visit the United States
under the Visa Waiver Program.

Learn More
For industry or partner information about Brand USA, please visit
TheBrandUSA.com. For information about exceptional and unexpected
travel experiences in the United States, please visit Brand USA’s consumer
website at VisitTheUSA.com.

Brand USA Headquarters

1725 Eye Street NW                     Phone: +1 202.536.2060
Eighth Floor                           Email: info@TheBrandUSA.com
Washington, DC 20006 USA

                                         MARKET INFORMATION 2019             5
A Message from Christopher L. Thompson
The team at Brand USA, the public-private
partnership established to promote international
tourism to the USA, looks forward to working with
you to generate business in the Australian and
New Zealand outbound-travel sectors.
This guide will familiarize you with the factors that
make the Australian and New Zealand markets
and cultures so appealing.
Australia ranks as the 10th largest source market for overseas visitation to
the United States, as approximately 1.3 million Australians traveled to our
country during 2017. And, Australians ranked number 9 in the top 10 spend for
international visitors to the United States that year, having spent a total of
$8.5 billion.
It is significant to note that 73 percent of Australians who visit the United
States schedule a return visit. Repeat visitors are incentivized by the
competition among air carriers, which keeps fares low.
Brand USA has created a comprehensive storytelling strategy to present the
diversity of travel possibilities across the United States. The content varies
between still imagery and short and long-form videos and is shared across
different mediums from mobile to giant-screens and everything in between.
This approach allows us to provide the right message, at the right time,
to the right people, in the right manner, and shares relevant and authentic
perspectives from locals and visitors to inspire new and different travel
experiences within the USA.
Brand USA provides Australians and New Zealanders the unique opportunity
to see the United States even before they travel, to further encourage them
to visit the USA.
Our initiatives include:
• Showcasing destinations through our expanded travel-entertainment TV
channel, GoUSA TV, which is available around the globe on Roku, Apple
6 AUSTRALIA & NEW ZEALANDTV, and Amazon Fire TV, and coming soon to Google Chromecast. The
channel offers an assortment of travel experiences across four different
categories: the great outdoors, road trips, food and drink, and culture
and events. Programming on GoUSA TV will expand to feature additional
themes and formats, including series, films, videos, and live videos.
• Brand USA’s second giant-screen film, America’s Musical Journey, shares
the unique styles of American music, our cultural heritage, and the stories
associated with iconic locations across the U.S. landscape. The film has
premiered in Australia and New Zealand and is available at giant-screen
theaters throughout the region. Our first giant-screen production,
National Parks Adventure, also is available to viewers through streaming
services that offer video-on-demand.
• Our newest campaign, United Stories, features a mobile content creation
lab traveling across the United States and capturing warm and welcoming
stories told from local perspectives. A variety of accomplished content
creators, storytellers, and influencers will bring international travelers on
a journey through memorable narratives that reveal the warmth of the
American people and show the many adventures across the USA that are
just one road trip away.
I encourage you to talk to our team about destinations in the USA, the
opportunities we offer to enhance your marketing efforts in Australia and
New Zealand, and the most effective ways to inspire travelers to act now
and book their trips to the USA.
Also, remember to review Brand USA’s dedicated travel-trade website. This
comprehensive gateway allows industry professionals to easily navigate
information about U.S. travel. In the Australia and New Zealand markets—
with nearly 25,000 retail travel agents and on-site travel agencies—this
website will surely make a difference.
Together, we are marketing the USA!
Christopher L. Thompson
President & CEO
Brand USA
MARKET INFORMATION 2019 7Brand USA Executive & Senior Leadership
Christopher L. Thompson Carroll Rheem
President & CEO Vice President, Research & Analytics
CThompson@TheBrandUSA.com CRheem@TheBrandUSA.com
Thomas Garzilli Aaron Wodin-Schwartz
Chief Marketing Officer Vice President, Public Policy
TGarzilli@TheBrandUSA.com & Public Affairs
AWodinSchwartz@TheBrandUSA.com
Donald F. Richardson, CPA
Chief Financial Officer
DRichardson@TheBrandUSA.com
Karyn Gruenberg
Senior Vice President, Partner
Marketing & Strategic Alliances
KGruenberg@TheBrandUSA.com
Jake Conte
Vice President, General Counsel
JConte@TheBrandUSA.com
Cathleen Domanico
Vice President, Global Trade
Development
CDomanico@TheBrandUSA.com
Tracy Lanza
Vice President, Integrated Marketing
TLanza@TheBrandUSA.com
Joann Pelipesky
Vice President, Human Resources
& Administration
JPelipesky@TheBrandUSA.com
8 AUSTRALIA & NEW ZEALANDMarket Facts
Geography
Area Largest Metropolitan Areas
Australia
7,741,220 km2
New Zealand Brisbane
2.2 million
268,838 km2
Sydney
4.5 million
Climate
Canberra
430,169
Australia
Perth Adelaide
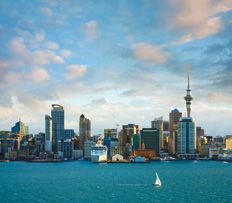
Generally arid to 1.9 million 1.3 million Auckland
semiarid; temperate 1.3 million
Melbourne
in south and east; 4.2 million
tropical in north.
Wellington
New Zealand 383,000
Temperate with sharp
regional contrasts.
Photos: Kaikoura, NZ (left); Gold Coast, Australia (right)
Source: CIA World Factbook 2018
MARKET INFORMATION 2019 9Demographics
Population
Australia New Zealand USA
Population Size 23,470,145 4,545,627 329,256,465
Median Age 38.8 years 38.1 years 38.2 years
Population Growth
Rate (2018 Est.) 1.01% 0.77% 0.8%
Population by Age
50
U.S. Australia New Zealand
40
40% 41% 40%
30
Percent
20
19% 20%
17%
14% 13% 13% 15% 16% 16%
13% 12% 12%
10
0
0-14 years 15-24 years 25-54 years 55-64 years 65+ yrs
Economy
Australia
• GDP: $1.248 trillion (2017 est.)
• GDP Real Growth Rate: 2.2% (2017 est.)
• GDP—Per Capita: $50,400 (2017 est.)
• Unemployment Rate: 5.6% (2017 est.)
• Inflation Rate: 2%
Source: CIA World Factbook 2019
10 AUSTRALIA & NEW ZEALANDNew Zealand
• GDP: $189 billion (2017 est.)
• GDP Real Growth Rate: 3% (2017 est.)
• GDP—Per Capita: $39,000 (2017 est.)
• Unemployment Rate: 4.9% (2017 est.)
• Inflation Rate: 1.9%
Vacation Allocation
National Public Holidays, 2019
Australia
• New Year’s Day: Tuesday, Jan. 1 • Queen’s Birthday: Monday, June 10
• Australia Day: Monday, Jan. 28 • Labor Day: Monday, Oct. 7
• Good Friday: April 19 • Christmas Day: Wednesday, Dec. 25
• Easter Monday: April 22 • Boxing Day: Thursday, Dec. 26
• ANZAC Day: Thursday, April 25
New Zealand
• New Year’s Day: Tuesday, Jan. 1 • ANZAC Day: Thursday, April 25
• Day after New Year’s Day: • Queen’s Birthday: Monday, June 3
Wednesday, Jan. 2 • Labor Day, Monday: Oct. 28
• Waitangi Day: Wednesday, Feb. 6 • Christmas Day: Wednesday, Dec. 25
• Good Friday: April 19 • Boxing Day: Thursday, Dec. 26
• Easter Monday: April 22
Source: CIA World Factbook 2019
MARKET INFORMATION 2019 11Travel Trends
International Travel Trends: Australia
Spending Trends: Exports (Millions of U.S. Dollars)
2010 2013 2014 2015 2016 2017 2018
Total Travel $5,937 $7,764 $8,568 $9,412 $8,756 $8,480 $8,405
& Tourism
Exports
Travel $5,445 $6,986 $7,706 $8,571 $7,962 $7,682 $7,598
Receipts
Passenger $492 $778 $862 $841 $794 $798 $807
Fare
Receipts
Change (%) 35 22 10 10 -7 -3 -1
in Total
Exports
Visitation Trends: Arrivals
2010 904
2013 1,308
2014 1,309
2015 1,453
2016 1,351
2017 1,324
2018 1,362
0 300 600 900 1200 1500
Total Arrivals (000)
Photos: Melbourne, Australia (left); Wellington, New Zealand (right)
Source: U.S. Department of Commerce, National Travel and Tourism Office
12 AUSTRALIA & NEW ZEALANDInternational Travel Trends: New Zealand
Spending Trends: Exports (Millions of U.S. Dollars)
2010 2012 2013 2014 2015 2016 2017
Total Travel $614 $850 $940 $1,155 $1,288 $1,257 n/a
& Tourism
Exports
Travel $615 $851 $850 $1,084 $1,253 $1,229 n/a
Receipts
Passenger (1) (1) $90 $71 $35 $29 n/a
Fare
Receipts
Change (%) 20 20 11 23 12 -2 n/a
in Total
Exports
Visitation Trends: Arrivals
2010 175
2012 186
2013 209
2014 263
2015 296
2016 292
2017 n/a
0 50 100 150 200 250 300
Total Arrivals (000)
Source: U.S. Department of Commerce, National Travel and Tourism Office
MARKET INFORMATION 2019 13Inbound Travel Trends: Australia
Visitor Spending
Germany 8.3
Australia 8.6
South Korea 9.5
Brazil 12.3
India 15.8
United Kingdom 16.2
Japan 16.3
Mexico 20.9
Canada 22.2
China 34.6
0 5 10 15 20 25 30 35
Billions of U.S. Dollars
International Arrivals to the USA
Top 10 Countries Generating Travel to the United States (Long-Haul Arrivals)
India 1.4
France 1.8
Germany 2.1
Brazil 2.2
South Korea 2.2
China 3.0
Japan 3.5
United Kingdom 4.7
Mexico 18.5
Canada 21.2
0 5 10 15 20 25
Millions of Visitors
Source: U.S. Department of Commerce, National Travel and Tourism Office
14 AUSTRALIA & NEW ZEALANDTraveler Characteristics: Australia
Main Purpose of Trip
Main Purpose of Trip 2017 (%) 2018 (%)
Vacation/Holiday 72 73
Visit Friends/Relatives 15 14
Convention/Conference/Trade Show 6 5
Business 5 5
Education 2 2
Other 0.3 0.7
Religion/Pilgrimages 0.2 0.5
All Purposes of Trip
Main Purpose of Trip 2017 (%) 2018 (%)
Vacation/Holiday 82 83
Visit Friends/Relatives 31 27
Convention/Conference/Trade Show 8 8
Business 7 6
Education 3 4
Religion/Pilgrimages 0.6 1
Other 0.5 0.7
Health Treatment 0.1 0.6
NET PURPOSES OF TRIP
Leisure & Visit Friends and Relatives 92 91
Business & Convention 14 12
Source: U.S. Department of Commerce, National Travel and Tourism Office
MARKET INFORMATION 2019 15Select Traveler Characterisitcs
Traveler Characteristics 2017 2017
Length of Stay in USA (Mean Nights) 18.7 19.3
Length of Stay in USA (Median Nights) 14 14
First International Trip to the USA 28.1% 29.8%
U.S. Destinations Visited (States, Cities, and Regions)
U.S. Destinations/
2017 (%) 2017 (%)
Regions
REGIONS
Middle Atlantic 26.25 24.52
Mountain 23.89 26.60
Pacific 48.85 47.45
Pacific Islands 26.97 27.29
South Atlantic 17.93 19.70
West South Central 10.83 14.08
STATES/TERRITORIES
New York 24.87 22.93
Nevada 18.38 19.12
California 46.18 44.54
Hawaii 26.83 27.18
Florida 11.26 11.12
Texas 7.44 8.88
CITIES
New York City 24.73 22.27
Las Vegas 17.76 18.39
Los Angeles 31.38 31.21
San Francisco 17.30 16.66
Honolulu/Oahu 24.43 23.58
Source: U.S. Department of Commerce, National Travel and Tourism Office
16 AUSTRALIA & NEW ZEALANDTransportation Used in the USA
56% 37% 37% 36% 33% 31%
Air travel Auto, private Taxicab/ City subway/ Auto, rented Ride-sharing
between or company Limousine Tram/Bus service
U.S. cities
Activity Participation While in the USA
91% 91% 54% 49% 44%
Shopping Sightseeing National parks/ Guided tours Small towns/
Monuments Countryside
42% 38% 32% 32% 26%
Historic Art gallery/ Experience Amusement/ Sporting event
locations Museum fine dining Theme parks
Source: U.S. Department of Commerce, National Travel and Tourism Office
MARKET INFORMATION 2019 17Traveler Characteristics: New Zealand Main Purpose of Trip Main Purpose of Trip 2016 (%) 2017 (%) Vacation/Holiday 64 n/a Business 5 n/a Visit Friends/Relatives 21 n/a Convention/Conference/Trade Show 8 n/a Education 1 n/a Health Treatment 0.0 n/a Religion/Pilgrimages 2 n/a All Purposes of Trip Main Purpose of Trip 2016 (%) 2017 (%) Vacation/Holiday 80 n/a Visit Friends/Relatives 39 n/a Business 8 n/a Convention/Conference/Trade Show 10 n/a Education 3 n/a Religion/Pilgrimages 1 n/a Health Treatment 0.3 n/a Other 0.0 n/a Select Traveler Characterisitcs Traveler Characteristics 2016 2017 Length of Stay in USA (Mean Nights) 16.2 n/a Length of Stay in USA (Median Nights) 12 n/a First International Trip to the USA 18% n/a Source: U.S. Department of Commerce, National Travel and Tourism Office 18 AUSTRALIA & NEW ZEALAND
Transportation Used in the USA

   56%            45%              43%           37%                35%             18%
  Air travel      Taxicab/     City subway/   Auto, private      Auto, rented    Bus between
  between        Limousine      Tram/Bus      or company                            cities
  U.S. cities

Activity Participation While in the USA

     94%              90%                51%                   43%                43%
   Shopping         Sightseeing      National parks/           Historic         Small towns/
                                      Monuments               locations         Countryside

     43%              39%                36%                   34%                 10%
  Guided tours      Art gallery/      Amusement/          Experience             Nightclub/
                     Museum           Theme parks         fine dining             Dancing

                                                MARKET INFORMATION 2019                        19
Air Travel Information Non-Stop Flights from Australia to the USA Flights To Flights From Airline Dallas Fort Worth (DFW) Sydney (SYD) Qantas Honolulu (HNL) Brisbane (BNE) Hawaiian Airlines Honolulu (HNL) Melbourne (MEL) Jetstar Honolulu (HNL) Sydney (SYD) Jetstar Honolulu (HNL) Sydney (SYD) Qantas Honolulu (HNL) Sydney (SYD Hawaiian Airlines Houston (IAH) Sydney (SYD) United Airlines Los Angeles (LAX) Brisbane (BNE) Qantas Los Angeles (LAX) Brisbane (BNE) Virgin Australia Los Angeles (LAX) Melbourne (MEL) Qantas Los Angeles (LAX) Melbourne (MEL) United Airlines Los Angeles (LAX) Melbourne (MEL) Virgin Australia Los Angeles (LAX) Sydney (SYD) American Airlines Los Angeles (LAX) Sydney (SYD) Delta Los Angeles (LAX) Sydney (SYD) Qantas Los Angeles (LAX) Sydney (SYD) United Airlines Los Angeles (LAX) Sydney (SYD) Virgin Australia San Francisco (SFO) Melbourne (MEL) Qantas San Francisco (SFO) Sydney (SYD) Qantas San Francisco (SFO) Sydney (SYD) United Airlines Photos: Geothermal Springs, Wai-O-Tapu, New Zealand (left); Brisbane, Australia (right) Source: Brand USA Proprietary Research 20 AUSTRALIA & NEW ZEALAND
Non-Stop Flights from New Zealand to the USA

Flights To            Flights From            Airline

Chicago (ORD)         Auckland (AKL)           Air New Zealand
Chicago (ORD)         Auckland (AKL)           United Airlines
Honolulu (HNL)        Auckland (AKL)           Air New Zealand
Honolulu (HNL)        Auckland (AKL)           Hawaiian Airlines
Houston (IAH)         Auckland (AKL)           Air New Zealand
Los Angeles (LAX)     Auckland (AKL)           Air New Zealand
Los Angeles (LAX)     Auckland (AKL)           American Airlines
San Francisco (SFO)   Auckland (AKL)           Air New Zealand
San Francisco (SFO)   Auckland (AKL)           United Airlines

                                       MARKET INFORMATION 2019     21
Market
Snapshot
Australians and New Zealanders have consistently placed the USA at the top
of their bucket list in recent years. As such, visitation has grown significantly,
having more than doubled in the past 10 years. Despite this, overall visitation
from Australia dropped two percent in 2017, and visitation growth from New
Zealand was just 0.4 percent. Visitation, however, is forecasted to be back to
growth for 2018 arrivals.
The USA is the number one long-haul destination from Australia and New
Zealand. Currently, six percent of Australia and New Zealand’s population
visits the USA each year. Repeat visitation is increasing (73 percent
currently), as is the appetite from consumers and media to discover a wider
range of U.S. destinations and experiences.
Intention to travel is also extremely
strong. The USA is the highest-ranking The number of Australians
destination that Australians visiting the USA has more than
doubled in the past 10 years.
intend to visit in the next two
years. Approximately 17.9 percent
of Australians who are planning an overseas holiday intend to visit the
USA. Intention to travel to the USA has increased year-over-year by 0.5
percent. That makes the USA the top destination of intended travel, ahead
of competitor destinations such as the UK (13.7 percent intent to travel),
Canada (8.2 percent), and Japan (8.1 percent)
Photos: Sydney, Australia (left); Piha Beach, Auckland, New Zealand (right)
Source: Roy Morgan Single Source Australia, December 2015 – November 2016, n = 14,348 & December 2016–
November 2017, n = 15,145. Base: Australians 14+.
22 AUSTRALIA & NEW ZEALANDAustralia and New Zealand remain important markets for inbound travel to
the USA. Australians and New Zealanders travel farther, stay longer, and
spend more in the United States than many other inbound markets. The
average length of stay for Australians is 22 days, higher than the average for
all overseas visitors (18 days). The average number of states visited per trip
by travelers from this market is 2.1. This propensity to travel to, through, and
beyond the gateways makes Australia and New Zealand desirable markets,
despite the challenges of relatively small populations and distance to travel
to the USA.
Australia ranks as the ninth largest market for international visitor spend in the
USA, despite having the smallest population of any nation in the top 10 markets.
Travel Markets Summary
Australia and New Zealand are enjoying a period of economic stability.
In fact, Australia has posted 27 years of unbroken growth without a
recession—a world record. Over recent years, steady continuous GDP
growth, stable exchange rates, high employment rates, and low interest rates
have all resulted in high consumer confidence. Australia and New Zealand,
however, are facing economic challenges in line with the overall global
slowdown. Specific local challenges are impacted by stalled wage growth, a
cooling of the housing market, and a steady decline of currency against the
U.S. dollar throughout 2018.
Despite the economic challenges,
desire to travel overseas remains at Australia has posted 27 years
of unbroken growth without
an all-time high. A 2018 Roy Morgan
a recession—a world record.
survey reported that 11.4 percent
of the population plans to travel
overseas in the next 12 months. That represents an increase compared to
the year before, which itself was a record year.
Travelers from this market tend to be relatively resilient to socio-economic
and political factors, which appear to have less impact on their intention to
Sources: U.S. Department of Commerce, International Trade Administration, National Travel and Tourism Office.
Roy Morgan Single Source Australia data.
MARKET INFORMATION 2019 23travel. Living in remote island nations, Australians and New Zealanders are accustomed to traveling internationally for their vacations. The other key factor in visitation is airlift/airfares. Airlift to the USA from Australia and New Zealand is at record high levels, pushing fares down to record lows. Fares have dropped by more than 30 percent over the past five years. The average return airfare to Los Angeles can be as low as $850, the equivalent of just three days of the average wage. It has never been so affordable to travel to the USA. In addition, new routes are opening, increasing competition and decreasing travel time to southern and eastern USA. In 2018, the following new routes were launched: United Sydney to Houston, Qantas Melbourne to San Francisco, and Air New Zealand Auckland to Chicago. United has announced it will start flying Melbourne to San Francisco in October 2019. Australians and New Zealanders travel to the United States primarily for leisure trips. According to the U.S. Department of Commerce National Travel and Tourism Office, 85 percent travel for holidays or visiting friends and relatives (VFR). Only six percent visit for conventions, conferences, and trade shows, and five percent visit for general business travel. Once in the United States, Australian travelers participate in various leisure-type activities: 92 percent shop; 90 percent sightsee; 57 percent visit a national park or monument; 48 percent visit historic locations, 40 percent seek fine dining, and 40 percent go to art galleries or museums. The peak season for U.S. travel by Australians and New Zealanders runs June through September—peak season in the United States—and winter “down under.” Smaller spikes in U.S. arrivals occur in December and January, coinciding with school holidays in Australia and New Zealand. As travel frequency increases, however, the trend sees a flattening out of the booking season. The top five sources for researching a holiday are: directly with airlines (49 percent); online travel agency (46 percent); travel agency office (39 percent); personal recommendation (38 percent); and travel guides (20 percent). Both travel agents and the internet play important roles in the research and booking process. 24 AUSTRALIA & NEW ZEALAND
Australia and New Zealand remain one of the rare markets in the world
where consumers will research online and offline and then walk into a
physical store to make their booking with an agent. Working with, educating,
and incentivizing agents are key parts of the best practice approach in this
market. The retail travel industry network remains a crucial influencer on travel
decision-making. There are currently approximately 3,500 retail travel agency
locations operating in Australia and 311 in New Zealand. Home-based “travel
managers” are increasing in numbers, competing with high levels of customer
service, well-established clientele, and a bespoke approach.

Most of the wholesale distribution within Australia and New Zealand firmly
occurs between the two dominant players—Flight Centre Travel Group
(Infinity Holidays) and Helloworld Travel Group (Qantas Holidays and Viva
Holidays). They claim about 60 percent of the market. House of Travel is
also a key player in the New Zealand market. The remaining percentage of
wholesale distribution is split between other specialist wholesalers, including
Excite Holidays and Adventure World.

The internet’s role has strengthened
over recent years, following a long            The online travel agency sector
period of fragmentation occurring              is smaller in Australia and
                                               New Zealand than many other
with small independents across
                                               developed markets.
the online travel space in Australia
and New Zealand. The majority of
the distribution, however, now involves the two global dominant players—
Expedia and Booking Holdings. The only independent of note is Webjet.
The online travel agency sector is smaller in Australia and New Zealand than
many other developed markets.

New Developments
For the Australian and New Zealand travel sector, 2018 was another year
of change, consolidation, and growth.

Flight Centre announced it would be eliminating three brands—Escape
Travel, Cruiseabout and My Adventure Travel—in order to grow its leisure

                                            MARKET INFORMATION 2019            25
market share. The stores were consolidated into Flight Centre or Travel Associates brands. In addition, the Infinity branded brochures are being phased out and rebranded as either Flight Centre or Travel Associates. Early in 2018, Helloworld completed the purchase of Magellan Group. They also acquired Asia Escape Holidays, Flight Systems, and Show Group Enterprises. These acquisitions and the strength of their corporate business have resulted in a jump in profits. Qantas launched history-making, non-stop flights from Perth to London. This has created a new term of “ultra-long travel,” and other nonstop routes are being considered, including Sydney to New York City. Air New Zealand and Virgin Australia ended their codeshare and reciprocal rights partnership. Air New Zealand signed a new partnership with Qantas. There were many company closures in 2018, with Si Holidays, Venture Far, and online travel agent Bestjet all ceasing business. The trend of ever-increasing representation of U.S. direct marketing organizations in the Australia and New Zealand market continues, with Colorado Tourism the latest to join the 35 plus other U.S. destinations with representatives in market. 26 AUSTRALIA & NEW ZEALAND
Brand USA
Resources

Online Channels
Digital Marketing/Social Media
The majority of the USA Campaigns are driven by digital marketing
strategies to engage, inspire, and prompt international travelers to visit the
United States. A variety of channels and methods are used, including:
 • Proprietary website platforms
 • Social media channels
 • Global digital marketing and social campaigns
 • Rich media
 • Targeted advertising

Proprietary Consumer Website Platforms
Brand USA has two online consumer identities in the marketplace:
 • VisitTheUSA (VisitTheUSA.com), which includes a global site in English
   plus in-language sites in most markets where Brand USA markets the
   United States to international travelers
 • GoUSA, which is active in Asian markets, including China and Hong Kong
   (GoUSA.cn), Taiwan (GoUSA.tw), India (GoUSA.in), Japan (GoUSA.jp), and
   South Korea (GoUSA.or.kr)

Together, the VisitTheUSA and GoUSA website platforms are the consumer-
facing online identities international travelers associate with travel to the
United States.
Photos: Karijini National Park, Australia (left); Wellington, New Zealand (right)

                                                               MARKET INFORMATION 2019   27
Social Media Channels
In addition to the global and in-market VisitTheUSA and GoUSA proprietary
websites, Brand USA leverages related social media accounts in consumer-facing
content and communications. Each market where Brand USA has a fully developed
marketing presence has a dedicated, in-language website and social channels,
which Brand USA uses to reach consumers in its target markets.
The following handles are used for global, consumer-facing promotions
in English:
• Website: VisitTheUSA.com • YouTube:
YouTube.com/VisitTheUSA
• Twitter: @VisitTheUSA
• Instagram: VisitTheUSA
• Facebook:
Facebook.com/VisitTheUSA
The following campaign hashtags support global and thematic promotions
and initiatives:
• Global: #VisitTheUSA • Great Outdoors: #OutdoorsUSA
• Flavors/Culinary: #TasteUSA • Market the Welcome:
#USAWelcome
• Road Trips: #RoadTripUSA
In addition to leveraging these global channels, Brand USA currently has
localized social media efforts in the following markets via the channels
shown in the Digital Channels chart on the following page.
28 AUSTRALIA & NEW ZEALANDDigital Channels
Market URL Local Tagline Channels Hashtag
@VisiteOsUSA facebook.com/VisitTheUSAau
Australia VisitTheUSA.com.au Plan Your USA Trip Now #VisitTheUSA
@VisitTheUSA YouTube.com/VisitTheUSA
@VisiteOsUSA facebook.com/VisiteOsUSA
Planeje Sua Viagem Aos
Brazil VisiteosUSA.com.br #VisiteOsUSA
USA Agora Mesmo
@VisitTheUSA YouTube.com/VisiteOsUSA
@VisitTheUSAca facebook.com/VisitTheUSAca
Canada:
VisitTheUSA.ca Plan Your USA Trip Now #VisitTheUSA
English @VisitTheUSA YouTube.com/VisitTheUSA
Planifiez Votre @VisitTheUSAca facebook.com/VisitTheUSAca
Canada:
fr.VisitTheUSA.ca Voyage Aux USA Dès #VisitTheUSA
French Maintenant @VisitTheUSA YouTube.com/VisitTheUSAfr
@VisitTheUSAes facebook.com/VisitTheUSAcl
Planifica tu viaje a
Chile VisitTheUSA.cl #VisitTheUSA
USA ahora
@VisitTheUSA YouTube.com/VisitTheUSAes
Sina Weibo (Chinese microblogging site/hybrid of Twitter
and Facebook): http://weibo.com/GoUSAcn
Tencent Weibo (Chinese microblogging site):
http://t.qq.com/DiscoverGoUSA
即刻 定制 您的 Youku (YouTube equivalent): http://i.youku.com/gousacn
China GoUSA.cn #VisitTheUSA
USA 旅行 计划 Weishi (like Vine): http://www.weishi.com/u/23484775
Wechat (Chinese mobile social network for texting,
images, music and articles sharing, mobile only):
美国国家旅游局
Lofter (Photo sharing platform): http://GoUSA.lofter.com
@VisitTheUSAes facebook.com/VisitTheUSAco
Planifica tu viaje a
Colombia VisitTheUSA.co #VisitTheUSA
USA ahora
@VisitTheUSA YouTube.com/VisitTheUSAes
Préparez Votre @VisitTheUSAfr facebook.com/VisitTheUSAfr
France VisitTheUSA.fr Voyage Aux USA Dès #VisitTheUSA
Maintenant @VisitTheUSA YouTube.com/VisitTheUSAfr
@VisitTheUSA facebook.com/VisitTheUSAde
Plant Jetzt Eure Reise In
Germany VisitTheUSA.de #VisitTheUSA
Die USA
@VisitTheUSA YouTube.com/VisitTheUSAde
@GoUSAin facebook.com/GoUSAin
India GoUSA.in Plan Your USA Trip Now #USAtrip
@VisitTheUSA YouTube.com/GoUSAin
@GoUSAjp facebook.com/GoUSAjp
今すぐ USAへの 旅の
Japan GoUSA.jp アメリカ旅行
計画を
@VisitTheUSA YouTube.com/GoUSAjp
@VisitTheUSAes facebook.com/VisitTheUSAmx
Planifica Tu Viaje A
Mexico VisitTheUSA.mx #VisitTheUSA
USA Ahora
@VisitTheUSA YouTube.com/VisitTheUSAes
@GoUSAkr facebook.com/GoUSAkr
지금 USA 여행을
Korea GoUSA.or.kr #미국여행
계획해보세요
@VisitTheUSA YouTube.com/GoUSAkr
@VisitTheUSA facebook.com/VisitTheUSAse
Sweden VisitTheUSA.se Plan Your USA Trip Now #VisitTheUSA
@VisitTheUSA YouTube.com/VisitTheUSA
Taiwan GoUSA.tw n/a n/a facebook.com/GoUSA.official n/a
@VisitTheUSAuk facebook.com/VisitTheUSAuk
United
VisitTheUSA.co.uk Plan Your USA Trip Now #VisitTheUSA
Kingdom @VisitTheUSA YouTube.com/VisitTheUSA
MARKET INFORMATION 2019 29Brand USA Traveler Research
In the summer of 2013, Brand USA launched its Global Market Intelligence
program. As part of this program, Brand USA commissioned PhoCus Wright,
Inc. to conduct proprietary consumer research in various international
markets. Respondents were recruited from an online panel. For markets
beyond North America, the results reflect responses from adults who travel
outside of their continent for leisure. The Global Market Intelligence program
is designed to gain insight into travelers’ perceptions of the USA and its
competitors, as well as general travel behaviors and preferences.
Top Five Motivations for Selecting Last
Intercontinental Destination
Question: What motivates your desire to visit that destination? Select all that apply (N=1007).
Base: Australia intercontinental travelers.
54% 51% 39% 35% 34%
Cultural/historic Local lifestyle Shopping Dining/ Urban attractions
attractions gastronomy
Top Five Strongest Impressions of the USA
For each of the following countries, select which characteristics, if any, describe it as a holiday
destination. Select all that apply (N=1007). Base: Australia intercontinental travelers.
39% 33% 30% 29% 25%
Diverse Adventurous Friendly Arrogant Energetic
Source: Brand USA Market Intelligence Study 2019
30 AUSTRALIA & NEW ZEALANDTop Five Channels Used in Destination Selection
for Last Intercontinental Trip
Question: What sources of information did/will you use to select the destination for this holiday?
Select all that apply. Base: Australia intercontinental travelers (N=1007).
58% 37% 27% 22% 22%
Websites Personal Websites/ Websites/ Information in
via computer recommendations applications applications printed travel
from family and via mobile phone via tablet guidebooks
friends
Expected Household Travel Spend for
Next Intercontinental Trip
Question: What is the total amount you expect your household to spend on each of the following
elements of this holiday? Enter a whole number without the currency symbol. Airline tickets/Lodging/
Additional trip-related expenses, such as dining, local transportation, souvenirs and local tours.
Base: Australia intercontinental travelers (N=1007). (Conversion AUD to USD= 0.752).
Less than $2,499 22%
$2,500-$4,999 28%
$5,000-$7,499 19%
$7,500-$9,999 15%
$10,000+ 16%
0 5 10 15 20 25 30 35 40 45 50
Percent
Mean: $6,608 Median: $5,114
Source: Brand USA Market Intelligence Study 2019
MARKET INFORMATION 2019 31Months Traveled (March 2017–March 2019)
Question: During what month(s) did you take your holiday(s)? Base: Australia intercontinental
travelers 2019 (N=1007).
January 18%
February 11%
March 15%
April 18%
May 19%
June 20%
July 21%
August 20%
September 20%
October 21%
November 18%
December 21%
0 5 10 15 20 25 30 35 40 45 50
Percent
Destination Interest—Top 10 States
Question: You indicated in a previous question that you have interest in visiting the USA some time
in the future. Which U.S. state(s) are you interested in visiting? Base: Australia intercontinental
travelers with interest in visiting the United States (N=917).
54% 52% 36% 27% 19%
New York California Hawaii Florida Alaska
18% 17% 15% 11% 9%
Texas Washington Nevada Colorado Massachusetts
Source: Brand USA Market Intelligence Study 2019
32 AUSTRALIA & NEW ZEALANDExpected Travel Party Size of Next Intercontinental Trip
Question: Who will travel with you on this holiday? Select all that apply. Base: Australia
intercontinental travelers 2019 (N=1007). Note: Totals may not add up to 100% due to rounding.
28% 39% 15% 12% 5%
One Two Three Four Five or more
Destination Decision for Next International Trip
Question: How far in advance of your departure date did/will you decide on the destination?
Base: Australia intercontinental travelers 2019 (N=1007). Note: Totals may not add up to 100%
due to rounding.
I did/will not
decide in advance 3%
1 day or less 2%
2 to 6 days 3%
1 to 2 weeks 5%
3 to 4 weeks 5%
1 to 2 months 12%
3 to 5 months 27%
6 to 12 months 33%
More than one year 9%
0 10 20 30 40 50
Percent
Source: Brand USA Market Intelligence Study 2019
MARKET INFORMATION 2019 33Air Booking for Next International Trip
Question: How far in advance of your departure date did/will you book the travel products for this
holiday? Select one option from the drop-down box. Base: Australia intercontinental travelers 2019
(N=1007). Note: Totals may not add up to 100% due to rounding.
1 day or less/did not
decide in advance 2%
2 to 6 days 2%
1 to 2 weeks 6%
3 to 4 weeks 7%
1 to 2 months 19%
3 to 5 months 32%
6 to 12 months 30%
More than one year 2%
0 10 20 30 40 50
Percent
Net Promoter
Question: United States of America: If a friend or relative were discussing a future holiday destination
with you, which statement would best describe your attitude toward the following countries? Base:
Australia intercontinental travelers (N=1007). Note: Totals may not add up to 100% due to rounding.
25% 32% 32% 7% 4%
I would I would tell I would tell I would tell I would bring it
bring it up to people positive people neither people negative up to discourage
recommend as things about it positive nor things if it were people from
a destination if it were negative things brought up traveling there
brought up if it were
brought up
Source: Brand USA Market Intelligence Study 2019
34 AUSTRALIA & NEW ZEALANDLikelihood of Travel to the USA
Question: When, if ever, are you likely to visit the following countries? Base: Australia intercontinental
travelers 2019 (N=1007).
In the next 6 months 9%
6-12 months 12%
1-2 years 20%
2-5 years from now 26%
Maybe some time
25%
in the distant future
Not likely to ever visit 9%
0 10 20 30 40 50
Percent
MARKET INFORMATION 2019 35Highlights of Success Brand USA is building on success. With the support of its many partners worldwide, Brand USA has grown from a start-up organization (that launched its first full year in operation in 2012 with just 89 partners) to an organization that has worked with and been supported by over 900 partners worldwide. Here is some of what we’ve accomplished together so far: • Welcomed nearly 7 million incremental international visitors to the USA over the past six years, which has benefited the U.S. economy with $47.7 billion in total economic impact and supported, on average, nearly 52,000 incremental jobs a year (source: Oxford Economics). • Increased the number of international travelers coming to the United States to, through, and beyond the gateways. • Established consumer and trade marketing initiatives in more than 40 international markets, which generate 90 percent of all inbound travel to the United States. • Created the first connected TV channel by a national destination marketing organization. • Delivered trailblazing content that resonates with travelers worldwide and can be enjoyed on virtually any platform—from mobile to the giant screen and everything in between. • Produced two award-winning giant-screen films that are inspiring hundreds of millions of travelers to come to the USA. • Organized the industry’s first MegaFam—which has brought hundreds of top-tier travel buyers to the USA. • Pioneered a range of cooperative marketing programs and platforms that are enabling U.S. destinations of all shapes and sizes to connect with international travelers like never before. • Established partnerships with destinations and travel brands from all 50 states, the five territories, and the District of Columbia. • Maintained a partnership retention rate of over 90 percent. 36 AUSTRALIA & NEW ZEALAND
Over the past six years, Brand USA's marketing efforts have generated...

900+               6.6 million
   partners        incremental visitors
  (with a 94%
 retention rate)

                                                        $6.2 billion
                   $21.8 billion                        federal, state &
                                                        local taxes
                   incremental spending

                                                       $47.7 billion
                                                       total economic
                                                       impact

                   nearly

                   52,000
                   incremental jobs
                   supported each year

                                       MARKET INFORMATION 2019             37
• Built a model public-private partnership—working with all tourism-related
federal agencies to promote and leverage the economic and social benefit
of travel and extend a warm welcome to international travelers throughout
the world.
• Supported our federal partners in accurately communicating information
about U.S. entry policies and, importantly, correcting misperceptions about
those policies.
• Kept overhead expenses to below 10 percent each year since our
founding—devoting more than 90 percent of Brand USA’s resources
toward marketing and programs to increase international visitation.
By all these measures and more, Brand USA’s marketing efforts are
working—effectively and efficiently.
Brand USA Markets
Brand USA deploys its marketing efforts in a strategic combination of
emerging and established markets that have the potential to drive the
greatest returns in terms of visitation, spend, and market share.
Based on these market selection factors, Brand USA currently focuses the
majority of its consumer marketing efforts in the following markets:
• Australia • China • India • Sweden
• Brazil • Colombia • Japan • United
Kingdom
• Canada • France • Mexico
• Chile • Germany • South Korea
38 AUSTRALIA & NEW ZEALANDThese 14 international markets generate more than 80 percent of inbound
travel to the United States. In total, through the combined total of Brand
USA’s cooperative marketing platforms, contributed media, and trade
outreach, the international marketing effort is present in more than 40
markets, including:
• Albania • Equatorial • Japan • Peru
Guinea • Kenya • Philippines
• Angola
• Finland • Kuwait • Portugal
• Argentina
• France • Lithuania • Romania
• Australia
• Gabon • Luxembourg • Saudi Arabia
• Austria
• Germany • Mexico • South Africa
• Belgium
• Guatemala • Morocco • Tanzania
• Brazil
• Guyana • Mozambique • Ukraine
• Canada
• Honduras • Nepal • United Arab
• Chile
• Hong Kong • Netherlands
Emirates
• China
• Hungary • Uruguay
• Colombia • New Zealand
• India • Vietnam
• Costa Rica • Norway
• Indonesia • Zambia
• Denmark • Oman
• Ireland • Zimbabwe
• Ecuador • Panama
• Italy • Paraguay
• El Salvador
MARKET INFORMATION 2019 39Brand USA Partnerships Visit USA Committees, Australia & New Zealand How Brand USA Works with Visit USA Committees Brand USA works in collaboration with Visit USA committees around the world to promote the United States as a premier travel destination. These committees organize a wide range of promotional activity, including travel trade shows, workshops, and training for travel agents and tour operators, roadshows with U.S. destinations, and more. Visit USA committees are generally managed by voluntary members with an interest in promoting and selling travel to the United States. Brand USA collaborates with Visit USA committees and supports activities that align with Brand USA’s objectives and marketing strategies. In addition, Brand USA makes use of the in-market expertise of Visit USA committees, both where Brand USA has representation and where it does not. Visit USA Committee Australia Visit USA Committee New Zealand Lucy Rowe Claire Reynolds President Chair Caroline Davidson Leanne Cheesman Vice President Vice Chair Admin@VisitUSA.org.au Contact@VisitUSA.co.nz Photos: King George River, Kimberley, Australia (left); Auckland, New Zealand (right) Source: CIA World Factbook 2018, unless noted otherwise 40 AUSTRALIA & NEW ZEALAND
About the U.S. Department of Commerce
Brand USA works in close concert with the U.S. Department
of Commerce through the National Travel and Tourism Office
(NTTO) and the U.S. Commercial Service.

The National Travel and Tourism Office (NTTO)
NTTO is the liaison between Brand USA and the federal government. The
office works with Brand USA on behalf of the Secretary of Commerce, who
appoints the Brand USA Board of Directors and approves Brand USA’s
annual objectives in consultation with the Secretary of State and the Secretary
of Homeland Security. Additionally, NTTO facilitates the approval of matching
funds for Brand USA and connects Brand USA to other federal agencies.

More broadly, NTTO creates a positive climate for growth in travel and
tourism by reducing institutional barriers to tourism, administers joint marketing
efforts, provides official travel and tourism statistics, and coordinates efforts
across federal agencies through the Tourism Policy Council. The office works
to enhance the international competitiveness of the U.S. travel and tourism
industry and increase its exports, thereby creating U.S. employment and
economic growth through:
 • Management of the travel and tourism statistical system for assessing the
   economic contribution of the industry and providing the sole source for
   characteristic statistics on international travel to and from the United States;
 • Design and administration of export expansion activities;
 • Development and management of tourism policy, strategy and advocacy;
 • Technical assistance for expanding this key export (international tourism)
   and assisting in domestic economic development.

                                             MARKET INFORMATION 2019              41
Contact:
NTTO
International Trade Administration
U.S. Department of Commerce
1401 Constitution Avenue, NW
Washington, DC 20230
202.482.0140
ntto@trade.gov
Selected Staff List:
Phil Lovas Mark Brown
Deputy Assistant Secretary Market Research Analyst
for Travel and Tourism Mark.Brown@trade.gov
Philip.Lovas@trade.gov
Richard Champley
Isabel Hill Senior Research Analyst
Director Richard.Champley@trade.gov
Isabel.Hill@trade.gov
Curt Cottle
Julie Heizer International Trade Specialist
Team Lead, Industry Relations Curt.Cottle@trade.gov
Julie.Heizer@trade.gov
John Terpening
Brian Beall Economist
Deputy Director, Policy and Planning John.Terpening@trade.gov
Brian.Beall@trade.gov
Claudia Wolfe
Jennifer Aguinaga Economist
International Trade Specialist Claudia.Wolfe@trade.gov
Jennifer.Aguinaga@trade.gov
42 AUSTRALIA & NEW ZEALANDThe U.S. Commercial Service
Brand USA works closely with the U.S. Commercial Service
(USCS) to pursue our mutual objective of promoting the
United States as the premier international travel destination.
The USCS is the trade promotion arm of the U.S. Department
of Commerce’s International Trade Administration. The
USCS is a federal government agency with a domestic network of over 100
offices and a global network operating in over 75 countries. The mission
of the USCS is to assist American companies in their export needs and
to support foreign direct investment into the United States. As America’s
largest services export, travel and tourism is a key sector for the USCS.
The Commercial Service Global Travel and Tourism Team helps U.S.
destinations and travel suppliers attract international visitors and grow
international arrivals. This assistance can include: trade counseling, market
research, vetting of potential partners, outreach to wholesale buyers, and
support with international sales calls/trade shows/visits. To search for a
domestic trade specialist near you, visit www.export.gov.
Australia New Zealand
Monique Roos Janet Coulthart
Senior Commercial Specialist Commercial Specialist, Head of Section
Monique.Roos@Trade.gov Janet.Coulthart@Trade.gov
MARKET INFORMATION 2019 43TheBrandUSA.com
9.13.19You can also read