Apiculture MINISTRY FOR PRIMARY INDUSTRIES 2019 APICULTURE MONITORING PROGRAMME - MPI
←
→
Page content transcription
If your browser does not render page correctly, please read the page content below
Apiculture MINISTRY FOR PRIMARY INDUSTRIES 2019 APICULTURE MONITORING PROGRAMME
KEY POINTS
• The 2018/19 season produced an estimated honey crop of                                • Average honey prices paid to New Zealand beekeepers
  23,000 tonnes, an increase of 3,000 tonnes (15 percent) on                              in 2018/19 (often referred to as bulk honey prices) fell
  the prior year, driven by an increase in hive numbers (up                               significantly for most honey types apart from monofloral
  4 percent) and an increase in the national average honey                                mānuka honey.
  yield per hive (up 10 percent).
                                                                                        • The value of New Zealand’s pure honey exports increased
• Good rewarewa and clover honey crops boosted hive yields                                by 2 percent in 2018/19 to $355 million, with higher export
  in the North Island to 22.3 kilograms, partially offsetting                             prices (up 10 percent) compensating for the drop in export
  the average to slightly below average yields from mānuka.                               volume (down 7 percent).
  Beekeepers in the South Island achieved an average hive
                                                                                        • New Zealand exported 4,587 tonnes of pure honey in the
  yield of 33.4 kilograms for the 2018/19 season, helped by
                                                                                          six month period between July and December 2019, with
  good crops of clover and honeydew honeys.
                                                                                          52 percent (2,369 tonnes) being monofloral mānuka honey.
• The number of registered hives reached 918,026 in June                                  The average export price for monofloral mānuka honey was
  2019, an increase of 36,841 hives (4 percent) on the prior                              $54.67 per kilogram compared with $20.46 per kilogram for
  year. Strong market demand for monofloral mānuka honey is                               non-mānuka honey.
  still driving an increase in hive numbers.
                                                                                        • Note that this report covers the 2018/19 beekeeping season
• The number of registered beekeeping enterprises increased                               from July 2018 to June 2019. Reporting on the impacts of
  by 8 percent to 9,282. This increase mostly occurred in the                             COVID-19 on beekeeping activities and on New Zealand
  hobbyist and semi-commercial categories. The number of                                  honey exports during 2020 will be included in the 2020
  “mega commercial” beekeeping enterprises (more than                                     Apiculture Monitoring report.
  3,000 hives) remained the same at 49.

TABLE 1: KEY PARAMETERS OF THE NEW ZEALAND APICULTURE INDUSTRY, 2013 TO 2019

YEAR ENDED 30 JUNE                                                            2013          2014          2015           2016          2017          2018           2019
Beekeeper and hive numbers
Number of registered beekeeping enterprises1                                  4,279         4,814         5,551          6,735         7,814         8,552          9,282
Number of registered bee hives1                                            452,018       507,247        575,872       684,046       795,578        881,185       918,026

Honey production
New Zealand annual honey production                     Tonnes              17,825         17,610        19,710        19,885         14,855        20,000         23,000
Honey yield per hive                                    kg/hive                39.4          34.7           34.2          29.1          18.7           22.7          25.1

Honey prices2
Bulk honey price range for light clover honey           NZ$/kg           5.00-7.30      5.50-8.30    7.00-10.75    9.50-13.00 10.00-14.00       8.50-12.00      5.00-9.25
                                                                                                                        12.00-        10.80-        12.00-          5.00-
Bulk honey price range for mānuka honey3                NZ$/kg         10.45-60.00     8.00-85.00 9.50-116.50
                                                                                                                        148.00        127.00        135.00         125.00

Honey exports (pure honey)4
Honey export volume                                     Tonnes                8,054         8,702         9,046          8,831         8,450         8,692          8,065
Honey export value (at fob5)                            Million NZ$             145           187           233            315           329           348            355
Honey export price (at fob5)                            NZ$/kg                17.99         21.45         25.77          35.62         38.92         40.04          44.02
Notes			                                                                                                           Source: AsureQuality Limited and Statistics New Zealand.
n/a Not applicable
1 Registered beekeeping enterprises and hives under the National American Foulbrood Pest Management Plan.
2 Prices paid to beekeepers for bulk honey. The beekeepers supply the packaging (drums or intermediate bulk containers) and cover freight costs to the buyers premise.
The honey prices reported in this report for each season cover the period from July to June.
3 Mānuka honey as identified by the beekeeper/supplier. The range in price is influenced by the rating on industry grading systems such as UMF®, MGO™ or equivalent. The
Ministry for Primary Industries’ (MPI) mānuka honey definition was finalised in December 2017.
4 New Zealand honey is mainly exported as pure honey in retail packs and in bulk. Comb honey and honeydew are also included in pure honey exports, but typically account
for less than 10 percent of total export volumes.
5 fob = free on board

2 2019 APICULTURE
PRODUCTION AND FINANCIAL PERFORMANCE OF
APICULTURE IN 2018/19
The profitability of many beekeeping enterprises in 2018/19                                Honey production in the North Island increased by 15 percent
remained low, attributed to:                                                               to an estimated 15,500 tonnes, driven primarily by an increase
• on-going weak demand and low prices for non-mānuka                                       in hive yield (up 11 percent) alongside a modest increase
  honeys;                                                                                  in hive numbers (up 3 percent) (Tables 2 and 3). This boost
• low honey production in some areas; and                                                  in honey yields can be mainly attributed to good rewarewa
                                                                                           and clover honey crops in the 2018/19 season. Beekeepers
• honeys harvested from some mānuka stands, or honey
                                                                                           reported average to slightly below average yields from
  stocks on hand that were previously regarded by beekeepers
                                                                                           mānuka.
  and packers as ‘mānuka honey’, not meeting the Ministry
  for Primary Industries’ (MPI) mānuka honey definition, in                                Beekeepers in Northland reported another below average
  particular the definition for monofloral mānuka honey.                                   crop with hive yields below 15 kilograms common in this
                                                                                           region. Unfavourable weather conditions in spring, coupled
Some full time beekeepers have had to return to alternative
                                                                                           with higher than normal early summer rainfall significantly
full or part-time paid employment, and several beekeeping
                                                                                           reduced the number of bee flight days over the mānuka
enterprises became available for sale.
                                                                                           flowering period.
HONEY PRODUCTION                                                                           Cool, wet conditions in spring over several parts of the North
                                                                                           Island reduced the number of effective foraging days during
Another record honey crop in 2018/19
                                                                                           this time impacting on the spring build-up of hives, and hence
The 2018/19 season produced an estimated honey crop of
                                                                                           the potential honey yields from early flowering crops.
23,000 tonnes, an increase of 15 percent on the prior year
and a new record (Tables 1 and 2). The increase in production                              Despite the generally poor spring and early summer, both
was attributed to both an increase in the number of hives (up                              the rewarewa and tawari crops did reasonably well with
4 percent to 918,026 hives) and a higher national average hive                             beekeepers harvesting these crops commenting that it was an
yield (up 10 percent to 25.1 kilogram per hive) compared to                                exception to an otherwise disappointing season. These tree
the prior season. However, due to seasonal factors and the                                 crops are mainly located in the Coromandel, Bay of Plenty and
ongoing change in focus of many commercial beekeepers                                      Waikato. The good rewarewa honey crop was also unexpected
away from maximising yield to improving financial return, hive                             as it yielded well last season (2017/18) and it is unusual to get
yield was well below the 10-year average of 28.6 kilograms per                             a good surplus in consecutive years.
hive.                                                                                      Summer in western and central regions of the North Island
                                                                                           was characterised by cool temperatures and relatively high
                                                                                           soil moisture content. This is ideal for vegetative growth in

TABLE 2: NEW ZEALAND HONEY CROP ESTIMATES, 2010 TO 2019
YEAR ENDED 30 JUNE                              2010        2011        2012        2013        2014        2015        2016        2017        2018        2019       10-year
                                            (tonnes)    (tonnes)    (tonnes)    (tonnes)    (tonnes)    (tonnes)    (tonnes)    (tonnes)    (tonnes)    (tonnes)       average
                                                                                                                                                                      (tonnes)

North Island total                             7,563       6,790       5,595     11,770      13,210      14,730      14,365        9,245     13,500      15,500        11,227
North Island yield/hive (kg)                    31.3        26.4        19.5        37.7        36.4        35.0        27.7        15.2        20.1        22.3            27.2

South Island total                             4,990       2,660       4,790       6,055       4,400       4,980       5,520       5,610       6,500       7,500           5,301

South Island yield/hive (kg)                    36.9        20.0        35.2        43.3        30.5        32.1        33.3        30.1        31.2        33.4            32.6

New Zealand total                            12,553        9,450     10,385      17,825      17,610      19,710      19,885      14,855      20,000      23,000        16,527

New Zealand yield/hive (kg)                     33.3        24.2        24.6        39.4        34.7        34.2        29.1        18.7        22.7        25.1            28.6
Note
With the increasing trend of beekeepers moving hives long distances to harvest mānuka, in particular in the North Island, it is no longer feasible to provide a regional
breakdown of estimates of honey production. Therefore, honey crop estimates are reported for the North Island and South Island only.
See Information about the Report for details on how the annual honey crop is estimated.
Source: AsureQuality Limited.

MINISTRY FOR PRIMARY INDUSTRIES                                                                                                                        2019 APICULTURE 3
pasture plants but is not conducive to high nectar yields, which                                        The West Coast of the South Island, like the western and
require the plants to be stressed.                                                                      central areas of the North Island, was affected by cool wet
Average to poor honey crops from mānuka stands were                                                     weather over the majority of the season resulting in average
reported for the Gisborne and Wairoa Districts, attributed in                                           crop yields from kamahi, mānuka and rata.
part to cool, wet spells in early summer. The East Coast of the                                         Otago and Southland beekeepers had mixed results. Parts of
North Island had a dry summer with hot, dry, windy weather                                              Southland experienced cool, wet conditions resulting in lower
in January and February 2019. Significant wind events further                                           yields. In contrast, central Otago had drier conditions with
challenged bees attempting to collect a surplus crop.                                                   good pollen supplies from early flowering willow setting the
The South Island produced another good honey crop, well                                                 hives up well for the season. This progressed on to good honey
above volumes from the past two seasons. Honey production                                               yields from thyme and later from pasture species.
in the South Island increased by 15 percent for the 2018/19
                                                                                                        Growth in hive numbers slows
season to an estimated 7,500 tonnes, driven by both an
                                                                                                        The beekeeping industry has experienced exceptional growth
increase in hive yield (up 7 percent) and hive numbers (up
                                                                                                        in hive numbers over the last few years but it slowed down
8 percent) (Tables 2 and 3). The average hive yield for the
                                                                                                        in the 2018/2019 season. Wintering hive numbers as at 30
South Island continues to surpass that of the North Island at
                                                                                                        June 2018 were recorded at 881,185 hives. Hive splitting
approximately 33 and 22 kilograms per hive, respectively. The
                                                                                                        programmes through the spring saw an additional 36,841
difference in hive yields is due in part to a larger proportion of
                                                                                                        registered colonies by mid-summer, increasing slightly
North Island hives targeting mānuka, which is often a lower
                                                                                                        over autumn to give a wintering total of 918,026 hives at
yielding but higher income crop.
                                                                                                        30 June 2019, an increase of 4 percent (Figure 1). Weaker
Good crops of clover and honeydew honeys were reported                                                  demand and lower prices on offer for most honey types other
for the South Island for the 2018/19 season. Canterbury                                                 than monofloral mānuka honey is slowing down the rate of
beekeepers had a relatively warm, dry and settled summer                                                expansion of hive numbers.
resulting in a particularly good season for clover and other
                                                                                                        Industry feedback suggests that most of the wild mānuka
pasture species, as well as honeydew. Beekeepers also
                                                                                                        stands deemed capable of producing monofloral mānuka
benefited from clover being planted into a lot of new pasture
                                                                                                        honey are occupied in the North Island, with increasing
which further improved nectar supply.

FIGURE 1: REGISTERED BEEKEEPING ENTERPRISES AND HIVE NUMBERS IN NEW ZEALAND1, AS AT 30 JUNE, 2000 TO 2019

                                1,000,000                                                                                                           10,000

                                    900,000                                                                                                         9,000
                                                                                                                                                             Number of registered beekeeping enterprises

                                    800,000                                                                                                         8,000
       Number of registered hives

                                    700,000                                                                                                         7,000

                                    600,000                                                                                                         6,000

                                    500,000                                                                                                         5,000

                                    400,000                                                                                                         4,000

                                    300,000                                                                                                         3,000

                                    200,000                                                                                                         2,000

                                    100,000                                                                                                         1,000
                                                           Registered Hives                                Registered beekeeping enterprises
                                         0                                                                                                          0
                                              2000 2001 2002 2003 2004 2005 2006 2007 2008 2009 2010 2011 2012 2013 2014 2015 2016 2017 2018 2019

                                                                                      Year ended 30 June

Notes
1 Registered beekeeping enterprises and hives under the National American Foulbrood Pest Management Plan. Data from 2013 to 2019 is at 30 June. Data for prior years is
at early May to mid-June. Only minor differences in hive numbers are expected over the months of May and June.
Varroa was discovered in hives in New Zealand in 2000.
Source: AsureQuality Limited.

4 2019 APICULTURE
concerns being reported about over-crowding. As a result,                                      An additional 4,166 apiaries were registered over the 2018/19
some larger enterprises may look to opportunities in the                                       season to accommodate the additional hives (Table 3). Apiary
South Island for harvesting mānuka honey.                                                      density is a very real concern for beekeepers, landowners
Despite the downward pressure on honey prices, beekeeper                                       and other stakeholders. While there is no definitive data
numbers have continued to grow at only a slightly lower rate                                   available on actual beehive stocking rates, it is possible that
than last year, with a further 730 new registrations (9 percent                                overstocking along with the unpredictable weather and other
increase) over the course of the season (Tables 3 and 4). The                                  factors, contributed to the declining honey yield per hive for
ratio of beekeeping enterprises between islands continues to                                   the North Island in the past decade (Table 2).
move in favour of the North Island (Table 3) which accounted
for 68 percent of the new registrations (498 additional
enterprises) in the last year. There are 49 “mega commercial”
beekeeping enterprises in New Zealand as at June 2019,
similar to the previous year (Table 4).

TABLE 3: NEW ZEALAND BEEKEEPING ENTERPRISE, APIARY AND HIVE STATISTICS¹, AS AT 30 JUNE 2019

REGION                                                                                      Beekeeping enterprises                      Apiaries2              Hives2

Northland/Auckland/Hauraki Plains                                                                                 2,422                   11,379              156,712
Waikato/King Country/Taupo                                                                                          919                    6,522              127,149
Coromandel/Bay of Plenty/Rotorua/Poverty Bay                                                                      1,114                    8,062              151,689
Hawke's Bay/Wairarapa/Manawatu/Taranaki/Wellington                                                                2,141                   16,654              258,002
North Island                                                                                                      6,596                   42,617              693,552
Marlborough/Nelson/West Coast                                                                                       677                    5,302               69,677
Canterbury/Kaikoura                                                                                               1,207                    7,132               95,473
Otago/Southland                                                                                                     802                    4,642               59,324
South Island                                                                                                      2,686                   17,076              224,474
New Zealand                                                                                                       9,282                   59,693              918,026
Notes
1 Registered beekeeping enterprises, apiaries and hives under the National American Foulbrood Pest Management Plan.
2 Regional location of apiaries is at their wintering sites. The regional location of hives is based on the location of the apiaries.
Source: AsureQuality Limited.

TABLE 4: SUMMARY OF BEEKEEPING ENTERPRISES1 BY HIVE NUMBER

AS AT 30 JUNE                    2010           2011            2012            2013            2014           2015            2016       2017       2018       2019
5 hives or less                  1,745          2,044           2,463           2,828           3,162          3,639           4,330      4,873      5,262      5,799

6 to 50 hives
        2
                                   695             678            774             843             964          1,109           1,446      1,781      2,017      2,151

51 to 500 hives
            3
                                   319             336            351             379             443             530            662        833        911        952

501 to 1,000 hives                  99             109            115             122             124             129            135        155        179        192

1001 to 3,000 hives                 81              84              87             90              92             111            126        129        134        139

>3,0004 hives                       18              16              16             17              29              33              36        43         49         49

Total                           2,957           3,267           3,806           4,279          4,814           5,551           6,735      7,814      8,552      9,282

Notes
1 Registered beekeeping enterprises and hives under the National American Foulbrood Pest Management Plan.
2 Beekeepers with 1-50 hives are considered hobby beekeepers.
3 Beekeepers with greater than 350 hives are considered commercial beekeepers.
4 Data for >3000 hives category between 2010 and 2013 is as at 31 March as data at 30 June is not available. Data for 2014 to 2019 is at 30 June.
Source: AsureQuality Limited.

MINISTRY FOR PRIMARY INDUSTRIES                                                                                                                     2019 APICULTURE 5
HONEY PRICES                                                                                The industry is suffering from an over-supply of non-mānuka
Average honey prices paid to New Zealand beekeepers                                         honeys and high inventories, hence a price correction. The
in 2018/19 (often referred to as bulk honey prices) fell                                    record crop in 2018/19 has placed additional pressure on an
significantly for most honey types (Table 5). The honey prices                              already saturated market. This situation is likely to remain
reported in this report cover the period from July 2018 to June                             until export markets can be further developed to utilise this
2019. Changes or fluctuations in honey prices after June 2019                               supply, including re-establishing some previous markets.
are not included.                                                                           The net result is that honey prices on offer, in particular for
                                                                                            non-mānuka honeys, are below the cost of production for
Monofloral mānuka honey prices held whilst prices
                                                                                            many beekeeping businesses. Some beekeepers who have
for other honey types fell
                                                                                            experience of direct selling and exporting in the past have
Prices for mānuka honey sold as monofloral mānuka honey
                                                                                            begun direct selling again, with the aim of garnering a greater
that met the definition for monofloral mānuka honey, and also
                                                                                            proportion of the market price.
had a high rating according to industry grading systems such
as UMF®, MGO™ or equivalent, held up during 2018/19.                                        Anecdotal reports suggest that more pasture-type honey
                                                                                            was left on hives for winter feeding over winter 2019 than
Prices for multifloral mānuka honey and non-mānuka honeys
                                                                                            in the previous years, as beekeepers balanced the cost of
decreased in 2018/19, with a price of $5.00 per kilogram
                                                                                            extraction against savings in transport and feeding with sugar.
noted at the lowest end of the range for both clover honey and
                                                                                            Beekeepers are re-assessing production costs, including
multifloral mānuka honey (Table 5).

TABLE 5: PRICES/RETURNS FOR APICULTURE PRODUCTS, 2013 TO 2019
YEAR ENDED 30 JUNE                                        2012/13           2013/14          2014/15           2015/16           2016/17           2017/18           2018/19
Bulk honey1 ($ per kg)
     Light (clover type)                                   5.00-7.30        5.50-8.30        7.00-10.75       9.50-13.00       10.00-14.00        8.50-12.00         5.00-9.25
     Light amber                                           5.50-8.50        4.50-8.00         7.00-9.00       9.00-11.50        6.50-13.00        7.50-10.00         4.50-9.25
     Dark, including honeydew                              4.50-8.50       5.50-10.00        7.00-12.50       8.00-14.50        8.00-16.00         5.00-8.50         3.50-6.00
     Mānuka2                                            10.45-60.00        8.00-85.00      9.50-116.50      12.00-148.00      10.80-127.00     12.00-135.00       5.00- 125.00

Beeswax3 ($ per kg)
     Light                                                 7.50-8.50       8.00-10.50        9.00-12.50      11.00-15.00       12.00-17.00       16.00-17.00      10.00-17.00
     Dark                                                  6.50-7.80        6.50-7.80        8.00-10.00       9.00-10.00       12.00-17.00       15.00-16.00      12.00-20.00
Pollen ($ per kg)
       3

     Not dried or cleaned                               16.00-30.50       16.00-30.50      16.00-27.00       16.00-25.00       16.00-25.00       16.00-25.00      16.00-25.00
     Cleaned and dried                                 40-00-45.00        40.00-45.00      40.00-46.00                  …                 …                 …                 …

Pollination4 ($ per hive)
     Pipfruit, stonefruit and berryfruit                     60-120            60-120            60-140            60-150           70-180            80-200            95-250
     Kiwifruit
     – Hawke’s Bay                                          120-180           120-185          120-180           165-300           200-300           190-300           190-300
     – Auckland                                             120-150           120-150          120-150           150-400           150-400           180-400           180-400
     – Bay of Plenty                                        120-195           140-210          142-195           145-400           150-400           175-400           185-400
     – Nelson                                               120-150           120-150          115-195           178-190           130-190           150-200           150-200
     Canola and small seeds (carrots)                       150-195           150-195          150-195           130-200           200-250           200-250           100-250
Live Bees3
     Bulk bees for export ($ per 1kg package)                  27-29            27-32             28-32             31-35             31-35            31-35                 32
     Queen bees (per queen) local sales ($)                    33-37            33-37             30-37             35-60            14-805            20-805           14-755
Notes
… Data not available.
All prices are exclusive of GST.
1 Prices paid to beekeepers for bulk honey. The beekeepers supply the packaging (drums or intermediate bulk containers) and cover freight costs to the buyers premise.
2 Mānuka honey as identified by the beekeeper/supplier. The range in price is influenced by the rating on industry grading systems such as UMF®, MGO™ or equivalent.
The Ministry for Primary Industries’ (MPI) definition for monofloral and multifloral mānuka honey was finalised in December 2017.
3 Prices paid to beekeepers. The beekeepers cover the freight costs to the buyers premise.
4 Prices paid to beekeepers. Prices at the lower end of the range are for hives delivered to depot sites. Upper end prices include delivery into the orchard and sugar for 3 to 4
one-two litre feeds to stimulate the bees to collect pollen. Higher prices were also demanded for hives placed in orchards (in particular kiwifruit orchards) under netting.
5 Queen bee prices includes the price of virgin queens in the price range.

Source: AsureQuality Limited.

6 2019 APICULTURE
beekeepers targeting mānuka honey. Mānuka stands under                                                          Live bee exports
  review include those less likely to produce monofloral mānuka                                                   Live bee exports from New Zealand continued their slow
  honey, or where there is overcrowding.                                                                          recovery with 20,361 one-kilogram packages sent to Canada
                                                                                                                  in the autumn of 2019 (Canadian spring), up 7 percent on last
  OTHER REVENUE SOURCES                                                                                           year (Figure 2). It is unlikely that live bee exports will achieve
                                                                                                                  the levels of 30,000 to 35,000 one-kilogram packages between
  Pollination services
                                                                                                                  2009 and 2015, until world honey prices improve. Exports of
  Demand for pollination services continues to increase with
                                                                                                                  queen bees increased by 74 percent to 2,730 individual bees in
  ongoing expansion in several horticulture sectors including
                                                                                                                  2018/19.
  apples, avocados, kiwifruit, cherries and blueberries. Prices
  per hive in 2018/19 remained similar to the prior year apart                                                    In contrast, bumblebee shipments to the Maldives reduced to
  from some price increases for covered cherry crops. Paid                                                        4,800 in 2018/19, down from 11,800 last season. This is likely
  pollination services could see an increasing supply of hives                                                    due to the exporter reducing the volume of bumblebees sent
  in coming years as some beekeepers look to diversify their                                                      in each consignment without a corresponding increase in the
  income stream in the wake of lower honey prices.                                                                number of consignments. Export consignment sizes were
                                                                                                                  reduced due to challenges with flight logistics. Bumblebees
                                                                                                                  are mainly used to pollinate crops grown in greenhouses.

  FIGURE 2: NEW ZEALAND EXPORTS OF LIVE BEES1, 2007 TO 2019
                                   40,000
                                                   One kilogram packages2                         Queen bees
                                   35,000

                                   30,000
Number of queen bees or packages

                                   25,000

                                   20,000

                                   15,000

                                   10,000

                                   5,000

                                        0
                                            2007     2008     2009       2010      2011     2012       2013     2014     2015    2016      2017         2018     2019
                                                                                                 Year ended 30 June

  Notes
  1 Honey bees only. A small but increasing number of bumblebees are also exported.
  2 A package of bees generally consists of 1 kilogram of bees housed within a ventilated cardboard tube or a cardboard and wire screen box about the size of a
  shoe box. The package may hold a supply of sugar syrup and a queen bee in a cage. All packages and the majority of the queen bees go to Canada.
  The exporting season is late February to May.
  Source: AsureQuality Limited.

  TABLE 6: NEW ZEALAND EXPORTS OF BEESWAX, 2007 TO 2019

  YEAR ENDED 30
                                                     2007       2008        2009       2010          2011      2012      2013     2014       2015          2016         2017    2018     2019
  JUNE
  Export volume
                                                        178       106           139       138          160        169      180      148           118           27        24        7         18
  (tonnes)
  Export value ($
                                                       1.40       1.01          1.36      1.21         1.45      1.59     1.85      1.71      1.57             0.46      0.51     0.14    0.41
  million fob1)
  Note
  1 Free on board.
  Source: Statistics New Zealand.

  MINISTRY FOR PRIMARY INDUSTRIES                                                                                                                                         2019 APICULTURE 7
Propolis                                                          in storage and a decline in disposable income amongst
Propolis is a resin collected by bees from some tree species      several beekeepers. The supply of beeswax, while stable
and marketed as a dietary supplement.                             overall, is at much lower levels per hive than was the case
Beekeepers gather propolis off special mats placed in hives       historically. This has occurred due to changes in the honey
or by scraping boxes and frames. Propolis in this form is         extraction processes via the foregoing of uncappers in favour
regarded as raw propolis as it contains some beeswax (the         of prickers which reduces the amount of wax removed from
proportion varies throughout the season) as well as other         the frames during the extraction process. Additionally,
contaminants such as parts of bees. Pure propolis is the          beekeepers are less inclined to recover and process wax
processed product that has been separated from beeswax            from their own operation via scraping top bars, etc. as this
and other contaminants.                                           requires investment in time and machinery better utilised in
                                                                  other parts of the business.
The recovery rate of pure propolis from raw propolis is
approximately 37 to 47 percent early in the season. This          Export volumes of beeswax in the year to 30 June 2019
decreases to 15 to 25 percent recovery when the nectar            increased from 7 to 18 tonnes (Table 6). Export prices for
flow is on as bees add more wax to the propolis when honey        beeswax increased in 2018/19 to $23.15 per kilogram, up
is being produced. Beekeepers reported receiving similar          from $21.20 last season.
prices in 2018/19 to last season for the raw unprocessed          Sale of bee colonies and hives to other beekeepers
product ($54 to $197 per kilogram depending upon likely           Despite increasing hive numbers, prices paid for bee
recovery rate), with quotes of up to $380 for the pure product.   colonies dropped this season due to a decline in demand
While the demand for propolis products on the international       for whole hives (Table 7). Peak prices of $850 per hive have
market remains strong, particularly in Asian markets, some        been reported, down from $1,000 per hive last year, likely
New Zealand exporters are sourcing propolis from other            influenced by reduced profitability from lower honey prices.
countries for direct supply to market. This may reduce            Typically, beekeepers buy nucleus colonies (nucs) that
local demand (and possibly the price offered) in the coming       generally consist of five frames of bees and three frames of
seasons.                                                          brood and a laying queen, or single box hives that consist
Royal jelly and beeswax                                           of eight to ten frames of bees and six frames of brood with
Royal jelly is a substance secreted by the bees and fed to        a laying queen. Prices dropped significantly in 2018/19, and
the developing queen larvae. Royal jelly is collected by          units ranged in price from $140 to $380 with the higher
beekeepers, typically via dedicated hives, and marketed as a      prices received earlier in the season. Much of the increase in
health supplement. Royal jelly processing facilities decided      hive numbers in 2018/19 was related to beekeepers splitting
not to operate in 2018/19 due to a surplus of stock.              existing stock rather than buying new hives.
The domestic demand for foundation wax or wax for coating
plastic frames declined due to large numbers of frames

8 2019 APICULTURE
HONEY EXPORTS                                                                                The increase in bulk honey exports in 2018/19 may be
                                                                                             a reflection of beekeepers looking for alternative sales
New Zealand honey exports maintained good prices
                                                                                             channels as a result of reducing demand for bulk honey by
New Zealand exports of pure honey1 in the year to 30 June
                                                                                             New Zealand based packers. Exporting honey in bulk also
2019 totalled 8,065 tonnes, down 7 percent from last year
                                                                                             gives increased packaging flexibility.
(Table 1). Revenue was up by 2 percent on the previous year
to $355 million despite the fall in export volume, driven by a                               New Zealand honey exports by honey type – July to
higher average export price (up by 10 percent).                                              December 2019
The United Kingdom displaced the United States as the                                        New export codes were introduced from 1 July 2018 to
largest destination for New Zealand honey exports in the                                     capture honey exports by three floral types: monofloral
year to June 2019, with an increase in export volume of                                      mānuka, multifloral mānuka, and non-mānuka honeys. A
12 percent to 1,622 tonnes (Figure 3). Exports to the United                                 review of the new codes in early to mid-2019 indicated that
States dropped by 44 percent to 1,047 tonnes, making the US                                  industry needed more assistance with implementation. Now
the fourth largest export destination for New Zealand honey                                  that more assistance has been provided, the data is deemed
behind the UK, China and Australia.                                                          to be more reliable, particularly since the beginning of July
                                                                                             2019. Therefore, it is feasible to explore the data for honey
Bulk honey exports (honey in drums) almost doubled in the
                                                                                             exports by honey type at a more detailed level for the six-
year to June 2019 to 1,733 tonnes, up from 892 tonnes in the
                                                                                             month period from 1 July 2019 to 31 December 2019.
prior year. This translates into an increase in the proportion
of honey exported in bulk from 10 percent to 21 percent, a
similar magnitude to five years ago (Figures 4 and 5). The
United Kingdom and Japan were the top destinations for
New Zealand bulk honey exports in 2018/19, accounting for
38 percent and 11 percent, respectively. Bulk honey exports to
Canada, China and Australia, previously small markets, also
increased (Figure 5).

 FIGURE 3: NEW ZEALAND PURE HONEY1 EXPORTS BY DESTINATION, 2007 TO 2019
                         10,000
                          9,000
                                                                                                                                             Rest of the world
                          8,000
                                                                                                                                             Singapore
                          7,000                                                                                                              Japan
Export volume (tonnes)

                          6,000                                                                                                              United States
                          5,000                                                                                                              Australia
                          4,000                                                                                                              EU (excl. UK)
                          3,000                                                                                                              United Kingdom
                          2,000                                                                                                              China

                          1,000                                                                                                              Hong Kong

                             0
                                  2007   2008   2009   2010   2011   2012     2013    2014     2015    2016    2017      2018      2019
                                                                        Year ended 30 June

 Note
 1 New Zealand honey is mainly exported as pure honey in retail packs and in bulk. Comb honey and honeydew are also included in pure honey
 exports, but typically account for less than 10 percent of total export volumes. The data shown is for pure honey exports only.
 Source: Statistics New Zealand.

MINISTRY FOR PRIMARY INDUSTRIES                                                                                                              2019 APICULTURE 9
New Zealand exported 4,587 tonnes of honey in the six month                                                            the non-mānuka honey exported in the six month period.
period between July and December 2019. Around half of this                                                             The average export price for all honey for the period July to
honey (2,166 tonnes) was monofloral mānuka honey in retail                                                             December 2019 was $40.62 per kilogram. For the first time,
packs (Figure 6). Total bulk honey exports for the six months                                                          data is now available for honey export prices by floral type
to December 2019 was 805 tonnes (Figure 6), and the key                                                                (Figure 8). The average export prices (NZ$ per kilogram) for
export markets were the United Kingdom (40 percent), China                                                             honey by floral type were:
(14 percent), and Germany (11 percent).                                                                                • $54.67 for monofloral mānuka honey
The United States was the top export market for monofloral                                                             • $29.57 for multifloral mānuka honey
mānuka honey, followed by China and Japan (Figure 7). The                                                              • $20.46 for non-mānuka honey.
top markets for multifloral mānuka honey were the United
Kingdom, China and Australia. China took almost 40 percent of

        FIGURE 4: NEW ZEALAND PURE HONEY1 EXPORTS BY PRODUCT TYPE (EXTRACTED HONEY), 2007 TO 2019

                                                                           Pure honey, in bulk             Pure honey, in retail packs
                                                           8,000
                                                           7,000
                                  Export volume (tonnes)

                                                           6,000
                                                           5,000
                                                           4,000
                                                           3,000
                                                           2,000
                                                           1,000
                                                               0
                                                                   2007   2008    2009      2010    2011      2012     2013     2014     2015   2016   2017   2018        2019
                                                                                                          Year ended 30 June
        Note
        1 New Zealand honey is mainly exported as pure honey in retail packs and in bulk. Comb honey and honeydew are also included in pure honey exports, but
        typically account for less than 10 percent of total export volumes. The data shown is for pure honey exports in retail packs and in bulk.
        Source: Statistics New Zealand.

                  FIGURE 5: NEW ZEALAND BULK PURE HONEY1 EXPORTS BY DESTINATION, 2012 TO 2019

                                     2,000

                                                                                                                                                              Belgium
                                     1,500
         Export volume (tonnes)

                                                                                                                                                              Australia

                                                                                                                                                              China

                                     1,000                                                                                                                    Canada

                                                                                                                                                              Japan

                                                                                                                                                              United Kingdom
                                                  500
                                                                                                                                                              Other countries

                                                           0
                                                               2012       2013       2014          2015         2016          2017       2018      2019
                                                                                                    Year ended 30 June
                  Note
                  1 The data shown is for pure honey exports, exported in bulk.
                  Source: Statistics New Zealand.

10 2019 APICULTURE
FIGURE 6: NEW ZEALAND PURE HONEY1 EXPORTS BY FLORAL AND PACKAGING TYPE, JULY TO DECEMBER 2019
2,500
9% 203 Retail honey
2,000
Bulk honey
1,500
Export volume (tonnes) 91% 2,166 26% 326
1,000
28% 276
500 74% 911
72% 693
0
Monofloral mānuka Multifloral mānuka Non-mānuka
Note
1 New Zealand honey is mainly exported as pure honey in retail packs and in bulk. Comb honey and honeydew are also included in pure honey exports, but these honeys are
not categorised by floral type.
Source: Statistics New Zealand.
FIGURE 7: NEW ZEALAND PURE HONEY1 EXPORTS BY FLORAL TYPE BY DESTINATION, JULY TO DECEMBER 2019
Hong Kong
China
United Kingdom
EU (excl. UK)
Monofloral mānuka
Australia
Multifloral mānuka
United States
Non-mānuka
Japan
Singapore
Rest of world
0 200 400 600 800 1000 1200
Export volume (tonnes)
Note
1 New Zealand honey is mainly exported as pure honey in retail packs and in bulk. Comb honey and honeydew are also included in pure honey exports, but these honeys are
not categorised by floral type.
Source: Statistics New Zealand.
FIGURE 8: NEW ZEALAND MONTHLY PURE1 HONEY EXPORT VOLUMES AND PRICES BY HONEY TYPE, JULY TO DECEMBER 2019
Monofloral mānuka honey Multifloral mānuka honey Non-mānuka honey
Volume Price Volume Price Volume Price
600 60 600 60 600 60
500 50 500 50 500 50
Export price ($ per kilogram)
Export price ($ per kilogram)
Export price ($ per kilogram)
Export volume (tonnes)
Export volume (tonnes)
Export volume (tonnes)
400 40 400 40 400 40
300 30 300 30 300 30
200 20 200 20 200 20
100 10 100 10 100 10
0 0 0 0 0 0
Jul Aug Sep Oct Nov Dec Jul Aug Sep Oct Nov Dec Jul Aug Sep Oct Nov Dec
2019 2019 2019
Note
1 New Zealand honey is mainly exported as pure honey in retail packs and in bulk. Comb honey and honeydew are also included in pure honey exports, but these honeys are
not categorised by floral type.
Source: Statistics New Zealand.
MINISTRY FOR PRIMARY INDUSTRIES 2019 APICULTURE 11OPERATING COSTS (TABLE 7) Fuel
With the sharp decline in honey prices leading to lower revenue While many beekeepers are reassessing the profitability of
for most beekeeping businesses, owners and managers are remote sites, with some abandoning those where servicing
actively looking at opportunities to reduce expenses. While cost are particularly high, fuel remains a major expense.
there are some areas where savings can be made reasonably Fortunately, many beekeeping enterprises are operating a
easily, in others it means fundamental changes to the way relatively young, fuel efficient vehicle fleet, attributed to a run
businesses are operated. of profitable years prior to the fall in honey prices in 2018.
Sugar Labour
Beekeepers paid between $730 and $1,500 per tonne dry The downturn in profitability has impacted owners and
weight for sugar in 2018/19. The large ranges in prices is workers. Some beekeepers, in particular in the small
influenced by the volume of sugar purchased, and whether the commercial category3, have been forced to return to full time
sugar syrup is inverted sugar syrup2 or not. Sugar remains a employment, in particular in the construction and related
significant cost to commercial beekeeping businesses and, industries, turning their beekeeping business into a part time
with the density of hives in some areas placing pressure on job, as it can no longer support a full time owner-operator.
wintering sites, is not an area where savings can easily be There have also been reports of staff redundancies and/or
made, short of leaving honey on the hives. seasonal contracts not being renewed, whilst some beekeeping
Beekeepers typically buy sugar in a ready mixed liquid form to businesses have had to refinance in order to pay wages and
avoid purchasing the equipment required to mix large batches, retain staff.
and to allow their beekeeping staff to focus on the core Site rentals
business of hive and crop management. Beekeepers continue The average price paid for apiary site rentals remained stable
to exercise caution around the use of sugar in beehives as for mānuka sites over the 2018/19 season, but came down for
many export markets routinely test for sugar adulteration in sites deemed capable of only producing multifloral mānuka
honey. honey. This is despite competition for sites increasing in
intensity, in particular in the North Island.
Laboratory testing costs
Laboratory testing of honey is emerging as a significant cost
for beekeeping businesses. Many beekeepers that sell honey
destined for markets that require official assurance for export
eligibility need to pay for tests to be performed at a recognised
laboratory. The most common and required tests are for (i)
the detection and quantification of the level of tutin in honey,
and (ii) the confirmation of honey as monofloral or multifloral
mānuka honey, or non-mānuka honey. Other tests routinely
undertaken are to determine C4 sugar concentrations and
tests for glyphosate levels, and in addition for mānuka honey,
industry grading systems such as UMF®, MGO™ or equivalent.
2 Inverted or invert sugar is a mixture of glucose and fructose. Invert sugar is
usually fed to bees as a syrup, based on the understanding that simple sugars 3 The small commercial beekeeper category are typically single beekeeper opera-
(glucose and fructose) are easier for bees to digest than more complex sugars such tions, without any full time staff. The number of hives managed ranges from 250 to
as sucrose. 800 hives.
12 2019 APICULTURETABLE 7: ESTIMATED EXPENDITURE FOR BEEKEEPING OPERATIONS¹, 2015 TO 2019
YEAR ENDED 30 JUNE 2014/15 2015/16 2016/17 2017/18 2018/19
Worker2 $ per hour 16-33 16-35 16-36 17-35 21-28
Manager $ per hour 28-75 30-75 30-75 30-75 30-75
Labour Average working week hours 45 45 45 45 45
Average ratio of hives per fulltime equivalent (FTE) with
varroa hives:FTE (pre-varroa) 350:1 (800:1) 350:1 (800:1) 350:1 (800:1) 350:1 (800:1) 350:1 (800:1)
present in the hives
Fuel Fuel (dependant on world price and exchange rate) Variable
Bulk sugar (variable depending on overseas prices and NZ
Sugar $ per tonne 758-1,044 789-1,009 960-1,400 800-1,400 730- 1,500
exchange rate)
Varroa treatment (variable according to hive strength and
$ per hive 22-35 27-31 27-34 17-44 15-18
product(s) used)
Varroa treatment
Varroa strips (applied at recommended rates, two
$ per 1000 plus strips 22-35 23-25 23-27 23-29 23-29
treatments per year)
Protein supplements Hives may require 1–2 kilograms per year $ per 20 kilogram bag 155-163 162-182 160-182 157-209 195 - 209
Extraction of mānuka honey (costs more as the frames
Contract extraction must be pricked first to release the honey) $ per frame 1.06-2.25 1.20-2.25 1.50-2.25 1.50-2.50 1.50
costs
Extraction of clover honey $ per frame 0.60-1.50 0.60-1.50 1.00-1.50 1.10-1.50 1.10 - 1.50
Perfect condition hive, includes 2 brood boxes, floor, lid
$ per hive 226 201 217-235 210-350 230-330
and 1 honey super, no bees, assembled and paraffin waxed
Reasonable condition hive, includes 2 brood boxes and
1-4 honey boxes with bees (including valuations as part of $ per hive 600-1,000 780-2,000 700-1,500 1,000-2,000 500-800
business sale)
Hives Reasonable condition single brood nest hive (no supers) $ per hive 300-400 560-800 400-600 300-600 390-420
4-5 Frame nucleus hive; new hives includes nuclei box $ per hive 150-260 200-300 275-300 100-350 180-315
Repairs and maintenance, 7% of hive purchase price $ per hive 28-42 28-42 28-42 30-44 30-45
Wax to coat plastic frames $ per kilogram 14-16 … … … …
Hive Strappers, used as required $ per unit 7-11 8-12 6-13 6-14 7-12
Queen bees $ per bee 30-65 30-40 14-80 20-80 14-75
Bees
Select breeder queens $ per bee 1,000-1,638 900-1,700 600-2,000 3,000-5,000 ...
Protective clothing $ per suit 139-189 137-169 138-189 159-217 124-229
New or re-manufactured honey drum (holds approximately
Honey drums $ per drum 79-100 60-79 64-100 65-100 75
300kg of honey)
$ per hive 50-130 75-150 50-250 50-400 50-250
Mānuka sites (rental is paid either as a per hive $ per apiary 500-1,000 500-1,000 500-1,000 500-1,400 500-1,400
Apiary rentals paid rate, percentage of crop when sold or a combination of % of crop 10-30 10-45 10-45 10-45 20-30
to landowners both)
$25-60 $60-100 $50-100 $50-150 $50-150
$ per hive + % of crop
10-38% 10-40% 10-40% 10-40% 10-40%
Non-Mānuka sites grams per hive Variable, often 500
$ per audit for a processing up to 1,350 up to 1,400 up to 1,500 up to 1,600 up to 1,725
Risk Management Programme (RMP) annual audit costs RMP
$ per audit for a storage RMP up to 795 up to 895 up to 1,000 up to 1,000 up to 1,200
MPI Food Safety annual fees $ if require export eligibility 590 … 1,005.70 1,005.70 1,005.70
$ application fee n/a n/a 135.00 135.00 135.00
MPI Beekeeper Listing
$ renewal fee n/a n/a 77.50 77.50 77.50
$ per eligible document up to 67 up to 70 up to 70 up to 70 up to 75
Compliance costs
Auditing of electronic certificates $ per month auditing 10% of up to 67 up to 70 up to 70 up to 70 up to 75
eligibility declarations raised
$ per sample (first sample) 90-125 80-125 80 60-90 60-90
Tutin tests $ per composite (up to 10 10-15 10-15 10 15-17 22
samples can be composited)
$ per beekeeper 20 20 20 20 20
American Foulbrood Pest Management Plan Levy
$ per apiary 14 14 15.17 15.17 15.17
86.25 or
Non-Commercial (1-25 hives) Annual subscription n/a 86.25 86.25 86.25
115.00
Base fee n/a 172.50 172.50 172.50 172.50
Commercial (26+ hives)
$ per hive n/a 1.15 1.15 1.15 1.15
Beekeeping Clubs Annual subscription n/a 230 230 230 230
Apiculture
New Zealand Base fee n/a 172.50 172.50 172.50 172.50
Packers and Processors
$ per kilogram of production n/a 0.0345 0.0345 0.0345 0.0345
Base fee n/a 172.50 172.50 172.50 172.50
Health Product & Food Manufacturers
$ per kilogram of production n/a 0.115 0.115 0.115 0.115
Affiliate Industry (e.g: supply companies etc) Annual subscription n/a 460 460 460 460
Notes
… Data not available.
n/a Not applicable.
1 Expenses are exclusive of GST.
2 The highest hourly rates for workers will involve supervisory and some management responsibilities.
Source: AsureQuality Limited.
MINISTRY FOR PRIMARY INDUSTRIES 2019 APICULTURE 13TABLE 8: MPI-FUNDED APICULTURE AND HONEY PROJECTS
HIGH-PERFORMANCE MĀNUKA PLANTATIONS (ended 30 September 2018; Final Report available)
This Primary Growth Partnership Programme led by Mānuka Research Partnership (NZ) Limited aims to move mānuka honey
production for medical use from wild harvest to science-based farming of mānuka plantations. Combining improved genetics
with optimum husbandry practices could enable significant gains for New Zealand’s mānuka honey industry.
https://www.mpi.govt.nz/funding-and-programmes/sustainable-food-and-fibre-futures/primary-growth-
partnership/completed-pgp-programmes/high-performance-manuka-plantations/
VARROA ELIMINATION UNITS
The parasitic mite Varroa destructor has caused significant damage to New Zealand’s honey production since 2000. The
mite infestation in hives severely impacts the health of honey bees. This eventually leads to the loss of honey bee colonies.
Conventional chemical treatment involves placing miticide strips into the hive (miticide is insecticide for mites). However,
strips do not deliver consistent and adequate dosage throughout the hive and their effectiveness is impacted by various factors
e.g. wind, venting, temperature, humidity and other factors. The purpose of this project is to design, build and test a number
of prototype Varroa elimination units (VEU). The VEU is a new device that is placed into the hive. It measures the amount of
miticide circulating within the hive (using sensors) and automatically releases an appropriate dosage to ensure that a suitable
level of miticide remains continuously within the hive.
https://www.agriculture.govt.nz/funding-and-programmes/sustainable-food-and-fibre-futures/current-
sff-futures-projects/
OPPORTUNITIES OF SHELTERBELTS IN FARMING SYSTEMS (in progress)
This project will investigate the benefits, opportunities and challenges of shelterbelts in pastoral systems and support their
further adaptation.
TREES FOR BEES: BUILDING BEE CAPACITY FOR SUSTAINABLE RURAL GROWTH (in progress)
Building bee capacity by training people to plant for bees, enabling nurseries to supply bee plants and providing tools to design
bee plantations.
http://www.treesforbeesnz.org/home
SUSTAINABLE TREES FOR BEES: STRATEGIC BEE PLANTATIONS FOR POLLINATION AND HONEY (completed September 2019)
FOOD AND FIBRE The aim of this project is to support the development of the wider agricultural sector to achieve sustainability and growth
FUTURES targets, through increased honey and related medical product exports, and by improved pasture, horticulture and arable
(includes existing and crop pollination helping drive growth. This will be achieved by having healthy and thriving bee populations through focussed
recently completed research on floral pollen and nectar sources that meet bee nutrition requirements at the right time and in sufficient quantity,
projects set up under and strategic bee plantations that enable apiarists, farmers and landowners to ensure year-round bee feed supplies. These
the Primary Growth outcomes will be delivered through demonstration farms, workshops and field days and employ a suite of extension tools
Partnership and developed during the project.
Sustainable http://www.treesforbeesnz.org/home
Farming Fund)
TREES FOR BEES: PRODUCING ABUNDANT BEE POLLINATORS FOR SUSTAINABLE FARMING (completed February 2017)
This project aims to increase the number of strong, healthy honey bees to ensure pollination services for agricultural crops.
In many areas, pollen and nectar sources are being removed leading to poor nutrition for bees. They become weakened,
malnourished and sometimes starving. To restore flowers for bees we are installing demonstration plantations of trees and
shrubs to show how to supply a steady source of high-protein pollen to support bee colonies. The result will be more bees for
pollination services leading to increased crop and pasture yields.
http://www.treesforbeesnz.org/home
ABATE: ACTIVE BACTERIOPHAGES FOR AFB ERADICATION (in progress)
American Foulbrood (AFB) is caused by a bacterial pathogen of honeybees, Paenibacillus larvae. Antibiotics use in hives is
prohibited in New Zealand and hives with signs of infection must be destroyed immediately. Bacteriophages (phages for short)
are simple viruses that kill specific bacteria. They are highly abundant, estimated at 1031 globally. Previous work abroad
indicates that our AFB pathogens in New Zealand are susceptible to destruction by a set of specific bacteriophages that thrive
in healthy hives and nearby soil. We will isolate native New Zealand phages for P. larvae. These will be completely sequenced to
determine if they are safe for use and can be combined to produce a bio-protective phage cocktail for field testing. This project
provides the groundwork study for an innovative approach to naturally protecting NZ beehives against AFB.
https://www.massey.ac.nz/massey/about-massey/news/article.cfm?mnarticle_uuid=07931996-67EA-
45BF-82FE-7587F3608127
PROJECT CLEAN HIVE (in progress)
American foulbrood (AFB) is a notifiable disease of the New Zealand honey industry. As the industry is expanding exponentially,
both through commercial businesses and hobbyists, increasing incidence of AFB is a growing risk. Otago and Southland
beekeepers have identified the opportunity available to them to pilot some innovative solutions. This project will run a pilot
study to test whether the current testing methods can be calibrated with the proposed new tests (qPCR and detection dogs) to
provide cost effective tools for detection and management of AFB at the pre-clinical stage. If successful, this will provide
new opportunities for improved disease identification and control of AFB to help prevent the impact and spread of a notifiable
disease. The pilot study outcomes and the lessons learned will be shared with the wider industry.
COMBATING THE GIANT WILLOW APHID (completed July 2019)
Willows are highly valued in New Zealand as early season nectar and pollen sources critical to the spring growth of honeybee
colonies, and for soil erosion control and riverbank stabilisation. The giant willow aphid (GWA), an invasive exotic species
first reported in New Zealand in December 2013, is now found throughout New Zealand and is causing a cascading series of
impacts. Infestation causes tree stress that reduces willow health and productivity. Aphids secrete large quantities of honeydew,
rich in melezitose sugar that is readily collected by bees and introduced vespulid wasps. Melezitose-enriched honey crystallises
within the hive, resulting in a significant volume of honey being either rendered non-extractable or tainted by the melezitose.
This programme responds to an urgent widespread need from various industry groups by tackling three areas: 1) the economic
impact of GWA, 2) identifying GWA resistant willow cultivars, and 3) determining options for biological control of GWA.
14 2019 APICULTUREALTERNATIVE POLLINATORS FOR SEED PRODUCTION (in progress)
This project aims to develop managed fly species that can be mass reared to provide sufficient and predictable pollination to a
range of field and covered crops to maximise economic yields.
CLASSICAL BIOLOGICAL CONTROL FOR VESPULA WASPS – Phase II (in progress)
Vespula wasps are a serious invasive pest throughout New Zealand, causing direct economic losses and putting labourers
at risk in various primary sectors. Biocontrol can offer a sustainable large-scale long-term control solution to complement
current and future methods. This project will explore the potential of natural enemies, import the proposed parasitic flies, test
their safety, apply to the EPA for release approvals and if approved, make initial releases.
http://www.landcareresearch.co.nz/science/plants-animals-fungi/animals/invertebrates/invasive-
invertebrates/wasps/wasp-biocontrol-updates
A COLLABORATIVE INDUSTRY APPROACH TO REDUCE THE THREAT OF PAs IN HONEY Phase 2: Risk modelling and
mitigation in the supply chain (in progress)
The presence of pyrrolizidine alkaloids (PAs) in honey represents a food safety and market access threat. Building on a
previous Sustainable Farming Fund project, this project will identify mitigation strategies and a potential testing regime that is
appropriate for the industry to continue to grow its international presence and position. A proactive response and industry self-
regulation will ensure that New Zealand honey is positioned to meet any future national and international regulations related
to PAs and that market access is not limited, and that the public perception of New Zealand honey continues to be ‘honey is
healthy for you’.
ON-GOING RESEARCH ON THE MĀNUKA HONEY DEFINITION
New Zealand Food Safety continues to work collaboratively with stakeholders within the Apiculture Industry with regards to
mānuka honey. Several projects funded through MPI’s Operational Research Programme are underway, aimed at ensuring
the regulatory definition for mānuka honey remains fit for purpose. The first study aims to improve our understanding of
the influence sampling techniques may have on obtaining representative test results for the attributes in the mānuka honey
definition. The outputs will be used to provide clearer guidance for the honey industry when taking samples of honey for testing
to meet the definition. The study will finish by April 2020. Of particular note is the pilot project to establish a national honey
reference collection. New Zealand Food Safety is now in the second year of collecting honey samples and this is a continuation
of a pilot trial conducted in 2018/19 which tested initial protocols. The second year will build on the lessons learned from the
pilot trial. Industry has provided valuable input to these projects in the design phase.
APIWELLBEING PROJECT
The ApiWellbeing project is a continuation of the Bee Pathogen Programme (see below), and is funded by MPI’s
Operational Research Programme and supported by the Management Agency for the National American Foulbrood Pest
Management Plan. The work increases our efforts in understanding the health of New Zealand honey bees, targeting
both exotic and endemic diseases and pests. Work areas include (1) developing new molecular tests for both endemic
and exotic pathogens; (2) sequencing the genomes of Paenibacillus larvae (the bacteria that causes American foulbrood
disease) to better understand genetic diversity and understand disease-types and how clusters of disease may be linked;
(3) creating an array of online resources and guidelines to enhance bee biosecurity; and (4) establish a national collection
of bees and data for further research opportunities.
https://www.biosecurity.govt.nz/protection-and-response/readiness/bee-biosecurity/apiwellbeing/
BEE PATHOGEN PROGRAMME (completed)
OTHER MPI The Bee Pathogen Programme is the most detailed cohort study ever conducted in New Zealand, funded by Operational
FUNDED Research Funds by the Ministry for Primary Industries. The same 60 apiaries were followed from September 2016 to
PROJECTS March 2019. This programme is discovering (i) how common pests and diseases are in New Zealand apiaries using
international best practice sampling and analysis protocols, (ii) new evidence-based protocols for sampling and testing
pests and diseases in New Zealand honey bees, (iii) how apiary management is affecting varroa mite counts, trypanosome
infection levels, AFB incidence, and the prevalence of Nosemas and viruses in New Zealand apiaries, and (iv) the relative
influence of these pathogens on hive productivity and colony survival.
https://www.biosecurity.govt.nz/protection-and-response/readiness/bee-biosecurity/bee-pathogen-
programme/
NEW ZEALAND COLONY LOSS SURVEY 2015 (completed)
Funded by the National Beekeepers Association of New Zealand, Federated Farmers Bee Industry Group, Agcarm and the
Ministry for Primary Industries.
https://www.mpi.govt.nz/protection-and-response/readiness/bee-biosecurity/bee-colony-loss-survey/
NEW ZEALAND COLONY LOSS SURVEY 2016 and 2017 (completed)
A continuation of the 2015 New Zealand Colony Loss Survey (see above) and funded by the Ministry for Primary Industries.
Specifically addresses the differences between regional rates of colony losses.
https://www.mpi.govt.nz/protection-and-response/readiness/bee-biosecurity/bee-colony-loss-survey/
NEW ZEALAND COLONY LOSS SURVEY 2018 and 2019 (completed)
A continuation of the 2015, 2016 and 2017 New Zealand Colony Loss Survey (see above) and funded by the Ministry for
Primary Industries. Specifically addresses the presence of any statistically significant trends in colony losses over the five
years to date.
https://www.mpi.govt.nz/protection-and-response/readiness/bee-biosecurity/bee-colony-loss-survey/
MINISTRY FOR PRIMARY INDUSTRIES 2019 APICULTURE 15INFORMATION ABOUT THE Surveys record honey crop information based on the
beekeeper enterprise location, not apiary (or hive)
REPORT locations. This means that honey production information
is recorded against where the honey is extracted,
This report was developed from information gathered through
surveys completed by beekeepers, honey packers and not harvested. Therefore, with an increasing trend of
exporters and augmented with a review of export documents, migrating hives long distances to harvest mānuka, in
published reports and publically available data from Statistics particular in the North Island, honey production is being
New Zealand. reported for the North Island and South Island only.
Aggregated data on the number of registered beekeeping The data recorded in the surveys are extrapolated to
enterprises, apiaries and hives under the National American provide an estimate of national honey production, price
Foulbood Pest Management Plan are reported with the ranges for honey and honey products, and expenses for
permission of the Management Agency for the National beekeeping operations.
American Foulbrood Pest Management Plan.
Honey production, price and expenses figures are based on a For more information please contact
survey of a range of beekeeping enterprises that account for annette.carey@mpi.govt.nz
approximately 30 percent of registered hives in New Zealand.
The survey is administered by AsureQuality Limited during
their annual Risk Management Programme audits and/or hive
audits, and via targeted interviews.
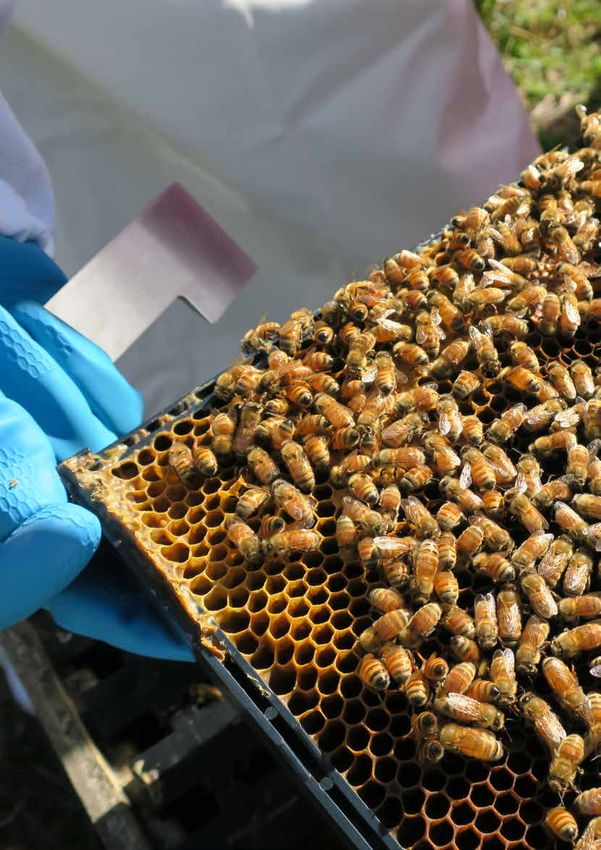
Photos: Thanks to Dr Richard Hall for
providing photos on pages 1,4 and 9.
Ministry for Primary Industries Disclaimer
PO Box 2526, Wellington 6140, New Zealand The information in this report by the Ministry for Primary
Freephone 0800 00 83 33 Industries is based on the best information available to the
Email: brand@mpi.govt.nz the Ministry at the time it was drawn up and all due care
was exercised in its preparation. As it is not possible to
Web: www.mpi.govt.nz
foresee all uses of this information or to predict all future
ISBN No. 978-1-99-002539-6 (Print) developments and trends, any subsequent action that relies
ISBN No. 978-1-99-002538-9 (Online) on the accuracy of the information in this report is the sole
© Crown copyright June 2020 commercial decision of the user and is taken at his/her
– Ministry for Primary Industries own risk. Accordingly, the Ministry for Primary Industries
disclaims any liability whatsoever for any losses or damages
arising out of the use of this information, or in respect of any
actions taken.
16 2019 APICULTUREYou can also read


