MARKET REPORT 2018 2019 - Wynwood
←
→
Page content transcription
If your browser does not render page correctly, please read the page content below
MARKET REPORT
2018–2019
Shinola opened their first Florida location in Wynwood and is known for
their Detroit-built watches, bikes, journals and leather goods.

The Wynwood Business Improvement
District (BID) is pleased to present this
report outlining the analysis and results of
an independent study conducted by Integra
Realty Resources (IRR) of the multifamily,
office and retail commercial real estate
market conditions for the Wynwood BID
market area of Miami.

                                       W YNWOOD MARKE T REPORT | 3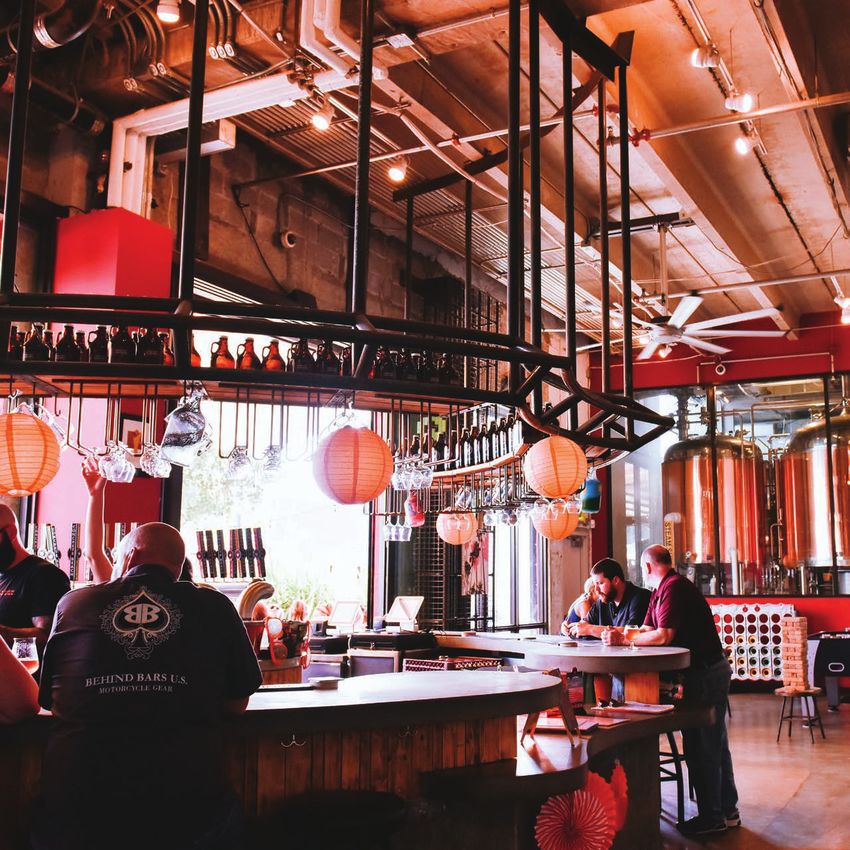
WYNWOOD BID MARKET AREA

IRR has conducted relevant market research to develop a market report covering the retail, office and multifamily markets
of the Wynwood Business Improvement District (BID) based on the boundaries as defined by the Wynwood BID map on
the following page. The study provides trends for each property class identified in terms of rental rates, occupancy rates,
and space absorption of the existing and proposed supply. The study also includes relevant metrics for under construction,
planned, and proposed projects and comments on the likelihood of development as well as the expected impact on
neighborhood metrics such as rental rates, occupancy, etc.

The 2018 Market Report covers the period January 2013–October 2018 on historical stats and trends and includes under
construction and proposed project details. Unlike prior studies, this report has detailed the timeframes for study, and
dated the report and data for future continuity.

The Wynwood BID market area contains a total of close to 3,900,000 square feet of improved building area, consisting
of retail, apartment, office, industrial, and flex space, approximately half of which can be still be categorized as industrial
space. In the past five years much of the area’s older industrial and flex space, remnants of the areas prior use as fashion
and garment district, has been repurposed for retail and art gallery space which now accounts for approximately 30% of
the improved buildings in Wynwood.

While the area has seen significant change over the past five years, the next five years will bring even greater change as
new construction is underway that will aid in Wynwood’s evolution. In next few years the total supply of buildings in the
BID area is projected to increase by 35% to around 5.3 million square feet as 1.4 million square feet under construction
is completed. An additional 1.75 million square feet of development is proposed for the area, though development will
depend on near-term demand and the neighborhoods staying power as a destination for both tourists and South Florida
residents alike.

FOR MORE INFORMATION ON THIS AND                  Anthony M. Graziano, MAI, CRE
OTHER REPORTS, PLEASE CONTACT:                    Senior Managing Director
                                                  IRR-Miami/Palm Beach
IRR-Miami/Palm Beach                              amgraziano@irr.com
Dadeland Centre
9155 S Dadeland Boulevard                         Charles E. Badell, MAI
Suite 1208                                        Managing Director
Miami, Florida 33156                              IRR-Miami/Palm Beach
305-670-0001                                      cbadell@irr.com

W YNWOOD MARKE T REPORT | 4
NE 1 S
NW 3RD AVE
A
NE 3 0
A E
NW 5TH AV
NW 30TH ST TH ST
NW 29TH ST
E
HTLIN
Y/BRIG
AILWA
NW 3RD AVE
NW 28TH ST
FEC R
NE 27TH ST
NW 27TH ST
W 27TH ST
VE
NW 1ST AV
NW 26TH ST NE 26TH ST
NW 26TH ST
N MIAMI AVE
NW 2ND AVE
NW 25TH ST
NE 25TH ST
NW 24TH ST
NE 24TH ST
NW 23RD ST
NW 23RD ST NW 23RD ST
NW 22ND LN
NE 23RD ST
NW 22ND ST
NW MIAMI CT
NW 22ND ST
NE 22ND ST
NW 22ND ST
W 21ST T ER
NE 21ST ST
NW 21ST ST
NW 21ST ST
VE
NE 1ST AV
NW 4TH CT
NW 1ST PL
VE
NW 20TH TER
NW 1ST AV
NE 20TH TER
NW 20TH ST
NAMED
T
AMI C
NE 19TH TER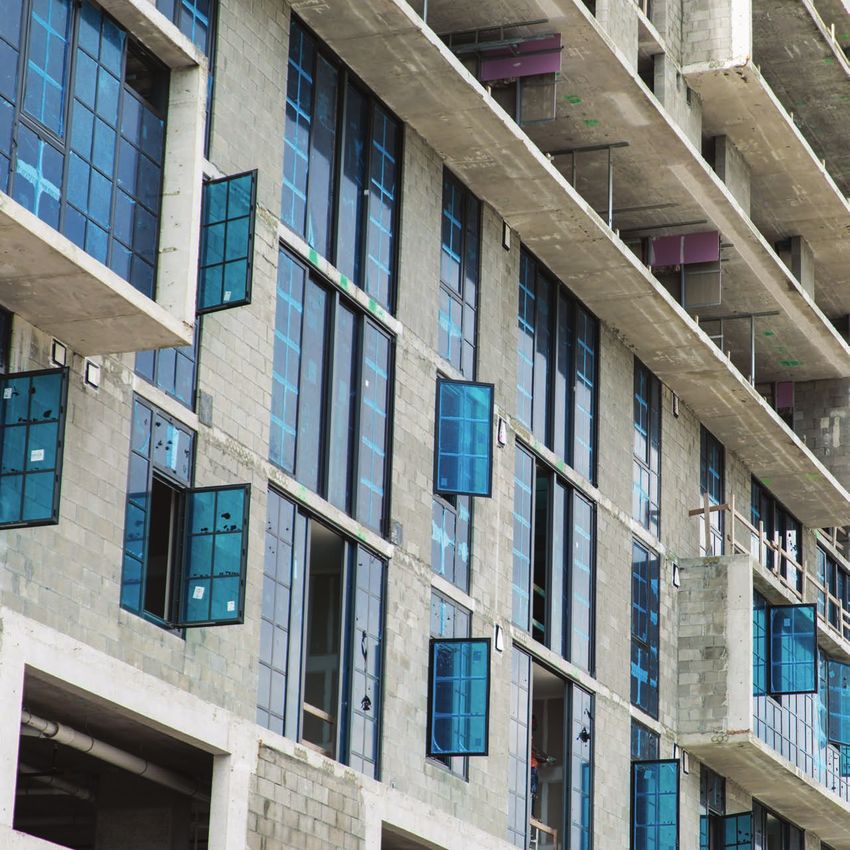
Wynwood is minutes away from Miami Beach, Downtown Miami, Miami
International Airport and steps from the Design District, Midtown and
Edgewater neighborhoods.
AREA OVERVIEW + KEY FINDINGS

• Both the multifamily and office inventory in the             construction. It’s possible the impact on daytime
  Wynwood BID market area are poised to double over          population will be even greater considering that new
  the next three years as projects that are currently        office buildings will have a greater percentage of
  under construction are delivered. The existing supply      co-working space.
  of office and multifamily properties in the Wynwood
                                                           • Full-time population will increase by 1,206 persons
  BID area includes no competitive Class A space.
                                                             based on delivery of 464 units under a market average
• Robust conventional multifamily growth will have a         of 2.6 persons per household. However, its likely that
  temporary impact on area vacancy until the market          actual population growth for the added multifamily
  has absorbed new inventory. Like other areas of Miami,     units will be lower given the smaller average unit sizes
  the new supply will not compete with existing 1950’s       compared to the rest of Miami’s general market..
  and 1960’s vintage existing apartment product.
                                                           • The added daytime and full-time population will
• The strong office growth will only have a temporary          impact the nature of some of the retail tenants, which
  impact on average area vacancy as new buildings will       currently cater mostly to a transient customer base.
  have a more traditional multi-story office design with
                                                           • The Wynwood BID Multifamily market comprises
  common areas and amenities as compared to existing
                                                             5.5% of the existing inventory in the Miami DDA market
  supply consisting largely of repurposed and typically
                                                             area, and the number of units under construction 8.5%
  under-parked warehouse space.
                                                             of the same area.
• Retail rents have retreated year-to-date 2018 after
                                                           • The Wynwood BID Office market comprises 1.25% of
  several years of strong growth. While rents have more
                                                             the existing inventory in the Miami DDA market area,
  than tripled since 2013, the retail rent equilibrium
                                                             though a significantly larger amount of office space is
  signals a competitive turning point in Wynwood’s
                                                             currently under construction in Wynwood.
  maturity as a dominant submarket in the greater
  Downtown Miami area.                                     • The Wynwood BID Retail market comprises 13.4% of
                                                             the existing inventory in the Miami DDA market area,
• Area brokers and property owners surveyed report
                                                             and 11.6% of the supply under construction. Retail
  the area is experiencing some retail tenant turnover
                                                             rents in Wynwood are amongst the top in Miami and
  resulting from the historically strong rent growth.
                                                             the area is expected to continue to outperform other
• Daytime population from office development under             area neighborhoods.
  construction will increase by 2,800 persons based
  on the 197,000 square feet of office space under

                                                                                        W YNWOOD MARKE T REPORT | 7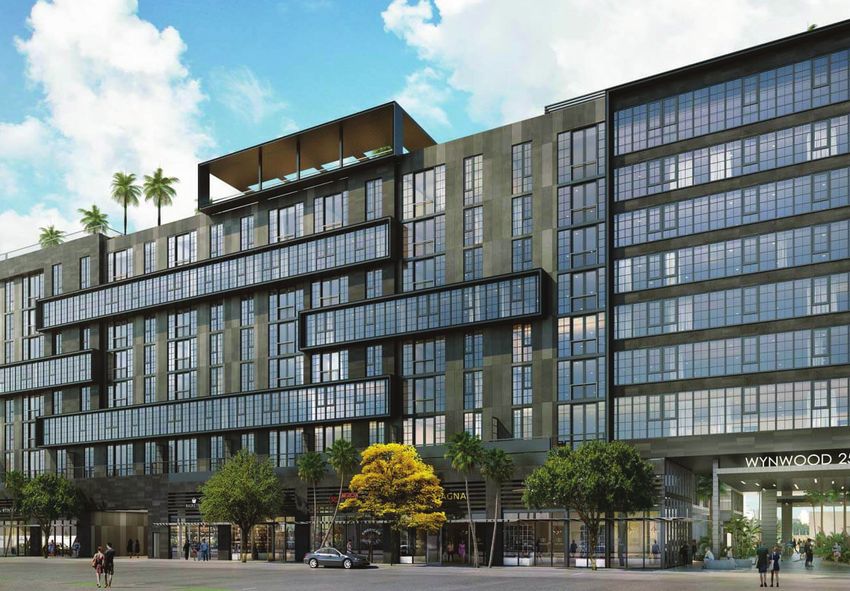

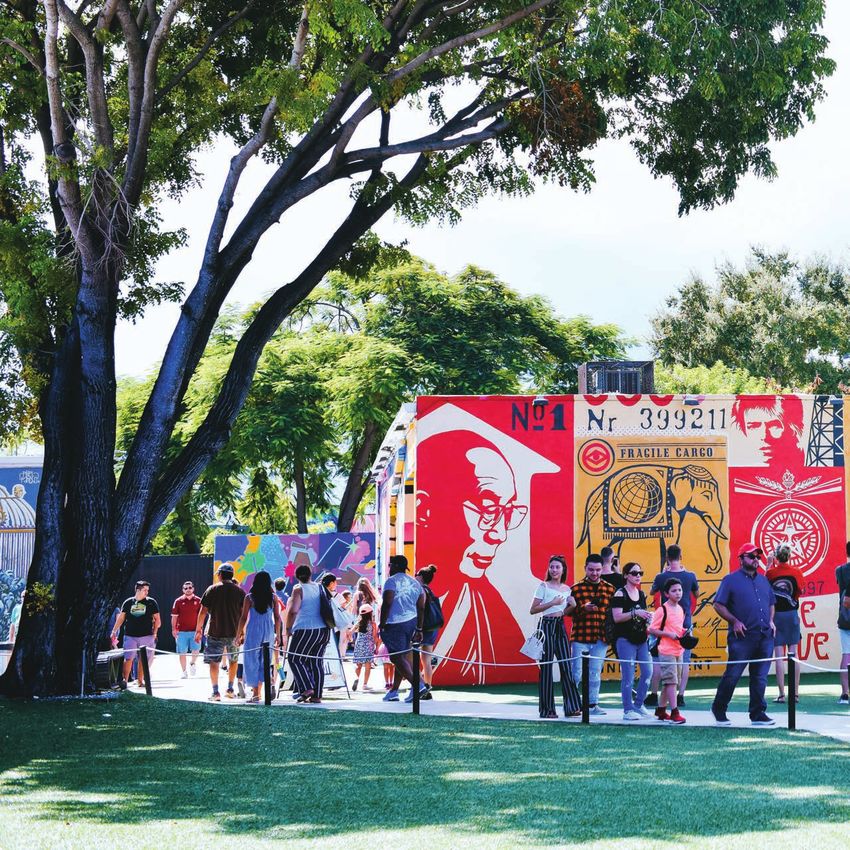
Wynwood Walls is a unique outdoor destination
featuring the world’s greatest artists working in the
graffiti and street art genre.
WYNWOOD BID OVERVIEW

OVERALL SNAPSHOT

     Office In                         Office                        Retail in      Retail    New Apartment
   Construction                       Planned                      Construction    Planned     Units Planned
  197,000 SF                     767,000 SF                        227,900 SF     60,000 SF       464

RESIDENT DEMOGRAPHICS

                                     Average                         Median        Median       Aggregate
     Population                     HH Income                         Age         Household     HH Income
        1,654                       $25,792                            37            2.6          $13M

Source: Environics Analytics as compiled by IRR Miami|Palm Beach

W YNWOOD MARKE T REPORT | 10
PARKING TR ANSAC TIONS
Wynwood’s parking transactions account for 20% of all parking transactions in the City of Miami according to Pay-By-Phone.
90,000 Most CitiBike users in the City of Miami.
80,000
70,000 15,000 Citibike Transactions in 2015-2016.*
60,000
50,000 More than 200,000 Parking Transactions in
40,000 the last three months.**
30,000
20,000
10,000
0
l-1
4 14 14 15 r-15 -15 l-15 -15 -15 -16 r-16 -16 l-16 -16 -16 -17
Ju p- v- n- y p v n y p v n
Se No Ja Ma Ma Ju Se No Ja Ma Ma Ju Se No Ja
*Source: Citibike
**Source: Pay-by-Phone
TOURISM & ECONOMIC SNAPSHOT
The popularity of
Wynwood continues
2,060,465 $488M 400+ 5,000+ to grow as the number
Out-of-Town Local Spending Businesses Local Jobs of visitors who said
Visitors by Out-of-Town Supported they went to Wynwood
Visitors doubled from last year.
Source: Greater Miami Convention & Visitors Bureau
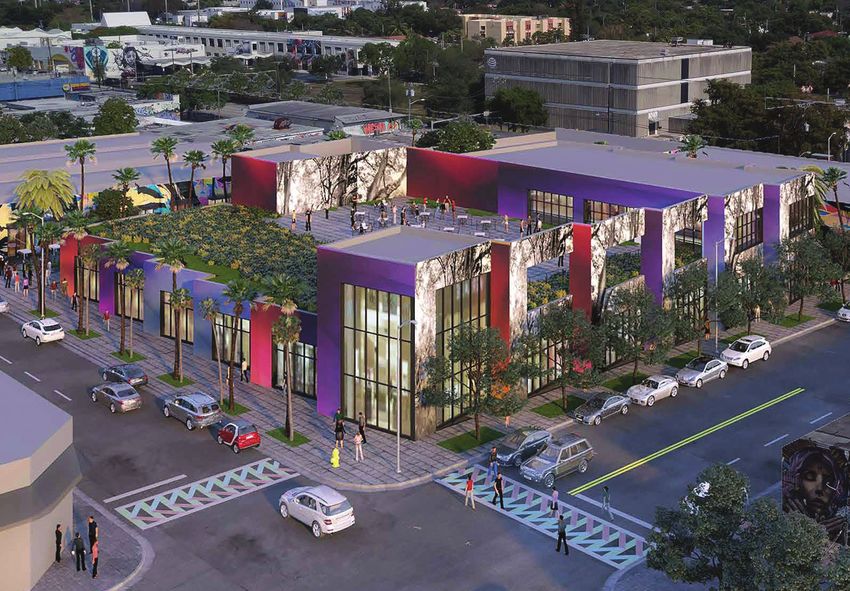
W YNWOOD MARKE T REPORT | 11Wynwood 25 is a mixed-use, multifamily and retail project being developed by East End Capital and Related Group of Florida.
The Wynwood BID multifamily market comprises
5.5% of the existing inventory across the Miami
DDA, Midtown and Edgewater market areas, and
the number of units under construction account
for 8.5% of the same area.
The existing multifamily inventory performance is
not indicative of the potential performance for the
under construction or proposed product coming
on line in the next few years, which is expected to
perform similarly to the neighboring Midtown and
Edgewater neighborhoods.

                                       W YNWOOD MARKE T REPORT | 13
MULTIFAMILY MARKET OVERVIEW Wynwood Market in Context – Multifamily Neighborhood Inventory (Units) Under Construction Average Rents Vacancy Wynwood BID Area 403 464 $570 - $850 1.4% Midtown & Edgewater 3,100 2,200 $1,500 - $2,300 12.0% Miami DDA Area* 7,248 5,422 $1,800 - $2,700 10.0% Coral Gables 4,100 1,206 $1,200 - $3,700 6.3% Doral 4,700 690 $1,700 - $2,500 8.6% Aventura 1,700 0 $1,700 - $2,600 7.9% *Includes Midtown and Edgewater Source: Miami DDA Residential Report by IRR Miami|Palm Beach & Costar Data as compiled by IRR Miami|Palm Beach • The BID multi-family market consists primarily of a very • The most recent multifamily building delivered to the area limited stock of 1950’s and 1960’s vintage low-density was the 250 Wynwood condominiums; an 11 unit building buildings averaging less than ten total units per building. delivered in 2015. • The existing supply of multifamily units in the Wynwood • By 2020, the Wynwood BID apartment inventory is area is primarily located within the northeast quadrant of forecast to more than double, with the addition of two the BID boundaries. new buildings adding 464 rental units. • The existing Class C units will not compete for • Three projects have been proposed representing an tenants with the projects under-construction, and additional 612 potential rental units. their performance is not indicative of the potential performance of the under construction and proposed supply for the area. W YNWOOD MARKE T REPORT | 14
Wynwood BID Area Multifamily Market Overview
                                           # of Units   # of Properties
Existing Supply                            403          15
Under Construction                         464          2
Proposed                                   757          5

Source: IRR Miami|Palm Beach; existing supply CoStar

 Wynwood BID Area Multifamily Under Construction
Project Name               Developer                         Address            Units   Projected        Average
                                                                                        Delivery         Unit Size SF
Wynwood 25                 East End Capital & Related        240 NW 25th St     289     Q2 2019          634

The Bradley                Block Capital & Related           51 NW 26th St      175     Q2 2019          1,010

Total                                                                           464

 Wynwood BID Area Proposed Multifamily Projects
Project Name               Developer                         Address            Units   Projected        Average
                                                                                        Delivery         Unit Size SF
Wynwood Green              Lennar                            98 NW 29th St      189     Mid-year 2020    807
W House                    Metro 1 & Related                 2828 NW 1st Ave    182     TBD              TBD
Wynwood Square             One Real Estate Investment        2201 N Miami Ave   241     TBD              TBD

Total                                                                           612

Source two above: IRR Miami|Palm Beach

                                                                                         W YNWOOD MARKE T REPORT | 15
Under Construction Proposed Projects
There are two new multifamily properties currently under The four additional proposed projects for the area, as
construction in the area, Wynwood 25 being developed by shown below, have the potential to increase the supply
the Related Group and East End Capital and The Bradley by an additional 189%. These projects are in the planning
being developed by the Related Group and Block Capital phases of the development cycle, with no announced
Group (see page 18–19 for project details). timeline for groundbreaking.
NW 5TH AVE
NW 2ND AVE
N MIAMI AVE
NW 29TH ST NW 29TH ST
5 4 3
NW 28TH ST
NW 27TH ST
NW 27TH ST
2
NW 26TH ST
NW 25TH ST NW 25TH ST
1
NW 24TH ST
NW 23RD ST 1 Wynwood 25:
MU* Multifamily and Retail
NW 5TH AVE
NW 23RD ST
2 The Bradley:
MU Multifamily and Retail
NW 22ND ST 6 3 Wynwood Green:
NW 22ND ST MU Multifamily and Retail
4 W House:
NW 2ND AVE
MU Multifamily and Retail
N MIAMI AVE
NW 1ST AVE
5 Wynwood Gateway:
MU Multifamily and Retail
6 Wynwood Square:
MU Multifamily and Retail
* MU = Mixed-Use
W YNWOOD MARKE T REPORT | 16Vacancy | Vacancy Rate Rent | Monthly Rents
Multifamily vacancy in the submarket has trended Existing multifamily rents have increased steadily
downward for the analysis period and has remained over the analysis period.
under 5.0% since mid-2011.
Vacancy Rate Monthly Rents
10% $700
$672 $678
8.4% $661
8% $645
$650
7.2% 7.2% $624 $630
$611
$604 $598 $600
6% $600
3.6%
4% $550
3.0% 2.9%
2.2% 1.4% 2.1% 1.7%
2% $500
0 $450
2009 2010 2011 2012 2013 2014 2015 2016 2017 YTD 2009 2010 2011 2012 2013 2014 2015 2016 2017 YTD
Inventory | # of Units
# of Units
Existing multifamily inventory has been 500
decreasing over the analysis period as older 440 440 440
properties in central locations within the 425 417 417 417
410 403 403
BID area were demolished to make room 400
for redevelopment. Existing inventory has
declined by close to 10% since 2009.
300
200
2009 2010 2011 2012 2013 2014 2015 2016 2017 YTD
Source: CoStar as compiled by IRR Miami|Palm Beach
W YNWOOD MARKE T REPORT | 17The Bradley 5 1 N W 2 6 TH S T R E E T • 32,000 square feet of ground-floor retail • 175 rental units • Ground-floor retail • Projected Delivery in Q2 2019 • 1,010 SF average unit size • Developer – Block Capital & Related Group of Florida • Architect – Arquitectonica International W YNWOOD MARKE T REPORT | 18
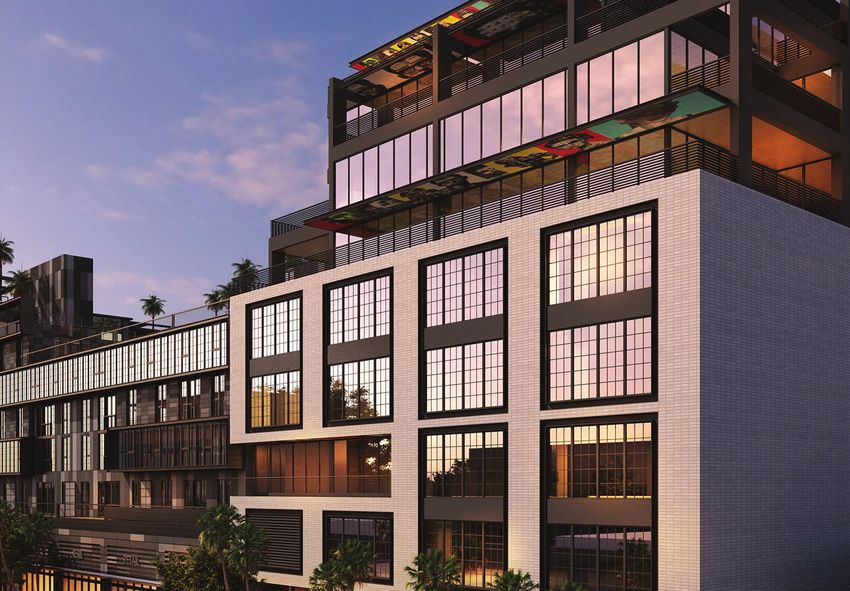
Wynwood 25
2 4 0 N W 2 5 TH S T R E E T
 • 425,000 square feet of building
 • 289 rental units
 • 31,000 square feet of retail
 • Projected Delivery in Q2 2019
 • 634 SF average unit size
 • Developer – East End Capital & Related Group of Florida
 • Architect – Kobi Karp

                                                             W YNWOOD MARKE T REPORT | 19
Wynwood Garage, developed by Goldman Properties, has ground floor retail and office space on the top floor. It is the area’s first structured parking facility.
The Wynwood BID Office market comprises
1.25% of the existing inventory across the
Miami DDA, Midtown and Edgewater market
areas, though a significantly larger amount of
office space is currently under construction in
Wynwood. The Wynwood BID market area has
no existing supply of traditional multi-story
office product, though rents achieved in some
of the area’s creative office space is similar to
rents in other nearby markets, ranging from
$40 to $50 per square foot NNN on average.

                                         W YNWOOD MARKE T REPORT | 21
OFFICE MARKET OVERVIEW
Wynwood Market in Context – Office
Neighborhood Inventory (SF) Under Construction Average Gross Vacancy
Rents
Wynwood BID Area 250,000 197,000 $50 - $60 1.4%
Midtown & Edgewater 1,100,000 0 $35 - $40 18.0%
Miami DDA Area* 20,000,000 170,000 $40 - $60 14.0%
Coral Gables 11,000,000 390,000 $35 - $50 8.80%
Doral 8,200,000 55,000 $25 - $35 11.3%
Aventura 1,900,000 340,000 $35 - $50 11.0%
* includes Midtown and Edgewater
Source: Miami DDA Office Report by Lambert Advisory & Costar Data as compiled by IRR Miami|Palm Beach
• Approximately 90% of the existing supply of office space • Market participants indicate increasing demand from
in the BID area consists of older warehouse buildings local and national tenants attracted to the creative
that have been repurposed for creative office use. atmosphere in Wynwood.
• The supply of office space in the market is set to increase • Some national tenants are reportedly interested in office
by 250% over the next three years as 4 new office space that blends the traditional office format with
buildings are under construction adding approximately Wynwood’s creative influences. This type of space has
197,000 square feet of new office product to the area. had limited availability in the market until the proposed
offices complete.
• Proposed projects may potentially add an estimated
767,000 square feet in the next 48 to 60 months.
Wynwood BID Area Office Market Overview
Inventory (SF) # of Properties
Existing Supply 250,000 6
Under Construction 197,000 4
Proposed 767,000 5
Source: IRR Miami|Palm Beach; existing supply CoStar
W YNWOOD MARKE T REPORT | 22Wynwood BID Area Office Under Construction
Project Name Developer Address Square Feet Projected Delivery
Wynwood Garage Goldman Properties 2660 NW 3rd Ave 30,000 Q4 2018
CUBE Wynwd RedSky Capital 222 NW 24th St 90,000 Q4 2018
Wynwood Annex East End Capital & Related 215-219 NW 24th St 56,000 Q2 2019
Print House Link & Jameson Equities 2509 N Miami Ave 21,000 Q1 2019
Total 197,000
Wynwood BID Area Office Proposed
Project Name Developer Address Square Feet Projected Delivery
Wynwood 29 The Related Group 2828 NW 1 Ave 27,000 TBD
Forum RedSky Capital 2700 NW 2nd Ave 181,000 TBD
545 Wyn Sterling Bay 537 NW 26th St 209,000 TBD
Gateway at Wynwood R&B Realty 2916 N Miami Ave 250,000 Q4 2020
Wynwood Square One Real Estate Investment 2201 N Miami Ave 80,000 TBD
The Oasis Carpe Real Estate 2319 North Miami Ave 20,000 Q3 2019
Total 767,000
Source all above: IRR Miami|Palm Beach
W YNWOOD MARKE T REPORT | 23Under Construction Proposed Projects
There are five new office properties currently under The Wynwood Annex is under-construction with expected
construction in the area. Two of the projects, Wynwood delivery in Q1 2019, and the Gateway at Wynwood is
Garage and Cube Wynwd, are expected to deliver by currently in site development with projected delivery in
year-end 2018, adding nearly 120,000 square feet (see Q4 2020. An additional 330,000 square feet of office is
page 26–27 for project details). proposed for the Wynwood market area, though not all may
be developed as currently proposed.
NW 5TH AVE
NW 2ND AVE
N MIAMI AVE
4
NW 29TH ST NW 29TH ST
6
1 Wynwood Garage:
NW 28TH ST MU* Office Retail
7 NW 27TH ST
2 CUBE Wynwd:
NW 27TH ST
MU Office Retail
1
NW 26TH ST 3 Wynwood Annex:
MU Office Retail
NW 25TH ST NW 25TH ST 5
4 Gateway at Wynwood:
8 3 MU Office Retail
2 NW 24TH ST 5 Print House:
NW 23RD ST MU Office Retail
10
NW 5TH AVE
NW 23RD ST
6 Wynwood:
MU w/MF
NW 22ND ST
9 7 Forum:
NW 22ND ST MU Office Retail
8 545 Wyn:
MU Office Retail
NW 2ND AVE
N MIAMI AVE
NW 1ST AVE
9 Wynwood Square:
MU w/MF
10 The Oasis:
MU w/MF
* MU = Mixed-Use
W YNWOOD MARKE T REPORT | 24Vacancy | Vacancy Rate Rent | NNN Rent PSF
Office vacancy in the submarket has fluctuated throughout Office rental rates increased steadily through the analysis
the analysis period. Office vacancy has been below period reaching their peak in early 2016 at $51.00 per
8.0% since 2015. The addition of new projects will only square foot before dipping back under $50.00 per square
temporarily impact vacancy while the projects are in foot in 2018.
lease-up.
Vacancy Rate Rent PSF
16% 15.7% $60
$51.40 $50.13
14% $50
$44.54
12% 10.6%
9.5% $40
$36.04
10%
8.4% $29.49 $30.22
$30
8%
6.9%
$20.03
6% $20
4.5% 4.6% 4.7% $13.73 $14.74 $14.70
4% $10
1.8% 1.4%
2% 0
0 2009 2010 2011 2012 2013 2014 2015 2016 2017 YTD
2009 2010 2011 2012 2013 2014 2015 2016 2017 YTD
Inventory | Square Feet
Square Feet
Office inventory increased with the delivery 260,000
251,767
of 24,000 square feet of space in 2016.
250,000
240,000
227,767
230,000
220,000
210,000
200,000
2009 2010 2011 2012 2013 2014 2015 2016 2017 YTD
Source: CoStar as Compiled by IRR Miami|Palm Beach
W YNWOOD MARKE T REPORT | 25Wynwood Garage
2 6 6 0 N W 3 RD AV E N U E
• 180,000+/- building sq ft • Developer – Goldman Properties
• 30,000 square feet office space • Architect – Wolfberg, Alvarez & Partners
• 20,500 square feet of retail space • Leasing Company – Blanca Commercial Real Estate
• Projected Delivery in Q4 2018
• Asking Rents for Office $53.00 to $56.00 PSF
Modified Gross
W YNWOOD MARKE T REPORT | 26CUBE Wynwd
2 2 2 N W 2 4 TH S T R E E T
• 77,000+/- square feet of office • Developer – Redsky Capital
• 9,400 square feet of retail • Architect – Arquitectonica International
• 132 off-site parking spaces • Leasing Company – Blanca Commercial Real Estate
• Projected Delivery in Q4 2018
• Asking Rents for Office $40.00 to $42.00 PSF NNN
W YNWOOD MARKE T REPORT | 27Wynwood Annex 2 1 5 – 2 1 9 N W 2 4 TH S T R E E T • 60,000 square feet office space • Developer – East End Capital & Related Group of Florida • 5,000 square feet retail space • Architect – Kobi Karp • 340 structured parking spaces • Leasing Company – Cushman Wakefield • Projected Delivery in Q2 2019 • Asking rents are $45.00 to $50.00 NNN W YNWOOD MARKE T REPORT | 28
Print House
2509 N MIAMI AVENUE
 • 21,000 square feet of office    • Developer – Link & Jameson Equities
 • 30 onsite parking spaces        • Architect – MKDA
 • Projected Delivery in Q1 2019   • Leasing Company – Metro 1 Commercial
 • Asking rents – Not Available

                                                                  W YNWOOD MARKE T REPORT | 29
Concrete Beach Brewery has a 20-barrel brewing system and social hall. Anheuser-Busch InBev, Boston Beer Company, Craft Brew Alliance and Heineken own breweries with taprooms rooms in Wynwood.
The Wynwood BID retail market comprises 13.4%
of the existing inventory across the Miami DDA,
Midtown and Edgewater market areas, and 11.6%
of the retail supply under construction. Retail
rents in Wynwood are amongst the highest in
Miami and expected to continue to outperform
surrounding neighborhoods.

                                     W YNWOOD MARKE T REPORT | 31
RETAIL MARKET OVERVIEW
Wynwood Market in Context – Retail
Neighborhood Inventory (SF) Under Construction Average NNN Vacancy
Rents
Wynwood BID Area 1,050,000 227,900 $45 - $90 13.7%
Midtown & Edgewater 1,200,000 40,000 $40 - $65 5.7%
Miami DDA Area* 7,800,000 1,960,000 $30 - $125 11.8%
Coral Gables 4,300,000 300,000 $40 - $60 3.0%
Doral 3,300,000 130,000 $30 - $55 2.1%
Aventura 4,500,000 70,000 $35 - $50 < 1.0%
* includes Midtown and Edgewater
Source: Miami DDA Retail Report by IRR Miami|Palm Beach & Costar Data as compiled by IRR Miami|Palm Beach
• Of the commercial real estate property markets • While the retail inventory has not grown significantly
profiled in this report, the retail property market is over the time period analyzed, rents have tripled in this
the most mature in terms of reaching its full market same period, with some parts of the Wynwood BID area
potential for the Wynwood area. reaching $100+ rents per square foot in early 2017 before
receding in the quarters that followed.
Wynwood BID Area Retail Market Overview
Square Feet # of Properties
Existing Supply 1,050,000 112
Under Construction 227,900 5
Proposed 60,000 5
Source: IRR Miami|Palm Beach; existing supply CoStar
W YNWOOD MARKE T REPORT | 32Wynwood BID Area Retail Under Construction
Project Name Developer Address Square Feet Projected Delivery
Wynwood Walk Thor Equities 2800 NW 2nd Ave 124,000 Q1 2019
CUBE Wynwd RedSky Capital 222 NW 24th St 9,400 Q4 2018
Wynwood Park ASG Wynwood 2600 NW 2nd Ave 42,000 TBD
Wynwood 25 East End Capital & Related 240 NW 25th St 32,000 Q2 2019
Wynwood Garage Goldman Properties 2660 NW 3rd Ave 20,500 Q4 2018
Total 227,900
Wynwood BID Area Retail Proposed
Project Name Developer Address Square Feet Projected Delivery
Not Available Thor Properties 2724 NW 2nd Ave 8,000 TBD
Not Available Thor Properties 2724 NW 2nd Ave 19,000 TBD
Not Available Windsor Capital 143 NW 23rd St 5,000 TBD
Not Available Karakhanian 31 NW 29th St 11,000 TBD
The Oasis Carpe Real Estate 2319 North Miami Ave 17,000 Q3 2019
Total 60,000
Source all above: IRR Miami|Palm Beach
W YNWOOD MARKE T REPORT | 33Under Construction Proposed Projects
All of the office and multifamily projects previously The retail market in Wynwood appears to be reaching a point
profiled included ground floor retail space in their of stability. Rental rates have retreated slightly after six straight
development. There is only one solely retail project years of growth, and vacancy has been inching upward over
under construction in the submarket which will the past four years. With the exception of primary retail
increase supply by about 6.0%. corridors of NW 2nd Avenue and NW 24th Street, a greater
percentage of the proposed retail projects are expected to be
delayed until market conditions again turn positive.
NW 5TH AVE
NW 2ND AVE
N MIAMI AVE
9
NW 29TH ST NW 29TH ST
1
NW 28TH ST
6
NW 27TH ST
NW 27TH ST 7
4 5
NW 26TH ST
NW 25TH ST NW 25TH ST
3 1 Wynwood Walk
2 NW 24TH ST
2 CUBE Wynwd
NW 23RD ST 8 10
NW 5TH AVE
NW 23RD ST 3 Wynwood 25
4 Wynwood Garage
NW 22ND ST 5 Wynwood Park
NW 22ND ST
6 Not Available
7 Not Available
NW 2ND AVE
N MIAMI AVE
NW 1ST AVE
8 Not Available
9 Not Available
10 The Oasis
W YNWOOD MARKE T REPORT | 34Vacancy | Vacancy Rate Rent | NNN Rent PSF
Submarket vacancy rates have been increasing steadily Average area retail rents have more than tripled in the
since 2013, reaching a high of 13.7% in 2018. analysis period, from a low of $15.82 in 2011 to a high of
$61.75 in 2017. Rents have receded slightly YTD 2018 to
$55.67 per square foot. Area brokers report some tenant
turnover has led to the decrease in rents.
Vacancy Rate Rent PSF
16% $70
13.7% $61.75
14% $60 $55.67
11.7%
$47.86 $48.00
12% $50
9.2%
10% 8.7% $40
8% $31.83
$29.86
6.2% 6.0% 6.0% 5.2% 6.3% $30
6% $21.62
4.3% $17.88 $15.80 $15.82
$20
4%
2% $10
0% 0
2009 2010 2011 2012 2013 2014 2015 2016 2017 YTD 2009 2010 2011 2012 2013 2014 2015 2016 2017 YTD
Inventory | Square Feet
Square Feet
BID area retail inventory has increased 1,100,000
minimally over the analysis period,
reflecting 2% annual growth since
2009. The strongest growth occurred 1,000,000
between 2015 and 2018 at close to 10%
annual average.
900,000
800,000
2009 2010 2011 2012 2013 2014 2015 2016 2017 YTD
Source: CoStar as Compiled by IRR Miami|Palm Beach
W YNWOOD MARKE T REPORT | 35Wynwood Walk 2 8 0 0 N W 2 ND AV E N U E • 124,000 square feet of retail • No onsite parking • Projected Delivery in Q1 2019 • Asking rents not available • Developer – Thor Equities • Architect – Oppenheim Architecture • Leasing Broker – Not Available W YNWOOD MARKE T REPORT | 36
Wynwood Garage
2 6 6 0 N W 3 RD AV E N U E
 • 20,500 square feet of retail space
 • Projected Delivery in Q4 2018
 • Asking rent for retail not available
 • Developer – Goldman Properties
 • Architect – Wolfberg, Alvarez & Partners
 • Leasing Company – Goldman Properties

                                              W YNWOOD MARKE T REPORT | 37
CUBE Wynwd 2 2 2 N W 2 4 TH S T R E E T • 9,400 square feet of retail • 132 off-site parking spaces • Projected Delivery in Q4 2018 • Asking rents for retail $70 PSF NNN • Developer – RedSky Capital • Architect – Arquitectonica International • Leasing Company – Koniver Stern Group W YNWOOD MARKE T REPORT | 38
Wynwood 25
2 1 5 – 3 3 9 N W 2 4 TH S T R E E T
• 32,000 square feet of retail
• Projected delivery in Q2 2019
• 340 parking spaces
• Asking rent for retail $75 PSF NNN
• Developers – East End Capital & Related
• Architect – Kobi Karp
• Leasing Company – Koniver Stern Group
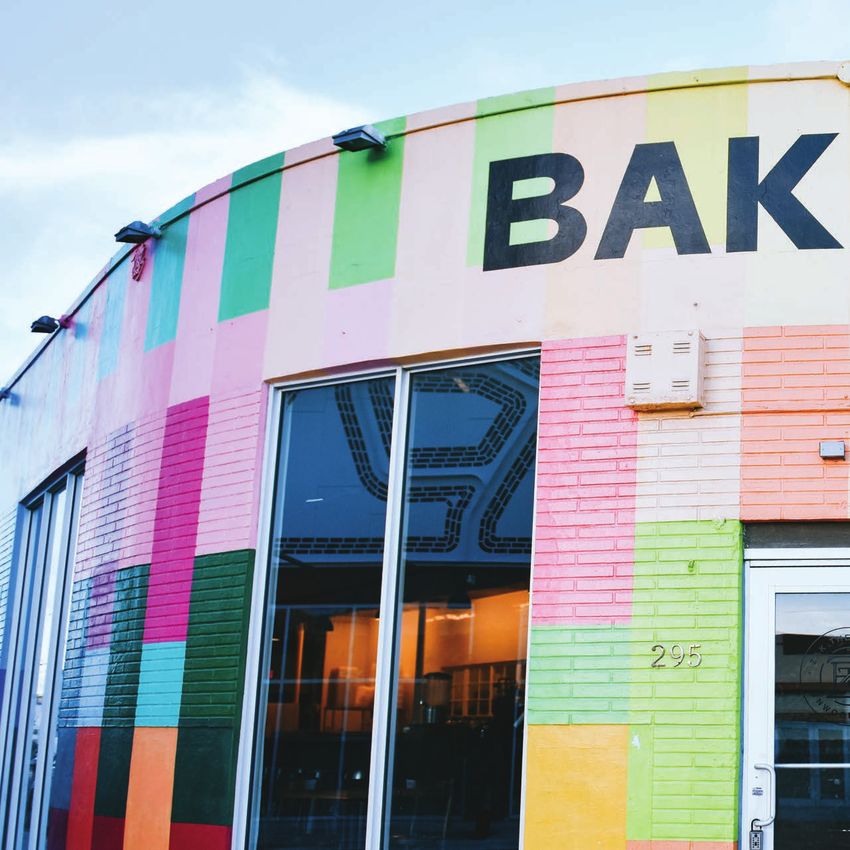
W YNWOOD MARKE T REPORT | 39Zak the Baker is a James Beard nominated, Kosher bakery beloved for its artisanal breads and pastries. Wynwood is home to the most popular and critically acclaimed eateries and bars in South Florida.
RETAIL DRAWING POWER
R E TA I L R E N T S RUBELL
MUSEUM 14 5
The area contains a number of NW 29TH ST.
WYNWOOD 1
3 BROTHERS & 2
retail properties that further 5 BRAWLERS YARD
FIREMAN DEREK’S
BXLDR BEER MKT.
SUVICHE
enhance the visitor experience WYNCODE
OLIVER COLE GALLERY
6 BRICK HOUSE
11 R HOUSE JIMMY’Z KITCHEN
and drive demand for retail space. MIAM CAFÉ
12
6 BEAKER & GRAY
10 MR BLOCK
$35 - $45/sf NNN ZAK THE 3
BAKER
WYNWOOD
PARK WYNWOOD DINER
2
7
WK&B WOOD TAVERN
KYU WYNWOOD WALLS BND BURGER 8
$45 - $65/sf NNN TACO STAND WARBY PARKER JOEY’S PLANT THE FUTURE
32,000 AADT
WYNWOOD 25 ASCASO GALLERY
WYNWOOD CONCRETE BEACH GK GASTRONOMIE
NW 5TH AVE.
WYNWOOD 5TH AVE BREWERY
BREWING CO. 4 1
INTERSTATE GALLERY 212
PANTHER COFFEE
$65 - $90+/sf NNN 95
7 WYNWOOD ARCADE
219,000 AADT
J WAKEFIELD
7,200 AADT
13 BREWING SALTY DONUT 9
MISTER 01
VONDOM
N MIAMI AVE.
4
MANA DR SMOOD BASE
WYNWOOD 8
CONVENTIONS CENTER
ROBERT FONTAINE
GALLERY
NW 2ND AVE.
MVM
SOHO
TRES ART STUDIOS N
KUSH
NW 2OTH ST.
Under Construction Proposed Projects
1 Wynwood 25 — MU Multifamily and Retail 1 Wynwood Green — MU Multifamily and Retail 9 The Oasis — MU w/MF
2 The Bradley — MU Multifamily and Retail 2 W House — MU Multifamily and Retail 10 Wynwood Park
3 Wynwood Garage — MU Office Retail 3 Wynwood Gateway — MU Multifamily and Retail 11 Not Available
4 CUBE Wynwd — MU Office Retail 4 Wynwood Square — MU Multifamily and Retail 12 Not Available
5 Gateway at Wynwood — MU Office Retail 5 Wynwood Walk — MU w/MF 13 Not Available
6 Wynwood Walk — MU Office Retail 6 Forum — MU Office Retail 14 Not Available
7 Wynwood Annex — MU Office Retail 7 545 Wyn — MU Office Retail
8 Print House — MU Office Retail 8 Wynwood Square — MU w/MF
W YNWOOD MARKE T REPORT | 42WYNWOOD RECENT TRANSACTIONS
LAND TRANSACTIONS R E TA I L T R A N S A C T I O N S
Sale 1: 2641 NW 5th Ave Sale 1: 151/153 NW 24 St Sale 2: 48 NW 25th St
$18.0M $9.15M $12.2M
$453/SF Land (2018) $1,415/SF (2018) $543/SF (2018)
39,732 SF Land 6,465 SF Retail Gallery 22,462 SF Retail/Office
Sale 2: 269-285 NW 27th Ter Sale 3: 2509 N Miami Ave Sale 4: 55 NW 25th St (Veza Sur)
$5.85M $5.4M $4.5M
$397/SF Land (2018) $302/SF (2017) $1,184/SF (2017)
14,750 SF Land 17, 843 SF Industrial 3,800 SF Restaurant/Bar
(sold for adaptive reuse)
Sale 3: 285-295 NW 27th St Sale 5: 250 Wynwood (Retail Storefronts)
$11.0M $2.995M
$909/SF Land (2017) $882/SF (2017)
12,100 SF Land 3,396 SF divided in 2 restaurants
W YNWOOD MARKE T REPORT | 43MANA WYNWOOD SAP & ASIA TRADE HUB
MANA WYNWOOD SAP
On 40 acres of prime real estate in the Wynwood—stretching from I-95 on the west to NW 2nd Avenue on the east—
Mana Group is developing Mana Wynwood. Situated at the heart of the city’s rapidly expanding urban core, this project
will combine world-class facilities for the arts, entertainment, education, and high-technology, with state of the art
infrastructure for international trade and finance. At its core, an expansive network of parks, pedestrian walkways, and
communal space will tie the community together creating a collaborative ecosystem.
The Mana Wynwood Special Area Plan (SAP) is one of the largest entitlements granted in the history of Miami.
Encompassing 23.5 acres, the SAP is an independent district and provides:
• 10 Million SF (920,000 SM) of Entitlements
• Increased height from a maximum of 8 stories to
three (3) new zones with limits of 12, 16, and 24 stories.
• Increased density (150du/acre)
• Increased open space
• Flexible podium height allowing for taller floor to
floor on programmed space and more parking floors.
• Relaxed tower setbacks
• Greater flexibility on uses
• Zoning for media
• Increased tower floor plate sizes and tower lengths
ASIA TRADE HUB
The cornerstone of Mana Wynwood will be the Asia Trade Hub, a world class platform dedicated to facilitating the flow of
trade and investment between the Americas and Asia.
Occupying the highest density portions of the Mana Wynwood SAP, the Asia Trade Hub will rise alongside I-95 to provide
millions of square feet of Class-A/Prime office space, showrooms, retail, and high-end hospitality for global corporations,
banks, import/export companies, service providers, and government agencies. The Asia Trade Hub will serve as a hub for
business and trade, and a regional headquarters for companies from Asia and the Americas.
The Asia Trade Hub will house 1.5 million SF of showrooms and 1 million SF of Class-A office space. Alongside the 2.5 million
SF of Class-A office space and showrooms, the trade center will supply dedicated retail, hospitality, and leisure amenities.
Totaling nearly 400,000 SF, this infrastructure will allow the trade center ecosystem to thrive within Mana Wynwood.
W YNWOOD MARKE T REPORT | 44WYNWOOD NRD-1 ZONING MAP
PARKING
IMROVEMENT
NW 29TH ST T6-8-O NW 29TH ST
TRUST FUND
NW
N H AAVVEE
W 66TTH
NE 28TH ST
T5-O
NW 28TH ST
A purchase price of $6,000 per
NW 27TH TER
AVE
2ND AVE
half-space (“residential”) and
NE 27TH ST
NW 2ND
T5-O
NW 27TH ST
NW
T5-L
NW 27TH ST
$12,000 per full space (commercial
W 11SSTT AAVVEE
NE 26TH ST
NW 26TH ST
or residential) per parking space shall
D AAVVEE
NW
N
RD
NW 26TH ST
NW
N W 33R
be inflation adjusted once at the end
NW 25TH ST
D1 NE 25TH ST
T5-O T6-8-O
NW 24TH ST
NW 24TH ST
of each five-year period. The first such
NE 24TH ST
NW 23RD ST
adjustment shall occur on October 1,
H AAVVEE
D
MEED
W 55TTH
NAAM
CT
MI CT
NW 23RD ST
NW
NW 23RD ST
2020, reflecting the change from the
NN
N
MIAMI
UN
NE MIA
U
NW 22ND LN
NE
NE 23RD ST
W 11SSTT PPLL
T5-O
prior year only, using the consumer
NW 22ND TER NW 22ND TER
NW
N
NW 22ND ST
NE 22ND ST
price index urban consumers (“CPI-U”).
W 11SSTT AAVVEE
CTT
W 11SSTT C
NW
NW
N
N
AVE
MIAMI AVE
Additional information about the
N MIAMI
NW 21ST ST
N
NRD-1 zoning plan is available at:
NW MIIAAM
WM CTT
MII C
N
N
WynwoodMiami.com
T6-8-O
0 0.125 0.25 0.5 Miles
■ T5-0 ■ T6-8-0 ■ D-1
Min Height 2 Stories Min Height 2 Stories Min Height none
Max Height 5 Stories Max Height 8 Stories Max Height 8 Stories
Max Height w/ Bonuses 8 Stories Max Height w/ Bonuses 12 Stories Max Height w/ Bonuses 10 Stories
Lot Coverage 80%–90% Lot Coverage 80% Lot Coverage 80%
Density 150 du/ac Density 150 du/ac Density 36 du/ac
W YNWOOD MARKE T REPORT | 45Wynwood is an eclectic district in the urban core of Miami, Florida. It is home to art galleries, retail stores, antique shops, bars, artisanal eateries and one of the largest open-air street-art installations in the world. Throughout the mid-to-late 1900s, Wynwood was an enclave for Caribbean immigrants and home to Miami’s Garment District. Following a decade of economic exodus and depression, in the early 2000s, forward thinking developers and property owners rehabilitated neglected warehouses, shuttered factories, and other unused buildings, transforming them into the innovative businesses that are visible today. However, it is street art that helped spark Wynwood’s renaissance. Since the introduction of Second Saturday Art Walk and the arrival of Art Basel (2002), the influence and relevance of the arts community in Wynwood has become undeniable. Artists from around the world have sought inspiration in the area’s windowless facades and used them as canvases to showcase their work, leading to the vivid murals that adorn the district. Today, Wynwood is recognized globally as a premier destination for art, fashion, innovation and creative enterprise. It is one of the largest and most prominent creative communities in the United States, and where a new generation of creative and entrepreneurs want to live, work, eat, play and learn. The Wynwood Business Improvement District (BID) is a special assessment district in the City of Miami that consists of 400+ commercial properties in the 50-city-block Wynwood Arts District. The Wynwood BID is represented by a municipal board of directors who together with an Executive Director works to enhance security and sanitation services in the neighborhood, advocate for the betterment of the area, raise awareness of advancements being made, and plan for the future of Wynwood. Since its creation in 2013, the BID has helped guide Wynwood’s evolution from a largely forgotten industrial district into a bustling, arts-focused urban neighborhood that is home to the largest concentration of street art in the United States. Today, the Wynwood BID is safer and cleaner than ever before and welcomes millions of visitors annually from across the U.S. and around the globe who are drawn to the neighborhood’s street art and innovative businesses, including distinguished galleries, movie houses, culinary academies, microbreweries, artisanal bakeries, craft-coffee houses, and renowned restaurants. W YNWOOD MARKE T REPORT | 46
WYNWOOD BID LEADERSHIP

JOSEPH FURST         ALBERT GARCIA             DYLAN FINGER                IRVING M. LERNER
BID Board Chairman   BID Board Vice Chairman   BID Board Member            BID Board Member

DAVID POLINSKY       JONATHON YORMAK           MANNY GONZALEZ
BID Board Member     BID Board Member          BID Executive Director

                                                                        W Y N W O O D M A R K E T R E P O R T | 47
FOR MORE INFORMATION ABOUT THE WYNWOOD BID, PLEASE CONTACT:
Wynwood Business Media + Press Inquiries
Improvement District media@wynwoodbid.com
2751 North Miami Avenue, Suite 3
Miami, Florida 33127 WynwoodMiami.com
786.615.8828
@wynwoodmiami
The information provided herein is for informational purposes. General Inquiries
This publication does not render legal, accounting, appraisal, @wynwoodmiami
counseling, investment, or other professional advice. Should such info@wynwoodbid.com
services or other expert assistance be needed, it is recommended @wynwoodmiami
that the services of a competent person or firm, having access to
the details of the situation, be employed.You can also read