MARKET REPORT WINTER 2019 / 2020 - HubSpot

Page created by Tom Morrison
 
CONTINUE READING
MARKET REPORT WINTER 2019 / 2020 - HubSpot
MARKET REPORT WINTER 2019 / 2020

www.malling.no
MARKET REPORT WINTER 2019 / 2020 - HubSpot
PAGE 2 MARKET REPORT WINTER 2019 / 2020 / CONTENTS

CONTENTS
Editorial  .  .  .  .  .  .  .  .  .  .  .  .  .  .  .  .  .  .  .  .  .  .  .  .  .  .  .  .  .  .  .  .  .  .  .  .  .  .  .  .  .  .  .  .  .  .  .  .  .  .  .  .  .  .  .  .  .  .  .  .  .  .  .  .  .  .  .  .  .  .  .  .  .  .  .  .  .  .  .  .  .  .  .  .  .  . 3
Macro                    .  .  .  .  .  .  .  .  .  .  .  .  .  .  .  .  .  .  .  .  .  .  .  .  .  .  .  .  .  .  .  .  .  .  .  .  .  .  .  .  .  .  .  .  .  .  .  .  .  .  .  .  .  .  .  .  .  .  .  .  .  .  .  .  .  .  .  .  .  .  .  .  .  .  .  .  .  .  .  .  .  .  .  .  .  .  .   4
Oslo office market  .  .  .  .  .  .  .  .  .  .  .  .  .  .  .  .  .  .  .  .  .  .  .  .  .  .  .  .  .  .  .  .  .  .  .  .  .  .  .  .  .  .  .  .  .  .  .  .  .  .  .  .  .  .  .  .  .  .  .  .  .  .  .  .  .  .  .  .  .  .  .  .  .  . 8
Stavanger  .  .  .  .  .  .  .  .  .  .  .  .  .  .  .  .  .  .  .  .  .  .  .  .  .  .  .  .  .  .  .  .  .  .  .  .  .  .  .  .  .  .  .  .  .  .  .  .  .  .  .  .  .  .  .  .  .  .  .  .  .  .  .  .  .  .  .  .  .  .  .  .  .  .  .  .  .  .  .  .  . 28
Drammen                              .  .  .  .  .  .  .  .  .  .  .  .  .  .  .  .  .  .  .  .  .  .  .  .  .  .  .  .  .  .  .  .  .  .  .  .  .  .  .  .  .  .  .  .  .  .  .  .  .  .  .  .  .  .  .  .  .  .  .  .  .  .  .  .  .  .  .  .  .  .  .  .  .  .  .  .  .  .  .  .  .    32
Retail                .  .  .  .  .  .  .  .  .  .  .  .  .  .  .  .  .  .  .  .  .  .  .  .  .  .  .  .  .  .  .  .  .  .  .  .  .  .  .  .  .  .  .  .  .  .  .  .  .  .  .  .  .  .  .  .  .  .  .  .  .  .  .  .  .  .  .  .  .  .  .  .  .  .  .  .  .  .  .  .  .  .  .  .  .  .    34
Industrial & Logistics                                                      .  .  .  .  .  .  .  .  .  .  .  .  .  .  .  .  .  .  .  .  .  .  .  .  .  .  .  .  .  .  .  .  .  .  .  .  .  .  .  .  .  .  .  .  .  .  .  .  .  .  .  .  .  .  .  .  .  .  .  .  .  .  .  .  .  .  .  .    36
The transaction market  .  .  .  .  .  .  .  .  .  .  .  .  .  .  .  .  .  .  .  .  .  .  .  .  .  .  .  .  .  .  .  .  .  .  .  .  .  .  .  .  .  .  .  .  .  .  .  .  .  .  .  .  .  .  .  .  .  .  .  .  .  .  .  .  .  . 38
Special topic – Flexible office space: Consolidation ahead                                                                                                                                              .  .  .  .  .  .  .  .  .  .  .  .  .  .  .  .  .  .  .  .  .  .  .  .  .  .  .   42
                                                                                                                                                                                                                                                                                                   EDITING COMPLETED October 30th 2019
About Malling & Co  .  .  .  .  .  .  .  .  .  .  .  .  .  .  .  .  .  .  .  .  .  .  .  .  .  .  .  .  .  .  .  .  .  .  .  .  .  .  .  .  .  .  .  .  .  .  .  .  .  .  .  .  .  .  .  .  .  .  .  .  .  .  .  .  .  .  .  .  .  .  . 44                                                                  DESIGN OG LAYOUT Semway
MARKET REPORT WINTER 2019 / 2020 - HubSpot
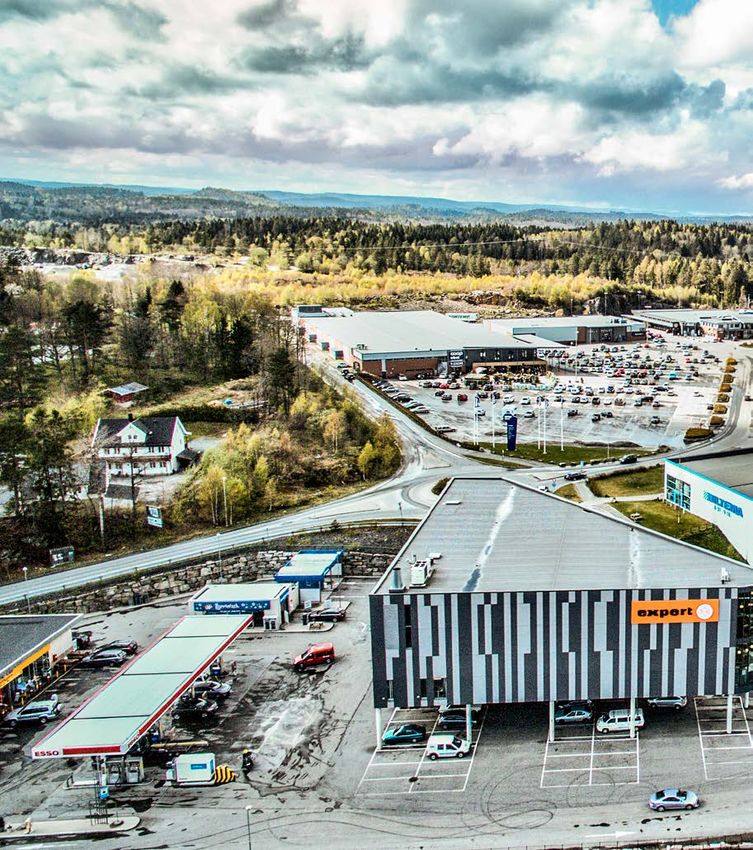
EDITORIAL / MARKET REPORT WINTER 2019 / 2020 PAGE 3

            RISK-ANXIETY BACK IN THE COCKPIT
       Ongoing tensions from trade war, Brexit and other geopolitical tensions have put pressure on global
        growth expectations. Despite the tension seeming to have eased somewhat towards the beginning
       of November, the underlying uncertainty of new events is pushing investors towards safe cash flows.
          The total effects for the Norwegian CRE markets are outlooks of slower rental growth combined
                                     with a recurring compressive force on yields.

                                                           —
 The latest perceived ease in the US-Chinese trade tension is simply an adjustment of the underlying uncertainty that
 is affecting markets and revised global growth expectations over the past six months. While interest rates have seen
significant reductions and anticipation of future hikes has turned to future cuts, investors’ attention has again turned
                                    to quality real estate in order to preserve wealth.

   All these events happening around our playing field are affecting the game, and we are seeing very instant effects:
   Prime yield estimates for offices in Oslo fell 10 bps from Q2 to Q3 in our investor survey, an unsurprising change,
   since expectations of future interest rates have plummeted over the year. Quality real estate with solid cash flows
 is even more in favour as the safe alternative, like the German 10Y bond, which has dropped below the 0 % boundary.
     Lower interest rates in Europe and the US, affecting expectations of future interest rates, may push yields even
                                               lower if the trend continues.

The Norwegian krone is weaker than ever, but foreign investors do not seem to be affected by this. The weak NOK may
have two positive effects on real estate investments in Norway: it may maintain the relative competitiveness in favour
            of the Norwegian economy and also be a good time to increase exposure to Norwegian CRE.

  But it is not just about yields, which are just sudden price adjustments. Cash flows are also very important, and the
  rise in office rents over recent years has created expectations among investors. We have seen several years of strong
   growth in employment in Oslo, way stronger than in the rest of the country. Together with limited supply this has
 pushed vacancy down and rents up, especially for centrally located offices. We are now anticipating slower growth in
demand and higher supply to hit the market next year. This is likely to slow down rental growth and we are expecting
a relatively flat development from mid-next year. Strong take-up growth from flexible office providers is also expected
 to moderate significantly and move into a period of consolidation. Our special topic in this report looks further into
                   this segment. A decrease in office rents is however quite unlikely in the coming years.

 Retail continues to face trouble. Several retail chains are experiencing falling sales. The “Thunberg-effect” is not only
creating fear among airlines, but also among key retailers such as H&M. Turmoil in the retail leasing market continues
  as a number of negative changes hit the market at the same time, both cyclical and structural. On top of that, three
interest rate hikes by the Norwegian Central bank over the year has been highly effective in limiting purchasing power
among consumers, as most have significant mortgage debt on floating rates. This not only affects running cash flows,
 it also affects the potential growth in value of their homes for financing larger consumption. Despite retail landlords
    adjusting their rental quotes, we are seeing few retailers, if any, with growth strategies in terms of physical retail
 space. We expect retail rents to continue their downward trend and for landlords to start considering alternative uses
  for their retail space to a greater extent, such as offices, restaurants and showrooms, as rents continue downwards.

     We hope you enjoy our latest market report. Remember that Malling & Co is here to support you in all your
    commercial real estate needs, including transaction support, tenant representation, development, energy and
      environment services, research services, rental services, valuations, and property and asset management.

                                               anders berggren
                                      ceo — eiendomshuset malling & co
MARKET REPORT WINTER 2019 / 2020 - HubSpot
PAGE 4 MARKET REPORT WINTER 2019 / 2020 / MACRO

MACRO – NORWAY                                                                                                                                                                              Norwegian economy that is approximately at a normal level capacity-wise
—                                                                                                                                                                                           with increased oil- and industrial investments, but expected to fall due
Good activity, but still at a slower pace                                                                                                                                                   to declining international demand. DNB Markets’ GDP projections from
going forward                                                                                                                                                                               August are even lower for the period 2019-2021, with 2.3 % for 2019, 1.7 %
                                                                                                                                                                                            in 2020 and 1.5 % in 2021 while their estimate of 1.6 % for 2022 is slightly
The full-year GDP growth estimate for Mainland Norway from Statistics                                                                                                                       higher than SSB’s estimate of 1.4 %. These figures have been adjusted
Norway (SSB) is still set at 2.4 % for 2019, which is considerably higher than                                                                                                              downwards across the board, based on arguments of weaker international
the long-term growth trend of 2.0 %. The latest available estimate for GDP                                                                                                                  growth, increasing trade barriers and a potentially hard Brexit. The
growth in 2020 and 2021 is 2.2 % and 1.6 % respectively, while growth in                                                                                                                    Norwegian Central Bank regional network survey 3/2019 reports an annual
2022 is currently projected to be 1.4 %. Hence, the estimate for 2019 is kept                                                                                                               output growth of 3.0 % which is similar to that reported in May (2.9 %),
at the same level as in our latest report, while GDP growth has been adjusted                                                                                                               with the oil sector experiencing a substantial increase over recent months
downwards by 10, 40, and 50 bps from 2020 to 2022. The uncertainties tied                                                                                                                   and the service sector showing high activity. On the other hand, growth
to the trade war and the outcome of Brexit are the main reasons quoted by                                                                                                                   in construction and domestic-oriented manufacturing has slowed with
most analysts for the more negative outlook given in the most recent updates.                                                                                                               growth in employment falling slightly overall.
Although increased petroleum investments have boosted the Norwegian
economy thus far in 2019, SSB expects a slight decrease in investments for                                                                                                                  Oil prices
field development in 2020 and 2021, which investments in other industrial                                                                                                                   The Brent Crude oil price is down from our latest report and, at the time
categories will not be able to compensate for. This, in combination with other                                                                                                              of writing, is close to USD 60 per barrel. After falling substantially in
factors such as a neutral fiscal policy, weaker employment growth and a weak                                                                                                                August, the oil price increased drastically in September due to the drone
NOK, will affect GDP growth expectations for the time being.                                                                                                                                attack on a Saudi oil production site, which created a lot of uncertainty
                                                                                                                                                                                            about future estimated production capacity. Nevertheless, the facility was
GDP growth                                                                                                                                                                                  up and running again faster than at first anticipated, since when the oil
In our previous market report we reported that SSB’s March estimate                                                                                                                         price has fluctuated between USD 57–62 per barrel. The forward market is
projected mainland GDP growth to be 2.4 % in 2019, 2.3 % in 2020, 2.0%                                                                                                                      now pricing Brent crude oil for the end of 2019 at USD 60 per barrel, while
in 2021, and 1.9 % in 2022. This was however adjusted downwards in their                                                                                                                    the current pricing for year-end 2020 is USD 57 per barrel.
September update. Although their estimate for 2019 was maintained at
2.4 %, the 2020 estimate was reduced by 10 bps to 2.2 %, while the 2021                                                                                                                     Oil investments
estimate was adjusted down by 40 bps to 1.6 % and lastly the estimate for                                                                                                                   SSB forecast NOK bn 182 in oil investments for 2019, an increase of 15.4 %
2022 was reduced by 50 bps to 1.4 %. Among the many reasons they cite                                                                                                                       over 2018. The expectation for 2020 is a slight decrease to NOK bn 174, although
are international economic and political unrest, a neutral fiscal policy and a                                                                                                              this is still a positive revision for 2020 compared to SSB’s projection from
                                                                                                                                                 Source: Statistics Norway (October 2019)

                                                                                                                                                                                                                                                                                   Source: Statistics Norway (October 2019)
MAINLAND GDP GROWTH NORWAY                                                                                                                                                                  MAIN FIGURES (ANNUAL PERCENTAGE
                                                                                                                                                                                                                                         2018    2019E 2020E     2021E 2022E
                                                                                                                                                                                            GROWTH UNLESS OTHERWISE NOTED)
  4.0 %
                                                                                                                                                                                            Consumption in households etc.                 1.9     1.9     2.4     2.2      2.0
                                                                                                         2.40 %

                                                                                                                    2.20 %

  3.0 %
                                                                                                                                                                                            General government consumption                 1.4     2.2     1.8     1.9      1.7
                                                                                                                              1.60 %

                                                                                                                                        1.40 %

  2.0 %
                                                                                                                                                                                            Gross fixed investment                        2.8      6.2     0.9     -1.3    -0.2
   1.0 %
                                                                                                                                                                                             – Extraction and transport via pipelines      1.9    15.4    -1.6     -3.1     4.2
  0.0 %
                                                                                                                                                                                             – Gross investments mainland Norway          3.0      3.9     0.9    -0.8     -1.3
  -1.0 %
                                                                                                                                                                                            Exports                                      -0.2      1.9    6.0      2.3       1.1
  -2.0 %
                                                                                                                                                                                             – Traditional goods                          2.0      4.9     3.8     2.2      1.6
  -3.0 %
           2008

                   2009

                           2010

                                   2011

                                            2012

                                                     2013

                                                              2014

                                                                      2015

                                                                             2016

                                                                                     2017

                                                                                                2018

                                                                                                         2019E

                                                                                                                    2020E

                                                                                                                              2021E

                                                                                                                                        2022E

                                                                                                                                                                                             – Crude oil and natural gas                 -4.8     -2.3    12.3     4.4      1.6

                                                                                                                                                                                            Imports                                        1.9     5.5     1.8     0.2     0.8

                                                                                                                                                                                            GDP                                            1.3     1.6     3.3     1.9      1.4
                                                                                                                                                 Source: Statistics Norway (October 2019)

THE LABOUR MARKET 2006 – 2018 WITH FORECASTS UNTIL 2022
(LABOUR FORCE SURVEY. SEASONALLY ADJUSTED NUMBERS)
                                                                                                                                                                                            Unemployment rate (level)                     3.8      3.6     3.7     3.7      3.8
  5.0 %
                                                                                                                                                                                            Employed persons                               1.6     1.6     0.5     0.3      0.2
  4.0 %
                                                                                                                                                                                            CPI – yearly growth                           2.7      2.2     1.8     1.9      2.0
  3.0 %
                                                                                                                                                                                            Core inflation (CPI-ATE)                       1.6     2.3     2.0     2.0      2.0
  2.0 %
                                                                                                                                                                                            Wages per standard man-year                   2.4      3.0     2.4     2.0      1.6
   1.0 %

  0.0 %                                                                                                                                                                                     Real after-tax lending rate. banks (level)   -0.7      0.1     0.7     0.6      0.5

  -1.0 %                                                                                                                                                                                    NOK per euro (level)                         9.60     9.85   10.04   10.04    10.04
           2007

                  2008

                          2009

                                  2010

                                          2011

                                                   2012

                                                            2013

                                                                   2014

                                                                          2015

                                                                                  2016

                                                                                         2017

                                                                                                  2018

                                                                                                            2019E

                                                                                                                      2020E

                                                                                                                                2021E

                                                                                                                                         2022E

                                                                                                                                                                                            Current balance (NOK bn)                     285      232     284      319     324

     Unemployment rate (Labour force survey)                                     Employment growth (SSB)                                                                                    Current balance (in % of GDP)                  8.1     6.5     7.6     8.2     8.0
MARKET REPORT WINTER 2019 / 2020 - HubSpot
MACRO / MARKET REPORT WINTER 2019 / 2020 PAGE 5

                                                                                Source: Statistics Norway
INFLATION (12-MONTH CHANGE)                                                                                 Unemployment
  5.0 %
                                                                                                            According to the Labour Force Survey (LFS), the number of unemployed
                                                                                                            remained unchanged from February (average of January-March) to August
  4.0 %
                                                                                                            (average of July-September). Since the workforce has increased over the
  3.0 %                                                                                                     period by 32 000 persons, the unemployment rate is down from 3.8 % to 3.7 %
  2.0 %                                                                                                     respectively. Register-based unemployment issued by NAV (the Norwegian
                                                                                                            Labour and Welfare Administration) was 2.2 % in September, down from
   1.0 %
                                                                                                            2.5 % in September one year ago (seasonally adjusted).
  0.0 %
         May. 10
         Sep. 10
          Jan. 11
          May 11
          Sep. 11
         Jan. 12
         May 12
         Sep. 12
         Jan. 13
         May 13
         Sep. 13
         Jan. 14
         May 14
         Sep. 14
         Jan. 15
         May 15
         Sep. 15
          Jan 16
         May 16
         Sep. 16
         Jan. 17
         May 17
         Sep. 17
         Jan. 18
         May 18
         Sep. 18
         Jan. 19
         May 19
         Sep. 19
                                                                                                            Employment and wages
                                                                                                            The latest employment numbers released quarterly, shows a 2.0 % y/y
     CPI       CPI-ATE      Inflation target                                                                growth rate for employment in Norway. The corresponding growth in Oslo
                                                                                                            was 2.8 % (based on workplace). The average monthly basic earnings was
                                                                                                            up 3.4 % over the same period. Wage growth is expected to peak in 2020
                                                                                Source: Statistics Norway
HOUSE PRICE INDEX (2015 = 100)                                                                              with a y/y growth of 3.6 %.
   140
   120                                                                                                      National budget
   100                                                                                                      The budget stimulus is projected to be slightly contractionary next year.
    80
                                                                                                            The government is projecting a good economic environment and a very
    60
    40
                                                                                                            optimistic prognosis for next year’s NBIM fund use, at 2.6 %. This is still a
    20                                                                                                      considerable amount at NOK bn 244, but nonetheless a signal of a tougher
     0                                                                                                      stance and tighter budgets in the years to come for a cost budget which, in
       Q3 1992
       Q3 1993
      Q3 1994
       Q3 1995
      Q3 1996
       Q3 1997
      Q3 1998
      Q3 1999
      Q3 2000
      Q3 2001
      Q3 2002
      Q3 2003
      Q3 2004
      Q3 2005
      Q3 2006
      Q3 2007
      Q3 2008
      Q3 2009
      Q3 2010
       Q3 2011
       Q3 2012
       Q3 2013
      Q3 2014
       Q3 2015
      Q3 2016
       Q3 2017
      Q3 2018
      Q3 2019

                                                                                                            2020, will total NOK bn 1 442.6.

                                                                                                            The stock market
     House price index   House price index Oslo and Bærum                                                   The Oslo Stock Exchange broad index (OSEBX) started the year at over 803
                                                                                                            points, reached almost 900 in April and July, bottomed out at 818 in mid-
                                                                                                            August, before reaching a year high of 911 on 28 October. As at COB 30 October,
May of this year. In summary, investments for 2020 are expected to                                          the index closed at 906, a growth of over 12 % since the start of the year.
decrease by 1.6 % and by a further 3.1 % in 2021, before increasing by 4.2 %
again in 2022.                                                                                              Residential prices
                                                                                                            The September release of the Norwegian residential real estate index
Key policy rate                                                                                             showed that prices increased by 2.6 % nominally from September last year.
After adjusting the key policy rate upwards to 1.50 % in September 2019,                                    CPI rose by 1.5 % over the same period, indicating a 1.1 % real price growth.
the Norwegian Central Bank (NCB) marked the fourth time they have                                           Market activity is high, although the three interest rate hikes seen so far
raised the key policy by 25 bps in the span of a year, marking the end to the                               this year are expected to take effect during the second half of 2019.
historical low of 0.50 % observed since March 2016. The NCB’s assessment
is that capacity utilisation is somewhat above normal, and that underlying                                  Consumption growth
inflation is close to the targeted inflation of 2.0 %. However, the weak                                    According to Statistics Norway, private consumption is forecasted to
NOK may result in higher inflation ahead. The outlook and balance of                                        end up at 2.0 % for 2019, a reduction of 20 bps from the forecast 6 months
risks suggests that the policy rate will most likely remain at the present                                  ago. However, forecasts expect an increase of 50 bps back to 2.5 % in 2020,
level in the coming period, according to the NCB. Many analysts are                                         before decreasing 50 bps again to 2.0 % in 2021 and 2022.
however arguing that the rate increase is too much when compared to the
development in the domestic economy, and especially when compared to
                                                                                                                                                                                                                                                                                       Source: Statistics Norway

                                                                                                             PRODUCTION INDEX FOR CONSTRUCTION (2015 = 100)
what is happening in the global context. Further, an increasing number of
analysts are arguing against the inflation target as the guiding factor for                                    135
the key policy rate altogether.
                                                                                                               125
CPI
                                                                                                                115
The 12-month CPI increase was 1.5 % in September 2019, while CPI ATE
(adjusted for tax changes and excluding energy products) rose 2.2 %,
                                                                                                               105
slightly above the target of 2.0 %. Inflation has shown a decreasing trend
since December 2018.
                                                                                                                95

Currency                                                                                                        85
Statistics Norway expects the NOK to devalue over the coming three years
compared with previous years, with NOK/EUR at 10.04 in 2020–2022. This                                          75
is not surprising with the rather large movements we have seen for the
                                                                                                                      Q1 2012

                                                                                                                                Q3 2012

                                                                                                                                          Q1 2013

                                                                                                                                                     Q3 2013

                                                                                                                                                               Q1 2014

                                                                                                                                                                         Q3 2014

                                                                                                                                                                                   Q1 2015

                                                                                                                                                                                             Q3 2015

                                                                                                                                                                                                       Q1 2016

                                                                                                                                                                                                                 Q3 2016

                                                                                                                                                                                                                           Q1 2017

                                                                                                                                                                                                                                     Q3 2017

                                                                                                                                                                                                                                               Q1 2018

                                                                                                                                                                                                                                                         Q3 2018

                                                                                                                                                                                                                                                                   Q1 2019

                                                                                                                                                                                                                                                                             Q3 2019

NOK over the summer, currently at a very weak level in a historical context.
As at COB on 30 October, the EUR traded at NOK 10.26, USD at NOK 9.24,
and GBP at NOK 11.88.                                                                                            New build                          Rehab
MARKET REPORT WINTER 2019 / 2020 - HubSpot
PAGE 6 MARKET REPORT WINTER 2019 / 2020 / MACRO

MACRO – GLOBAL                                                                      The never ending saga that is Brexit is still not resolved, and the US
                                                                                    bout with China lingers on. To make matters worse, the US has also
—                                                                                   imposed 25 % tariffs on EU goods worth a total of USD bn 7.5. There are
Macroeconomic strain as global growth slows                                         however bright spots on the horizon as well. Unemployment edged down
                                                                                    further to its lowest since May 2008, at 7.4 % in August. Solid consumer
                                                                                    spending and a positive sentiment among enterprises in construction
The pace of global economic activity remains weak after what was a positive         and retail sales has remained more positive than the historical average.
growth outlook came to a grinding halt in the last three quarters of 2018. Since
this shift in momentum, manufacturing activity in particular has weakened           The UK
substantially. We are now back down to levels not seen since the global financial   The UK economy came in at the IMF projection for 2018 at 1.4 % growth,
crisis. Increasing trade and geopolitical tensions have increased the uncertainty   while the projected growth for 2019 has been revised down by 30 bps
over the stability of the global trading system and international cooperation.      to 1.2 % for the full year 2019, before inching back up to 1.4 % in 2020
This is taking its toll on business confidence, investment decisions and global     and 2021. In the longer term, the IMF projects GDP growth to remain
trade. Increased monetary policy accommodation has cushioned the impact of          sluggish at 1.4 % in 2022 and 2023. A hard Brexit was once again avoided,
these tensions on the financial market sentiment and activity, while a generally    this time extending the deadline for another 3 months from 31 October.
resilient service sector has supported growth of employment. Yet the outlook        Although the deal presented by Boris Johnson now seems to garner
remains precarious as the October IMF World Economic Outlook (WEO)                  support in Parliament, the process is still muddy, and the focus has for
forecast global growth at 3.0 % for 2019, its lowest level since 2008/2009,         now shifted to a new government election and the future of the whole
and 30 bps lower than the WEO from April. Growth is projected to pick               Brexit process. There is now a much higher certainty that a hard Brexit
up to 3.4 % in 2020, although this is still a downwards revision of 20 bps          will be avoided, and markets have responded positively to the perceived
compared with April’s report. With uncertainty over the prospects for several       reduced risk. Inflation is expected to remain slightly below the 2 % target
regions, largely due to the projected slowdown in China and the United States,      in the near term, while the labour market appears to remain tight, with
prominent downside risks entail that a much more subdued pace of global             the unemployment rate having stayed at just under 4 % since the beginning
activity could very well materialise. Most analysts are pointing towards policies   of this year. The Bank of England’s (BoE) key policy rate of 0.75 % is to
aimed at defusing trade tensions and reinvigorating multilateral cooperation        remain firm for the foreseeable future, citing in its latest statement on
as a decisive factor in avoiding a low growth scenario. Support for economic        the minutes that “In all circumstances, the Committee will set monetary
activity where needed and addressing financial vulnerabilities that pose risks      policy appropriately to achieve the 2 % inflation target”.
to growth in the medium term will be the second key driver to keeping the
vulnerable global growth momentum in check.                                         The US
                                                                                    According to WEO, the US economy has a projected GDP growth of 2.4 %
Sweden                                                                              for the full year 2019, a decrease of 50 bps from 2018. GDP is expected
According to WEO projections, the Swedish economy is falling further                to drop another 20 bps to 2.1 % in 2020, a further 40 bps to 1.7 % in 2021
into a low growth scenario in 2019. The projected GDP growth for 2019               before flattening out at 1.6 % in 2022 and 2023. The Fed announced today
has been revised down yet again and is now expected to come in at 0.9 %             (30 October) that the Federal Funds Rate would be lowered by 25 bps to
for the year, a full 140 bps below 2018. It is expected to increase back up to      1.50-1.75 %. This marks the third decrease in the federal funds rate since our
1.5 % in 2020, although this is still a good 30 bps below expected growth           last report. But the target range for the federal funds rate going forward
in 2020, according to their last report in April 2019. In the longer term,          is flat, citing that it will assess realized and expected economic conditions
the IMF projects Swedish GDP growth to remain at the lower end, seen                relative to its maximum employment objective and its symmetric 2 %
from a ten-year historical perspective, at 2.1 % in 2021 and at 2.0 % for 2022      inflation objective. Further assessment will take into account a wide range
and 2023. The Swedish Central Bank (SCB) has become more hawkish and                of information, including measures of labor market conditions, indicators
an expected increase to 0.0 % at the upcoming December meeting would
be the second increase this year and a return from the negative territory
for the key policy rate that has been slumping since March 2015. Thereon,
                                                                                                                                                                                                                                                            Source: Eurostat (Q3 2019)

                                                                                    UNEMPLOYMENT RATE IN SELECTED COUNTRIES/AREAS (LFS)
the prospects for any further increases looks bleak for the foreseeable
future. A statement by the SCB has pointed to highly uncertain economic               20 %
cycles and inflation expectations in the global economy in the coming
                                                                                      18 %
years, and it is difficult to foresee any favourable time at which to further
increase the key policy rate.                                                          16 %

                                                                                       14 %
The Eurozone
                                                                                       12 %
According to the WEO, the economy in the Eurozone is projected to show
a growth in GDP for 2019 of 1.2 %. This is a further weakening since our              10 %
last report in June, and a decrease of 70 bps on 2018. From 2020 onwards,
                                                                                       8%
GDP growth will inch its way back up by 20 bps to 1.4 % for the next
couple of years before dropping 10 bps again to 1.3 % in 2023. Based on a              6%

further slowdown in the Eurozone economy and subsequent downward                       4%
pressure on inflation and other data with a negative outlook, analysts
                                                                                       2%
have forecasted a renewed need for policy easing and expectations are that
they will be kept ultra-expansive for a prolonged period. The Eurozone                 0%
                                                                                              Japan
                                                                                                      Germany

                                                                                                                Iceland
                                                                                                                          The US

                                                                                                                                   Norway
                                                                                                                                            The UK
                                                                                                                                                     Denmark
                                                                                                                                                               Ireland
                                                                                                                                                                         EU 28
                                                                                                                                                                                 Portugal
                                                                                                                                                                                            Finland
                                                                                                                                                                                                      Sweden
                                                                                                                                                                                                               Eurozone
                                                                                                                                                                                                                          France
                                                                                                                                                                                                                                   Italy
                                                                                                                                                                                                                                           Spain
                                                                                                                                                                                                                                                   Greece

PMI in September came in at 50.4, weighed down heavily by the
manufacturing PMI at 45.6. The service sector PMI is still positive at 52,
but is in a falling trend. Risk remains high and is skewed to the downside.
MARKET REPORT WINTER 2019 / 2020 - HubSpot
MACRO / MARKET REPORT WINTER 2019 / 2020 PAGE 7

                              RETAIL PORTFOLIO
                        Malling & Co Corporate Real Estate
                     advised H2 Eiendom on the divestment of
                     the 36 000 m2 retail portfolio comprising
                               20 retail properties.

of inflation pressures and inflation expectations, and readings on financial    ANNUAL GDP GROWTH
                                                                                                                 2018    2019E    2020E    2021E    2022E    2023E
and international developments. The Fed will also continue buying               (PERCENT)

                                                                                                                                                                      Source: IMF World Economic Outlook (October 2019)
government bonds at least until the second quarter of next year, but            Global                            3.6      3.0      3.4      3.6      3.6      3.6
referred to these as technical adaptations rather than continued quantitative
                                                                                The US                            2.9      2.4       2.1      1.7      1.6      1.6
easing. Analysts are however having a hard time separating this as
something other than a quantitative easing when compared to previous            EU 28                             2.2       1.5      1.6      1.7      1.6      1.6
programs that the Fed has called quantitative easing. Regardless of what
                                                                                The Eurozone                       1.9      1.2      1.4      1.4      1.4      1.3
name is given, the overarching goal is to bring liquidity into the market to
maintain a stable credit market in an increasingly uncertain time.              Advanced economies                2.3       1.7      1.7     1.6       1.6      1.5

                                                                                Emerging and developing Europe     3.1     1.8      2.5      2.5      2.5      2.6
Emerging markets
The challenges in global GDP growth is tough enough on advanced                 Germany                            1.5     0.5       1.2      1.4      1.3      1.2
economies, but it is really taking its toll on emerging economies to
                                                                                France                             1.7      1.2      1.3      1.3      1.4      1.4
an even higher degree, although growth figures are still higher in percentage
terms. As advanced economies have a higher degree of service-related            The UK                             1.4      1.2      1.4      1.5      1.5      1.5
activity, emerging economies have a much larger manufacturing and
                                                                                Sweden                            2.3      0.9       1.5      2.1     2.0      2.0
goods-based platform. In the current climate, goods and manufacturing
across the globe are feeling the repercussions of the ongoing trade war         Denmark                            1.5      1.7      1.9      1.7      1.6      1.5
between the US and China to an even higher degree than more service-
                                                                                Italy                             0.9      0.0      0.5      0.8      0.7      0.6
based advanced economies. On a more positive note, a slightly higher
growth rate is projected for 2021–2024 for emerging markets. This global        Japan                             0.8      0.9      0.5      0.5      0.5      0.5
growth pattern reflects the current major downturn, and the subsequent
                                                                                China                             6.6       6.1     5.8      5.9      5.7      5.6
projected recovery in emerging market economies. By contrast, growth
is expected to moderate into 2020 and beyond for a group of systemic            Russia                            2.3       1.1      1.9     2.0      2.0       1.9
economies comprising the United States, the Eurozone, China, and Japan
                                                                                Middle East and Central Asia       1.9     0.9      2.9      3.2      3.2      3.3
which together account for close to half of global GDP.
MARKET REPORT WINTER 2019 / 2020 - HubSpot
PAGE 8 MARKET REPORT WINTER 2019 / 2020 / OSLO OFFICE MARKET

OSLO OFFICE MARKET                                                                                                                                                     survey must also be taken into account. The Stavanger region is also doing
                                                                                                                                                                       well with almost 5 500 additional registered wage earners from Q2 2018 to
—                                                                                                                                                                      Q2 2019. This corresponds to an impressive 3.9 % growth, clearly supported
Employment and demand for office space                                                                                                                                 by the underlying potential in the employment market in the region
                                                                                                                                                                       that was heavily affected by the oil price drop in 2014 and the following
Growth in employment expected to slow down                                                                                                                             reductions in workforce.

                                                                                                                                                                       Growth in employment will probably slow down in 2020
Employment has accelerated over the years in Greater Oslo. The growth has                                                                                              At the time of writing this report, there are few signs of a slowdown in
been much stronger than expected, and much stronger compared with the                                                                                                  the growth in employment. The growth seems to have remained strong
employment growth for the country. So far, the outlook for further growth in                                                                                           into the first half of 2019, also in Oslo where growth has stayed way above
employment is strong, but we are seeing some key parameters that most likely                                                                                           the national level. However, the relative difference in growth between the
will put a brake on growth. Despite being slower, growth is still continuing and                                                                                       country as a whole and Greater Oslo is shrinking. According to SSB’s wage
this will create further demand for office space.                                                                                                                      earner numbers, the growth from Q2 18 to Q2 19 was 2.0 % for the country
                                                                                                                                                                       and 2.8 % for Oslo, Asker and Bærum (Greater Oslo) combined. This is
Strong growth in employment so far in 2019                                                                                                                             higher than last year with 1.7 % and 2.7 % respectively.
The register-based unemployment numbers from The Norwegian Labour
and Welfare Administration (NAV) have been showing a decreasing trend                                                                                                  However, we are lacking up-to-date figures for the employment market
for the country since 2016. In the same period, employment has been strong                                                                                             over the summer as Q3 numbers for registered employment will not be
and figures have steadily increased by more than 130 000 since Q1 2006,                                                                                                available until mid-November (only LFS available at the time of writing).
according to the quarterly national accounts. This increase has come from                                                                                              If we look at the Manpower Employment Outlook Survey (MEOS) for Q4,
a combined increase in the workforce and reduced job vacancy. The growth                                                                                               which identifies net expected staffing for the next quarter (see definition *),
in employment is strong and seems to be continuing into 2019 with a 2.0 %                                                                                              they report a national net outlook at + 10 % for Q4, up from + 4 % seasonally-
growth in registered wage earners for the country, and 2.8 % for Oslo,                                                                                                 adjusted for Q4 2018. In Greater Oslo, the accuracy of the survey becomes
measuring Q2 2018 vs. Q2 2019. In Oslo, the increase amounts to almost                                                                                                 significantly lower, but we know that net results are on a rising trend,
16 000 new wage earners (workplace in Oslo), over the same period. The                                                                                                 ending at + 15 % in Q4 2019 against a neutral level in Q4 2018. The MEOS
latest available Q3 LFS survey from Statistics Norway also supports a                                                                                                  Q4 study was performed just after the summer. Other indicators pointing
continued increase in employment in Oslo and Akershus with a 3.9 %                                                                                                     towards slower growth may not be apparent in the MEOS study until the Q1
growth from Q3 2018, although the underlying uncertainty in the LFS                                                                                                    report is released in December 2019. Other employment indicators, like the
                                                                                                                 Source: Norwegian labour and welfare administration

                                                                                                                                                                                                                                                                                                                                                      Source: Manpower Employment Outlook Survey (Q4 2019 )
REGISTER BASED UNEMPLOYMENT                                                                                                                                            NET EMPLOYMENT OUTLOOK* – DEVELOPMENT OVER TIME (SEASONALLY ADJ.)

   5.0 %                                                                                                                                                                 20 %
   4.5 %                                                                                                                                                                  15 %
  4.0 %
                                                                                                                                                                          10 %
   3.5 %
   3.0 %                                                                                                                                                                   5%
   2.5 %                                                                                                                                                                  0%
  2.0 %                                                                                                                                                                   -5 %
   1.5 %
                                                                                                                                                                         -10 %
   1.0 %
                                                                                                                                                                                     Q1 2012
                                                                                                                                                                                               Q3 2012
                                                                                                                                                                                                         Q1 2013
                                                                                                                                                                                                                   Q3 2013
                                                                                                                                                                                                                              Q1 2014
                                                                                                                                                                                                                                        Q3 2014
                                                                                                                                                                                                                                                  Q1 2015
                                                                                                                                                                                                                                                            Q3 2015
                                                                                                                                                                                                                                                                      Q1 2016
                                                                                                                                                                                                                                                                                Q3 2016
                                                                                                                                                                                                                                                                                          Q1 2017
                                                                                                                                                                                                                                                                                                    Q3 2017
                                                                                                                                                                                                                                                                                                              Q1 2018
                                                                                                                                                                                                                                                                                                                        Q3 2018
                                                                                                                                                                                                                                                                                                                                  Q1 2019
                                                                                                                                                                                                                                                                                                                                            Q3 2019
                                                                                                                                                                                                                                                                                                                                            Q4 2019

   0.5 %
  0.0 %
             2006

                    2007

                           2008

                                  2009

                                         2010

                                                2011

                                                       2012

                                                              2013

                                                                     2014

                                                                            2015

                                                                                   2016

                                                                                          2017

                                                                                                 2018
                                                                                                        Sept.
                                                                                                        2019

                                                                                                                                                                            Norway         Greater Oslo
                                                                                                                                                                        *Net employment outlook is derived by taking the percentage of employers anticipating an
                                                                                                                                                                        increase in hiring activity and subtracting from this the percentage of employers expecting
    Norway in total           Oslo         Rogaland                                                                                                                     to see a decrease in employment at their location in the next quarter.
                                                                                                                 Source: Statistics Norway

                                                                                                                                                                                                                                                                                                                                                      Source: Statistics Norway

NATIONAL ACCOUNTS, QUARTERLY EMPLOYMENT                                                                                                                                CHANGE IN WAGE-EARNERS PER COUNTY Q2 2019 VS. Q2 2018

  2 900                                                                                                  1.5 %                                                           18 000
  2 850                                                                                                                                                                  16 000
  2 800                                                                                                  1.0 %
  2 750                                                                                                                                                                  14 000
  2 700                                                                                                 0.5 %                                                             12 000
  2 650
                                                                                                                                                                         10 000
  2 600
                                                                                                        0.0 %
  2 550                                                                                                                                                                   8 000
  2 500
                                                                                                        -0.5 %                                                            6 000
  2 450
  2 400                                                                                                                                                                   4 000
  2 350                                                                                                 -1.0 %                                                            2 000
           Q1 2008
           Q3 2008
           Q1 2009
           Q3 2009
            Q1 2010
           Q3 2010
             Q1 2011
            Q3 2011
            Q1 2012
            Q3 2012
            Q1 2013
            Q3 2013
            Q1 2014
           Q3 2014
            Q1 2015
            Q3 2015
            Q1 2016
           Q3 2016
            Q1 2017
            Q3 2017
            Q1 2018
           Q3 2018
            Q1 2019

                                                                                                                                                                                 0
                                                                                                                                                                                      Greater Oslo**                         Drammen Stavanger region***                                       Bergen                       Trondheim

    Employed persons seasonally adjusted, in 1 000 (l.a.)                                                                                                               **Oslo, Asker and Bærum ***Randaberg, Stavanger, Sola, Sandnes
    Employed persons seasonally adjusted, percentage change from previous quarter (r.a.)
MARKET REPORT WINTER 2019 / 2020 - HubSpot
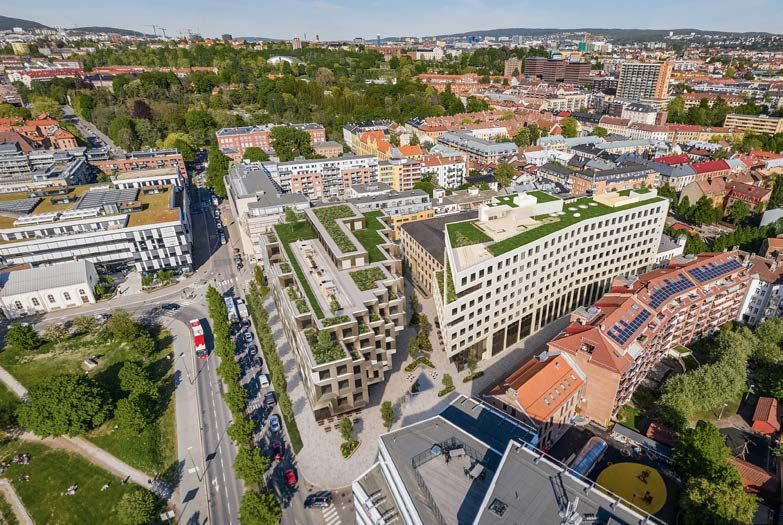
OSLO OFFICE MARKET / MARKET REPORT WINTER 2019 / 2020 PAGE 9

Regional network survey from the Central Bank and the business tendency        Demand for office space will continue growing
survey for the third quarter of 2019, show a somewhat weaker outlook for       When analysing office demand we need to look at the lagging effect
employment in the eastern region, as well on a national basis.                 of recent years’ strong and rising employment growth, as well as the
                                                                               noticeable effects on demand so far. According to our calculations, we
All figures for the actual development in November will be available after     should see lower vacancies in the market compared to what we have
the editorial date of this report, although we have seen a few signs that      observed. That is probably explained by the lagging effect of increased
the growth in employment will decrease over the coming year. The first         employment at current contract structures. We have observed that
argument is the overall macroeconomic environment, which changed to            tenants are now keener to increase office space, probably caused by the
a slightly more negative outlook over the summer. Secondly, historical         lack of space within current contracts, which has absorbed much of the
employment figures indicate that growth will diminish after a period           employment growth until now. This lagging effect will continue to push
of strong growth. For Oslo’s part, we can look at the rate of employment       demand despite the somewhat lower anticipated growth in employment.
among the Oslo population and compare it to previous highs from                Not only will the growth in employment remain at a decent level, we
2007/2008. In the age group 25–66 we are seeing employment rates at almost     are also seeing strong growth in typical office-intensive occupations.
2007/2008-levels, combined with almost 9 % increased net commuting into        ICT services, business service sector, technical services and property
Oslo from 2015–2018. If the growth in employment continues at the same         management are strong growing sectors.
pace, we need to see additional increases in net commuting and/or further
increased net mobility into Oslo. The capacity limits therefore seem closer    Demand for office space will continue growing
to maximum levels, and hence we believe that the growth in employment          Demand from flexible office providers has been strong in Oslo like
will be curbed for Oslo into 2020. The latest outlook among industrial         other markets with a yearly take-up of almost 30 000 m2, last year, and
leaders, showing weaker optimism for Q4 2019, supports somewhat                almost 25 000 m2 registered so far this year. Flexible office providers now
slower growth. We also believe that the ongoing trouble within the retail      constitute around 1.5 % of the total Oslo Office market, so the market has
sector will have an effect on employment numbers in the coming year,           not matured as fast as in e.g. London, Amsterdam and Paris. Since we are
although this will not have a negative effect on office demand. It may also    now seeing companies like WeWork reducing growth expectations, and
create additional capacity to increase office employment, as the retail        relatively low occupancy rates among current flexible office providers, we
workforce declines.                                                            believe that this demand side will be curbed somewhat over the coming
                                                                               years, however we still expect a more moderate continued growth.
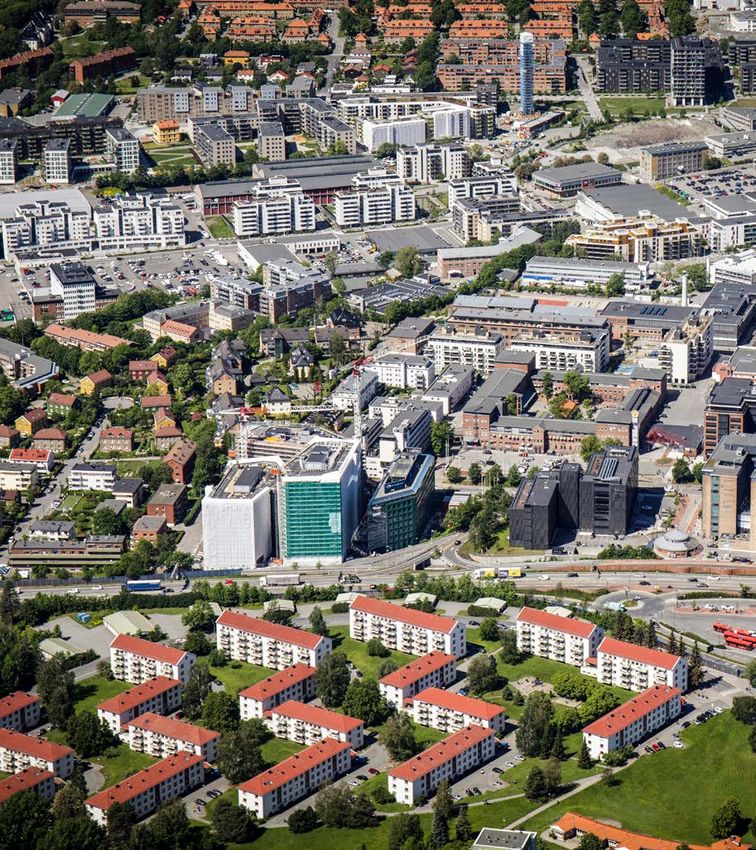
                           URTEKVARTALET, OSLO
                         On behalf of Eiendomsspar AS,
                     Malling & Co Næringsmegling has leased
                       15 800 m2 to Høyskolen Kristiania.
MARKET REPORT WINTER 2019 / 2020 - HubSpot
PAGE 10 MARKET REPORT WINTER 2019 / 2020 / OSLO OFFICE MARKET

Office search mapping
Decline in search volumes as expected
—
The activity in the market for office searches in terms of total space is at the time of   Supply of new construction curbed by a few large tenants
writing 35 % below the 2018 level YTD measured in m2. Office search volumes                The search market is of special interest for developers as it is the main
have been particularly weak among larger tenants (› 2 500 m2), which is                    source for large lease contracts that are needed to initialise new projects
expected due to the fact that contract expiry profiles in 2–3 years are small for          requiring an anchor tenant. For a developer, both timing and size need
larger tenants. Based on the outlook, the total office search volume for the year          to match the project to be attractive. The low expiry of larger leases
will end at the lowest level seen since 2015, or close to the 2017 level.                  means less likelihood of newbuild initiators. We are seeing only a few
                                                                                           developers initiating on speculation. This means that we expect new
Search volumes down while employment is up                                                 construction to be more or less set for 2021 and 2022, and that developers
Search volumes are in general affected by the structure of expiring lease                  will focus on new supply to finalise in 2023–2024. Low vacancy in
agreements for large tenants, and expiry volumes will be low in 2021                       the city centre also increases the likelihood of tenants currently on search
and 2022, 30–40 % lower than expected in 2024. The search volumes are                      to renew their leases in a total cost/alternative analysis of the market
therefore expected to stay moderate for 2019 and not increase until tenants                opportunities.
with lease expiry in 2023 start searching (will probably stay low for the rest
of the year, and increase somewhat late next year). Landlords and tenants                  City centre remains strong in demand
are already planning for 2023 so the activity in the leasing market may                    While some office clusters in the fringe like Helsfyr are seeing increased
remain at a good level. We are also seeing that the effects of higher growth               demand, the general trend is still that 8/10 tenants are searching in the
in employment are gradually affecting take-up, although the effect is                      city centre, and almost 50 % only consider the city centre. This reflects the
difficult to measure as it is mostly spread among a slightly higher demand                 leasing risk difference for assets in the fringe and in the city centre. That
for space among several tenants.                                                           being said, we still see that proximity to public transport continues to be
                                                                                           the main driver for demand in both the city centre and fringe. Proximity
Public tenants around 20 % share                                                           means in general less than 5 minutes’ walking distance.
In 2016, public tenants constituted more than half the volume of office
searches, while this share is now at around 20 %. In 2018, we were seeing a                Many searches to be resolved by the end of the year
similar share of public tenants among office searchers. Other than public                  As usual, many search processes tend to be resolved before year end, and
sector, the remaining share is spread across different sectors, none of                    this will most likely happen this year as well. Of the 40 searches for over
them taking a very large share. IT/Telecom and Media have been active                      1 000 m2, only a handful have been resolved at this point, but many of the
searchers in 2019.                                                                         larger searches are in final discussions and are anticipated to have reached
                                                                                           a lease agreement by the end of the year. We are also seeing a few of the
                                                                                           larger ones probably being pushed into the next year.

                                                                                                                                                                              Source: Malling & Co / NEmeet
                                                                                           OFFICE SEARCHES GREATER OSLO 2019*, SIZES (M2) AND OVERLAP

    About the analysis and database
    Tenant representation agents map tenants’ requirements regarding
    location and facilities, and manage the actual search for new commercial
    space. This applies to office space, combined premises, and retail and                                                                         Fringe zone east
                                                                                                      Fringe zone west
    warehousing/logistics premises. Larger tenants are more likely to                                                                7%
                                                                                                                         9%
    use tenant representation agents, but many small and medium-sized
                                                                                                                                               8%
    enterprises also obtain assistance during their relocation processes.
    We register and systematise all active property searches covering the                                                         25 %
    Greater Oslo area. This makes it possible to analyse one of the main                                             7%

    sources for take-up in the market. Our figures show that rental searches                                                                  4%

    account for between 15 % and 50 % of the total annual volume (measured
    in square metres) of signed office lease agreements. Our analysis of market
    searches goes back to 2009 and includes more than 1 600 searches to date
    – two thirds of which are pure office market searches. This enables us to                                                 40 %
    study the demand side trends in detail, and to help our clients to offer                                                                       Central Oslo
    and invest in the right project for the end user.

                                                                                                                                                     *As at 18 October 2019
OSLO OFFICE MARKET / MARKET REPORT WINTER 2019 / 2020 PAGE 11

                             BRYNSVEIEN 14, OSLO
                   Malling & Co Leietakerrådgivning has advised
               Lowell Norge AS in signing their new office (2 356 m2)
                  overlooking Bryn and the city from the top floor.
                             Landlord is Ferd Eiendom

                                                                                          Source: Malling & Co / NEmeet

                                                                                                                                                                                                                           Source: Malling & Co / NEmeet

OFFICE SPACE SEARCHES GREATER OSLO 2009–2019* (M2)                                                                        AVERAGE YEARS* BETWEEN PUBLICATION OF MARKET SEARCH AND DESIRED
                                                                                                                          LEASE STARTUP, DIVIDED INTO SIZE SEGMENTS (2018–2019**)
 400 000
                                                                                                                           3.0
 350 000
                                                                                                                           2.5
 300 000
                                                                                                                           2.0
 250 000
                                                                                                                           1.5
 200 000
                                                                                                                           1.0
 150 000
                                                                                                                           0.5
 100 000
                                                                                                                           0.0
  50 000
                                                                                                                                           m2
                                                                                                                                 m2

                                                                                                                                                      m2

                                                                                                                                                                 m2

                                                                                                                                                                               m2

                                                                                                                                                                                         m2

                                                                                                                                                                                                     m2

                                                                                                                                                                                                               m2

       0
                                                                                                                                           9
                                                                                                                               9

                                                                                                                                                      9

                                                                                                                                                                  9

                                                                                                                                                                             9

                                                                                                                                                                                        9

                                                                                                                                                                                                     9

                                                                                                                                                                                                             9
                                                                                                                                        99
                                                                                                                             49

                                                                                                                                                    49

                                                                                                                                                               99

                                                                                                                                                                           99

                                                                                                                                                                                     99

                                                                                                                                                                                                 99

                                                                                                                                                                                                           99

           2009 2010 2011 2012 2013 2014 2015 2016 2017 2018 2019*
                                                                                                                                      0–
                                                                                                                           0–

                                                                                                                                                –1

                                                                                                                                                           –1

                                                                                                                                                                           2

                                                                                                                                                                                     4

                                                                                                                                                                                                 9

                                                                                                                                                                                                          ›9
                                                                                                                                                                       0–

                                                                                                                                                                                    0–

                                                                                                                                                                                              0–
                                                                                                                                   50

                                                                                                                                               00

                                                                                                                                                          00

                                                                                                                                                                      00

                                                                                                                                                                                00

                                                                                                                                                                                            00
                                                                                                                                           10

                                                                                                                                                      15

   0–499 m2     500–999 m2     1 000–2 499 m2
                                                                                                                                                                 2

                                                                                                                                                                               3

                                                                                                                                                                                         5

   2 500–4 999 m2    >= 5 000 m2                                 *As at 18 October 2019                                                                                        *Same year = 0.5. **As at 18 October 2019
PAGE 12 MARKET REPORT WINTER 2019 / 2020 / OSLO OFFICE MARKET

Construction activity in Greater Oslo
Greater Oslo is entering a period of increased construction levels
—
After several years of high conversion levels and few new constructions, 2019                    be markedly down in 2021–2022, it is likely that many of the projects
appears to be the last year in which we will have gross construction levels                      currently expected in this period will be postponed, unless speculative
below the historical average (135 000 m2 a year). We are now entering a period                   construction increases.
of increased construction, brought about by the scarce office vacancy and
growth in employment that Oslo has experienced during the last three years,                      Overall, the largest new potential construction volume is still expected at
as well as by large tenants that have been attracted to sign leases in some of                   Økern/Løren/Risløkka, with a total volume of approx. 500 000 m2 recorded
the new projects. Nevertheless, it is not a given that all projects on the radar                 in our database. However, around 61 % of this volume is currently not zoned
will be initiated. As usual, it has taken the industry some time to manoeuvre                    and will therefore most likely materialise gradually over a longer term as
itself in order to meet the increase in demand. Whether the volumes currently                    this office cluster becomes established. This is also the case for the Inner
in the pipeline for 2021–2022 will materialise depends to a large extent on the                  City where 73 % of the total volume (400 000 m2) is still in zoning. Most
attainability of large lease contracts in coming years.                                          of the volume in the Inner City is expected in the areas surrounding the
                                                                                                 central station and in Schweigaards gate. Zoning is often particularly time-
Gross new construction in Greater Oslo will be approx. 100 000 m2 in 2019.                       consuming for projects in the dense Inner City. These areas will undergo
Since our last report Dronning Mauds gate 10 (refurbishment and new                              a massive transformation during the next 10 years, however it involves
space) and Skøyen Atrium III have been completed. The last remaining                             a significant portion of demolition, meaning that the net effect will be
construction for 2019 is Brynsveien 14, which is partly let out to Sophie                        smaller than what might initially be expected. Over the short term however,
Minde and Lowell Norge and will be completed during the fourth quarter.                          it is mostly Økern/Løren/Risløkka and Bryn/Helsfyr that that will have the
The gross estimate for 2020 currently stands at approx. 160 000 m2. The                          largest volume of new office space.
volume includes two fully available buildings, namely Freserveien 1
(~ 30 000 m2) and Lørenveien 65 (~ 19 000 m2). They are both being
built on speculation. A few examples of other prominent projects which
will be completed in 2020 are Fyrstikkalléen 1, Harbitz Torg and Valle View.                        Project definitions
                                                                                                    The confirmed volume includes all new constructions that are zoned
There are now five new constructions that are confirmed to be completed                             and will be initialised either because they have secured a sufficient
in 2021, making up a total gross space of approx. 126 500 m2 in office.                             tenant base or because they will build on speculation. The likely volume
Examples include Tullinkvartalet, VIA and Økern Portal. Another 54 000 m2                           includes all projects that are zoned, and which we deem as likely to be
of readily zoned office space is also currently in the pipeline for 2021 and                        able to secure tenants. The potential volume includes all remaining
are either in the market awaiting tenants or in planning. As for 2022, the                          projects in the pipeline, including projects that are currently in zoning
volume is still mostly made up of unsecured projects. The volume currently                          or at planning/idea stage. This group is therefore highly uncertain and
in the pipeline for 2022 sums up to approx. 210 000 m2, of which 80 000 m2                          subject to large changes.
is readily zoned. However, as the expected expiry of large contracts will

                                                                                                                                                                                      Source: Malling & Co
COMPLETION OF NEW OFFICE BUILDINGS IN GREATER OSLO AND EARLIEST POSSIBLE COMPLETION OF PROJECTED NEW OFFICE BUILDINGS (IN M²)*

   400 000

   300 000

   200 000

    100 000

          -

   -100 000

  -200 000
                2007        2008        2009   2010         2011        2012    2013      2014      2015     2016     2017      2018     2019     2020      2021      2022

    Confirmed      Likely          Potential   Conversion          Demolition   Average                                                                      *As at 30 October 2019
OSLO OFFICE MARKET / MARKET REPORT WINTER 2019 / 2020 PAGE 13

                                                                                                                                                                                                                                Source: Malling & Co
OFFICE CONSTRUCTION VOLUMES SPLIT BY STATUS AND CLUSTER (M2)

   Økern / Løren / Risløkka
                    Inner city

               Bryn / Helsfyr
                         CBD
                     Lysaker
                      Skøyen

                       Asker
 Forskningsparken / Ullevål
       Nydalen / Sandaker
              Oslo outer east
              Oslo outer west
                    Sandvika
                 Kvadraturen

                     Fornebu
          Oslo outer south

                  Majorstuen
                     Bjørvika

                                 -            50 000         100 000      150 000      200 000                          250 000       300 000         350 000         400 000         450 000       500 000        550 000

   Under construction                Signed lease contract       Waiting for tenants        Planning                           Zoning not completed
                                                                                             Source: Malling & Co

                                                                                                                                                                                                                                 Source: Malling & Co
CONFIRMED AND ESTIMATED COMPLETIONS OF NEW OFFICE SPACE                                                               CONFIRMED NEW OFFICE BUILDINGS THAT WILL BE FINALIZED 2019–2021
THE NEXT FIVE YEARS, SPLIT BY CITY AREA (M2)

                        192 700

                                                                       402 306
                                                                                                                               OSLO OUTER WEST                                                             OSLO OUTER EAST

                       240 362                                                                                                                   OSLO WEST

                                                                                                                                                                                        OSLO EAST

   Fringe zone west        Central Oslo       Fringe zone east                                                                                                  INNER CITY

                                                                         BÆRUM

                                                                                                                                                                                                             OSLO OUTER SOUTH

      ASKER                                                                                                                                                                   Year      2019        2020         2021
                                                                                                                    The size of the bubble represents the volume
                                                                                 15 000 m2
                                                                                                                                                                             Signed
                                                                                                                    of new office buildings in each office cluster.
                                                                                                                                                                             Vacant
PAGE 14 MARKET REPORT WINTER 2019 / 2020 / OSLO OFFICE MARKET

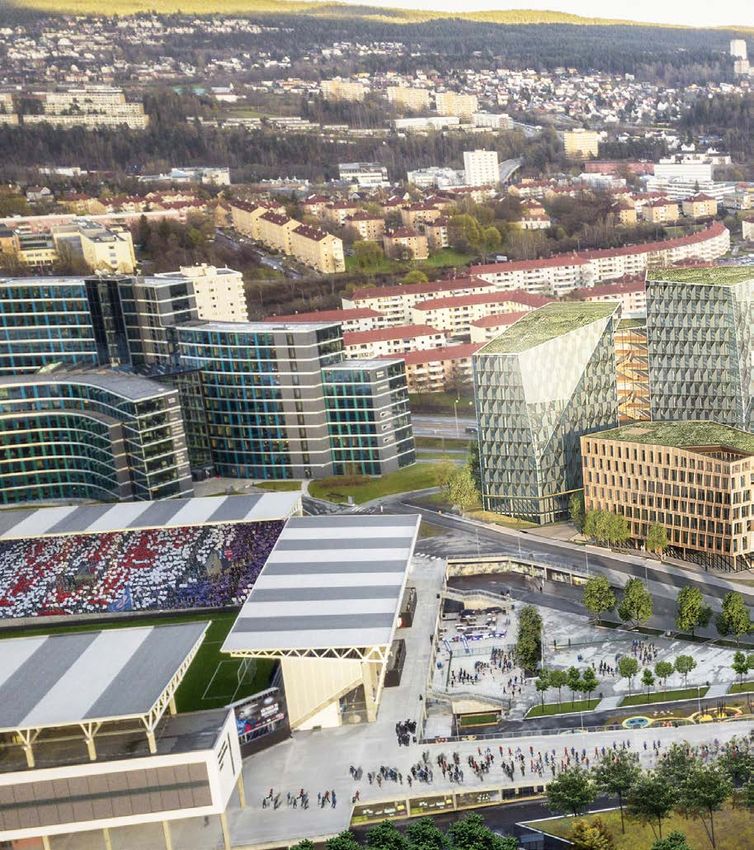
                     PROJECT VALLE, HELSFYR
                 Malling & Co Corporate Real Estate was
               the advisor for NCC Property Development in
                the sales process of the 60 000 m2 office
                  project under development at Helsfyr.
OSLO OFFICE MARKET / MARKET REPORT WINTER 2019 / 2020 PAGE 15
PAGE 16 MARKET REPORT WINTER 2019 / 2020 / OSLO OFFICE MARKET

Supply and vacancy in Greater Oslo
Continued low vacancy but increases expected due to higher construction activity
—
Vacancy in Greater Oslo remains at a low level, although it has increased                                              The availability of office space over 10 000 m2 has decreased greatly
slightly since our previous market report and is currently measured at 5.2 %.                                          over the last 3–4 years. Comparing Q3 2019 to Q3 2017, the supply of
This is in line with our prediction that vacancy will remain at a low level                                            space greater than 10 000 m2 has fallen by 64 %. Not surprisingly, this
throughout 2019 before increasing in 2020. Vacancy is still at its lowest in                                           segment is particularly scarce in central Oslo with only two spaces
central Oslo with barely 4 % vacant office space, while the eastern fringe                                             currently on the market, while it is highest in the eastern fringe with five
and the western fringe is at 6 % and 7 % respectively. Total offered supply                                            spaces. Traditionally this segment has consisted of larger newbuilds or
remains neutral at 6.6 % and has not changed much since our previous                                                   refurbishments that are fully vacated, hence this decrease is consistent
report. We maintain our forecast from May that vacancy will increase                                                   with the low new construction level we have had over the last years. As
gradually in 2020, as more new constructions are approaching completion                                                new construction is expected to increase from 2020 onwards, we expect
and added to the market.                                                                                               the availability of larger office space to increase likewise.

While vacancy in both central Oslo and the western fringe remains at                                                   Total supply in Greater Oslo is currently at 6.6 %. It has increased slightly
the same levels as in May, the vacancy in the eastern fringe has increased                                             since its lowest point in Q1 2019, however it is nowhere near its peak of 12.6 %
from 5 % to 6 %. Amongst the reasons for this increase is the inclusion                                                in Q2 2017. We expect supply to increase gradually going forward as new
of Lørenveien 65 and Østre Aker vei 20 to the vacancy count. While                                                     construction is expected to increase from 2020–2022. Currently around
Lørenveien 65 is a newbuild and has up until Q2 2019 been counted as a                                                 7 % of the total advertised space (total supply) is available from 2020, 10 %
part of supply, Østre Aker vei 20 has been treated as supply rather than                                               is available from 2021 and 14 % is available from 2022. While the space
vacant space as it is not available for tenants until Q2 2020. The increase                                            that is available from 2020 is already included in vacancy, the remaining
in vacancy in the eastern fringe is in line with our prediction that                                                   82 000 m2 will be added to vacancy in 2020 and 2021 as the newbuilds
vacancy will increase, starting with the clusters that have the highest                                                approach completion. Moreover, there are many more newbuilds in the
potential new construction volume. Around 50 % of the confirmed new                                                    pipeline that are not yet on the market, but are likely to enter it over the
construction volume in our database between 2019–2022 is expected in the                                               next few years. We expect to see the effect of increased construction on
eastern fringe.                                                                                                        both supply and vacancy from mid-2020.

                                                                                                                                                                                                                                                                                                                      Source: Malling & Co/FINN.no
                                                                                        Source: Malling & Co/FINN.no

OFFICE SPACE FOR RENT IN DEFINED OFFICE CLUSTERS (M²) PER SIZE INTERVAL                                                AVAILABILITY OF OFFICE SPACE ABOVE 2 000 M² OFFERED AT FINN.NO*

  1 200 000                                                                                                                                                                                       18 000
  1 000 000                                                                                                                                                        64 203

   800 000

   600 000                                                                                                                                           39 562

   400 000

   200 000

          0
                                                                                                                                                                                                                                                         371 531
               Q1 2011
              Q2 2011
              Q3 2011
              Q4 2011
              Q1 2012
              Q2 2012
              Q3 2012
              Q4 2012
              Q1 2013
              Q2 2013
              Q3 2013
              Q4 2013
              Q1 2014
              Q2 2014
              Q3 2014
              Q4 2014
              Q1 2015
              Q2 2015
              Q3 2015
              Q4 2015
              Q2 2016
              Q3 2016
              Q4 2016
               Q1 2017
              Q2 2017
              Q3 2017
              Q4 2017
              Q1 2018
              Q2 2018
              Q3 2018
              Q4 2018
              Q1 2019
              Q2 2019
              Q3 2019
              Q1 2016

    Below 1 001 m2    1 001–5 000 m2        5 001–10 000 m2     Larger than 10 000 m2                                      2019               2020                       2021                  2022                                                                   *As at 24 October 2019
                                                                                        Source: Malling & Co/FINN.no

                                                                                                                                                                                                                                                                                                                      Source: Malling & Co/FINN.no

OFFICE SPACE FOR RENT DIVIDED INTO OFFICE CLUSTERS PER OCT 2019 (M²)                                                   VACANCY IN CENTRAL OSLO, EASTERN AND WESTERN FRINGE ZONE

   100 000                                                                                                                12 %
    90 000
    80 000                                                                                                                10 %
    70 000
    60 000                                                                                                                 8%
    50 000
    40 000
    30 000                                                                                                                 6%
    20 000
    10 000                                                                                                                 4%
         0
                                                                                                                           2%
                      Fo D
                                 u

                                 n
           Ny Ma ker

                    /S en

                                 r

                                 a
                   ke vika
                               en

                                ål
                   n/ city

                      /H a

                       Ly r

                       Sk r

                              ke
                              fy

                              ke

                             vik
                 Kv neb

                              re
                               k

                            CB

                            lev
                len tu
                            øy
                Br løk
                          els

                          As

                          da
                           tu
                          sa

                         jør

                           d
                           r

              da jors

                         Ul
                          r
              Lø ne

              sp an
                        ra
                         s

                       an

                                                                                                                           0%
                       B
                      Ri

                      n/
                     ad
                     In

                     S
                   yn

                                                                                                                                                                                                                                                          Q1 2017
                                                                                                                                                                                                                                                                    Q3 2017
                                                                                                                                                                                                                                                                              Q1 2018
                                                                                                                                                                                                                                                                                        Q3 2018
                                                                                                                                                                                                                                                                                                  Q1 2019
                                                                                                                                                                                                                                                                                                            Q3 2019
                                                                                                                                                                                                                                                                                                            Q4 2019
                                                                                                                                 Q1 2011
                                                                                                                                           Q3 2011
                                                                                                                                                     Q1 2012
                                                                                                                                                               Q3 2012
                                                                                                                                                                         Q1 2013
                                                                                                                                                                                   Q3 2013
                                                                                                                                                                                             Q1 2014
                                                                                                                                                                                                       Q3 2014
                                                                                                                                                                                                                 Q1 2015
                                                                                                                                                                                                                           Q3 2015
                                                                                                                                                                                                                                     Q1 2016
                                                                                                                                                                                                                                               Q3 2016
                 re

                ar
            n/

          ing
         er

        kn
       Øk

      rs
    Fo

    Number of m2 offered within 12 months       Number of m2 offered beyond 12 months                                      Fringe zone east                              Fringe zone west                                  Central Oslo                               *As at 24 October 2019
OSLO OFFICE MARKET / MARKET REPORT WINTER 2019 / 2020 PAGE 17

                           BYPORTEN, JESSHEIM
                  Malling & Co Næringsmegling AS has been
                 responsible for the letting of approx. 7 000 m2
                   big box retail space to well-known tenants.

How we measure supply
When analysing the supply side of the rental market, we also want to describe what is available for prospective tenants, not only vacant space. Therefore, we
split the total amount of offered office space into two definitions: supply and vacancy. Supply includes all projects and vacancies regardless of delivery date, and
vacancy comprises only existing or new projects available for delivery within 12 months from the date of measurement. To be precise, we define supply as all
office space that is available in the market, including existing buildings and new constructions. Projects offered in specific processes to tenants looking for space,
but which are not available on the online marketplace FINN.no, are not included in the figures. Normally, these projects end up at FINN.no. This means that
the potential supply is even higher than that reported in these figures, however vacancy is a more exact measure. Including a measure of available new office
projects helps explain possible discrepancies in a simple supply/demand relationship, looking at rents and vacancy only.
PAGE 18 MARKET REPORT WINTER 2019 / 2020 / OSLO OFFICE MARKET

Vacancy* and supply**
—
* Advertised office space within 12 months at FINN.no of the total office stock in Greater Oslo.
** Advertised office space at FINN.no of the total office stock in Greater Oslo. This includes potential advertised new projects.

Note: Vacancy and supply is measured as an average of the vacancy and supply in the defined office clusters. From H2 2019 we
have made changes to our office clusters. Billingstad has been removed as this area has gradually developed into being mostly
residential and big-box retail. However, we have added Forskningsparken/Ullevål as an office cluster as this is a growing area
that has reached our definition of cluster.

    VACANCY* IN DEFINED OFFICE CLUSTERS
    – Up approx. 30 bps in the past 12 months                           5.2 %
                                                                                                                                                         BÆRUM

    SUPPLY** IN DEFINED OFFICE CLUSTERS
    – Down approx. 50 bps in the past 12 months                                 6.6 %
                                                                                                                                                         2

                                                                                                                              2

                                                                             ASKER

Map colour indicates vacancy rates per October 2019
                                                                                               1
    0–5 %            5–10 %          10–15 %         Above 15 %

    Indicates trend past 6 months (> 1 percentage points change)

                     1                           2                      3                          4                      5                          6                      7
                                                                                                                              FORSKNINGSPARKEN /
       ASKER                     SANDVIKA                FORNEBU                LYSAKER                    SKØYEN                                          MAJORSTUEN
                                                                                                                                   ULLEVÅL

     11 %
   VACANCY RATE
                                 2%
                               VACANCY RATE
                                                        5%
                                                      VACANCY RATE
                                                                               11 %
                                                                             VACANCY RATE
                                                                                                          9%
                                                                                                        VACANCY RATE
                                                                                                                                      1%
                                                                                                                                   VACANCY RATE
                                                                                                                                                           10 %
                                                                                                                                                          VACANCY RATE
  PER OCTOBER 2019            PER OCTOBER 2019       PER OCTOBER 2019       PER OCTOBER 2019           PER OCTOBER 2019           PER OCTOBER 2019       PER OCTOBER 2019

     11 %
    SUPPLY RATE
                                 2%
                                SUPPLY RATE
                                                        5%
                                                       SUPPLY RATE
                                                                               11 %
                                                                              SUPPLY RATE
                                                                                                          9%
                                                                                                         SUPPLY RATE
                                                                                                                                      1%
                                                                                                                                    SUPPLY RATE
                                                                                                                                                           10 %
                                                                                                                                                           SUPPLY RATE
  PER OCTOBER 2019            PER OCTOBER 2019       PER OCTOBER 2019       PER OCTOBER 2019           PER OCTOBER 2019           PER OCTOBER 2019       PER OCTOBER 2019
OSLO OFFICE MARKET / MARKET REPORT WINTER 2019 / 2020 PAGE 19

                                                                                  6

      OSLO OUTER WEST                                                                                                                  OSLO OUTER EAST
                                                                                                                       12

                                                                          7                      INNER CITY

                                                                                                                                                         13
                                                  5
                                                                                            CENTRAL
                                                                                                                                           14
                                                                                               OSLO

                                                                                                      10
                       4                                                              8

                                                                                                                  11

                   3

                                                                                                                                     OSLO OUTER SOUTH

                   8                          9                      10                          11                             12                       13                      14
                                                                                                                                       ØKERN / LØREN /
      CBD                   KVADRATUREN               INNER CITY                 BJØRVIKA                  NYDALEN / SANDAKER                                  BRYN / HELSFYR
                                                                                                                                         RISLØKKA

   5%
 VACANCY RATE
                              3%
                            VACANCY RATE
                                                      3%
                                                   VACANCY RATE
                                                                                 2%
                                                                               VACANCY RATE
                                                                                                               3%
                                                                                                             VACANCY RATE
                                                                                                                                         6%
                                                                                                                                       VACANCY RATE
                                                                                                                                                                 7%
                                                                                                                                                               VACANCY RATE
PER OCTOBER 2019           PER OCTOBER 2019       PER OCTOBER 2019            PER OCTOBER 2019              PER OCTOBER 2019          PER OCTOBER 2019        PER OCTOBER 2019
                                                                                                                                                                                  Source: Malling & Co/FINN.no

   6%
  SUPPLY RATE
                              3%
                             SUPPLY RATE
                                                      5%
                                                    SUPPLY RATE
                                                                                 2%
                                                                                SUPPLY RATE
                                                                                                               3%
                                                                                                              SUPPLY RATE
                                                                                                                                        10 %                     8%
                                                                                                                                                                SUPPLY RATE
                                                                                                                                        SUPPLY RATE
PER OCTOBER 2019           PER OCTOBER 2019       PER OCTOBER 2019            PER OCTOBER 2019              PER OCTOBER 2019          PER OCTOBER 2019        PER OCTOBER 2019
PAGE 20 MARKET REPORT WINTER 2019 / 2020 / OSLO OFFICE MARKET

Further development of the rental market
Rental growth to slow down
The drivers                                                                                         › Retail conversion poses a risk: The struggling retail sector has started to
› Economic growth is likely close to the peak: Leading indicators show continued                      increase retail vacancy and we are seeing examples of landlords considering
  strong economic growth in Norway, but a slightly more negative outlook                              conversion to office, or to program new developments with more office
  in the coming year.                                                                                 and less retail. In the case of converting from retail to office, the supply
                                                                                                      side may suddenly increase within the existing stock of real estate.
› Growth in employment is strong but expected to slow down: Employment
  numbers show continued strong growth in employment in Oslo so far                                 › Public transport as key driver: Immediate proximity to public transport
  into 2019, with typical office-using sectors as growth winners. However,                            will continue to be the key driver for office rental growth, as the new city
  we expect growth to diminish, as employment rates in Oslo is reaching                               council will continue to limit car traffic in the city, cut public transport
  previous tops, in combination with an expected slowdown in overall                                  tariffs and limit parking opportunities. Increased commuting is also a
  economic growth.                                                                                    key driver for public transport.

› Vacancy is flattening: Vacancy in office clusters has stabilised in the past                      › Yields to remain low or compress even further: Further yield compression or
  six months, but supply of new projects will increase moderately over                                even lack of yield increase will again put pressure on breakeven rents for
  the coming year, including newbuilds and refurbishments in the most                                 new developments. The recent years’ increase in construction costs may
  attractive office clusters.                                                                         counteract some of the yield compression effects.

› New construction will increase and the conversion rate will slow down:
  Continued moderate net office construction over the next 12–18 months
  is expected to keep the vacancy low, but rising slightly. The higher
  vacancy will probably slowly rise as net construction increases and net
  take-up slows down. Conversion from office to other use is expected
  to slow down as the difference in value per m2 office vs. residential and
  retail has been reduced.

                                                                                                                                                                                         Source: Malling & Co Fall 2019
                                                                      TREND 1 YEAR                              TREND 1–3 YEAR

                  VACANCY CITY CENTRE

                  VACANCY FRINGE

                  RENTS CITY CENTRE
                                                                                                                                                           Low uncertainty

                                                                                                                                                           Moderate uncertainty
                  RENTS FRINGE
                                                                                                                                                           High uncertainty

 Short-term forecast (1 year): Increasing rents
 › City centre rents continues to increase by 10 % annually on a four-quarter rolling average into 2020, but is expected to fall back to a 5 % growth by Q3 2020.
 › We expect rental increase to continue to spread into the fringe office clusters causing the 4-quarter rolling average to increase to a maximum of 5 % in Q1 and Q2 before
   falling back to 2–3 % annual growth.
 › Vacancy is expected to increase slightly, but may be limited by the further overhang effects of the past growth in employment.

 Long-term forecast (1–3 years): Rents flattening
 › City centre rents will stabilise as new developments are within reach of finalising
 › Increased net construction and less favourable conditions for net negative conversion from office, along with slower economic growth, is expected to slow down rental growth.
 › We are seeing little downside risk on rents at the moment. By studying previous downturns, we could expect a rental decrease from an economic shock at a maximum of 10–15 % a year.
   This is however considered unlikely.
You can also read