The benefits of releasing spectrum for mobile broadband in Sub-Saharan Africa
←
→
Page content transcription
If your browser does not render page correctly, please read the page content below
The benefits of
releasing spectrum for
mobile broadband in
Sub-Saharan Africa

                                                 A report for
                                                 the GSMA

                                                 December 2011

Phillipa Marks
David Lewin
Sarongrat Wongsaroj
Yi Shen Chan

      Plum Consulting, 26-27 Southampton Street, Covent Garden, London, WC2E 7RS
      T: +44(20) 7047 1919, www.plumconsulting.co.uk
This report was commissioned by the GSMA and developed independently by Plum Consulting. The GSMA, their Members, Associate Members and Plum Consulting are not responsible for the use that might be made of this publication. The views expressed in this publication are the sole responsibility of the authors and do not necessarily reflect the views of the GSMA, their Members or Associate Members. © Plum, 2011
Table of Contents

Executive Summary..................................................................................................................................1

1       Introduction .....................................................................................................................................5
    1.1     The scope of the study ..............................................................................................................5
    1.2     The structure of the report.........................................................................................................5

2          How broadband Internet use might stimulate economic development in sSA ...............................7
    2.1      Introduction ...............................................................................................................................7
    2.2      Business impacts ......................................................................................................................8
    2.3      Education and research ..........................................................................................................10
    2.4      Healthcare ...............................................................................................................................13
    2.5      Government activities..............................................................................................................15
    2.6      Individuals and households .....................................................................................................15

3          The barriers to broadband Internet take-up .................................................................................16
    3.1      Current barriers .......................................................................................................................16
    3.2      Removing these barriers .........................................................................................................17

4          The need for additional spectrum for mobile broadband .............................................................19
    4.1      Fixed versus mobile broadband ..............................................................................................19
    4.2      Demand for mobile broadband ...............................................................................................19
    4.3      The need for more spectrum ...................................................................................................20
    4.4      The need for digital dividend and 2.6 GHz spectrum ..............................................................21
    4.5      Releasing the digital dividend spectrum .................................................................................22

5          The economic benefits from additional spectrum release ............................................................26
    5.1      Approach .................................................................................................................................26
    5.2      Impact of spectrum release on mobile broadband take-up.....................................................27
    5.3      Economic impacts ...................................................................................................................28
    5.4      Impacts on jobs and numbers in poverty ................................................................................29

Appendix A: Modelling approach ............................................................................................................31
 A.1    Step 1: estimate the busy hour downlink capacity required by a mobile broadband
        user .........................................................................................................................................31
 A.2    Step 2: estimate the downlink capacity of existing urban base stations .................................33
 A.3    Step 3: estimate the maximum number of urban and rural subscribers given existing
        spectrum .................................................................................................................................33
 A.4    Step 4: make projections of effective mobile broadband subscribers to 2025 with
        existing spectrum ....................................................................................................................33
 A.5    Step 5: project additional urban demand following release of additional spectrum ................34
 A.6    Step 6: project additional mobile broadband demand in rural areas ......................................34
 A.7    Step 7: calculate the impact of new spectrum release on total demand ................................35
 A.8    Step 8: estimate the impact of additional mobile broadband use on GDP growth to
        2025 ........................................................................................................................................35
 A.9    Step 9: estimate the impact of spectrum release on government tax revenues .....................36

© Plum, 2011
Appendix B: Impact of broadband on GDP ............................................................................................37 B.1 Overview .................................................................................................................................37 B.2 Macro-level studies of GDP impacts .......................................................................................37 Appendix C: Country modelling assumptions.........................................................................................40 C.1 Ghana......................................................................................................................................40 C.2 Kenya ......................................................................................................................................41 C.3 Nigeria .....................................................................................................................................42 C.4 Senegal ...................................................................................................................................44 C.5 South Africa .............................................................................................................................45 C.6 Tanzania .................................................................................................................................47 Appendix D: Estimating change in numbers of people in poverty ..........................................................49 D.1 Theory .....................................................................................................................................49 D.2 Quantification ..........................................................................................................................50 Appendix E: Ghana ................................................................................................................................51 E.1 Summary of results .................................................................................................................51 E.2 Background .............................................................................................................................51 E.3 Impact of spectrum release on MBB take-up ..........................................................................53 E.4 Economic benefits ...................................................................................................................56 Appendix F: Kenya .................................................................................................................................59 F.1 Summary of results .................................................................................................................59 F.2 Background .............................................................................................................................59 F.3 Impact of spectrum release on MBB take-up ..........................................................................61 F.4 Economic benefits ...................................................................................................................63 Appendix G: Nigeria ...............................................................................................................................65 G.1 Summary of results .................................................................................................................65 G.2 Background .............................................................................................................................65 G.3 Impact of spectrum release on MBB take-up ..........................................................................67 G.4 Economic benefits ...................................................................................................................69 Appendix H: Senegal ..............................................................................................................................72 H.1 Summary of results .................................................................................................................72 H.2 Background .............................................................................................................................72 H.3 Impact of spectrum release on MBB take-up ..........................................................................73 H.4 Economic benefits ...................................................................................................................75 Appendix I: South Africa .........................................................................................................................78 I.1 Summary of results .................................................................................................................78 I.2 Background .............................................................................................................................78 I.3 Impact of spectrum release on MBB take-up ..........................................................................79 I.4 Economic benefits ...................................................................................................................82 Appendix J: Tanzania .............................................................................................................................84 J.1 Summary of results .................................................................................................................84 © Plum, 2011
J.2      Background .............................................................................................................................84
 J.3      Impact of spectrum release on MBB take-up ..........................................................................86
 J.4      Economic benefits ...................................................................................................................88

© Plum, 2011
Executive Summary
Mobile broadband has the potential to strengthen economic growth and social development in sub
Saharan Africa (sSA). But demand will be limited by the current supply of spectrum for mobile use.
The governments of sub Saharan Africa could, by releasing digital dividend and 2.6 GHz spectrum by
2015:
Increase overall annual GDP by $82 billion by 2025 (see Figure 1) and annual government tax
revenues by $18 billion
Increase GDP per capita by 2.7 percentage points by 2020 and 5.2 percentage points by 2025 (at
constant 2010 prices)
Add up to 27 million additional jobs by 2025, compared with a total of 300 million jobs today.
Figure 1: Forecast impact of spectrum release on GDP in sub-Saharan Africa
Additional GDP (2010 constant price)
90
80 Additional GDP for early spectrum release
Additional GDP for delayed spectrum release
70
60
US$ billion
50
40
30
20
10
0
2011 2012 2013 2014 2015 2016 2017 2018 2019 2020 2021 2022 2023 2024 2025
Source: Plum Consulting
The impact of spectrum release on levels of poverty in sSA could also be substantial. We estimate
that:
There are 410 million people in sub Saharan Africa currently living at or below PPP$1.25 per day
per person
In the absence of spectrum release, forecast GDP growth should lift 86 million of these people
above this poverty line between 2015 and 2025
Spectrum release increases this number by a further 40 million.
Take-up of the broadband Internet is vital for economic and social development in sSA. Mobile voice
and SMS services have already made a major contribution over the past decade. In parallel we have
seen use of the broadband Internet boost GDP in high-income countries. Recognizing the opportunity
to realise these benefits on a global basis, the UN Broadband Commission for Digital Development
© Plum, 2011 1has set out a global broadband challenge – ―to ensure that...40% of households in developing
1
countries are using broadband Internet by 2015‖ .
In sub-Saharan Africa (sSA) broadband Internet means mobile broadband. The build out of fixed
networks, the principal vehicle for broadband Internet usage in high-income countries, is very limited
across most countries of sSA. In contrast mobile networks now reach up to 90% of Africans and offer
a much lower cost way of delivering broadband Internet. This is reflected in forecasts for fixed and
2
mobile broadband in the region (see Figure 2).
Figure 2: Forecast fixed and mobile broadband subscriptions in sub-Saharan Africa
Fixed vs mobile broadband in sub-Saharan Africa
250
200
Fixed broadband
Mobile broadband
Subscriptions (millions)
150
100
50
0
2009 2010 2011 2012 2013 2014 2015
Source: Vodafone Public Policy Series, May 2011 and AT Kearney African Mobile Observatory 2011
A lot more harmonised spectrum is required if mobile broadband in sSA is to provide sufficient
capacity to users at affordable prices. Currently mobile operators in a typical sSA country have
access to around 360 MHz of spectrum between them for mobile services (see Figure 3). In contrast,
operators in many high-income countries have access to 550 MHz of suitable spectrum. There are
plans to release up to 500 MHz more spectrum in high-income countries to support future growth in
mobile data traffic.
1
http://www.broadbandcommission.org/Documents/Broadband_Challenge.pdf, 25 October 2011
2
The mobile broadband forecasts include W-CDMA as well as HSPA and LTE connections
© Plum, 2011 2Figure 3: Amount of spectrum assigned to IMT mobile services – current and possible future
allocations
Quantity of spectrum assigned to IMT mobile services in EU, US and sub-
Sahara African countries (number of MHz)
1090
1047
Future blocks -
2015
500
500
Unassigned
610 600 613 610 610 610 spectrum
Assigned
250 250 250 250 250 250
spectrum
590 30 20
547 130 128
330 363 340 360
220 232
US EU Ghana Kenya Nigeria Senegal South Africa Tanzania
Source: Plum Consulting, regulators, operators
Governments in sSA should give priority to releasing spectrum for mobile broadband. Moreover it is
important to release spectrum which is globally harmonised for mobile broadband use. By 2015
network equipment and end-user devices which use harmonised spectrum for mobile broadband will
be in full-scale global production. This minimises the costs of supply and maximises affordability
across the population.
Of particular importance are two frequency bands that are being released for mobile broadband
elsewhere in the world – the digital dividend band at 700/800 MHz and the 2.6 GHz band. These
bands are complementary and so should be made available together. The digital dividend band is
attractive because it offers good in-building coverage in urban areas and low cost coverage in rural
areas (where 40-80% of the population live in sSA). The 2.6 GHz band offers much needed capacity
in rapidly growing urban areas.
Action is required now to release the required spectrum - which is currently used for other purposes.
In particular the digital dividend spectrum is used for analogue TV broadcasting. Most countries in
sSA have plans to move from analogue to digital broadcasting by 2015 at the latest. In addition to
allowing for the repurposing of spectrum for mobile broadband, digital switchover will enable an order
of magnitude increase in the number of terrestrial TV channels. The timely switchover from analogue
to digital TV, so as to release the digital dividend spectrum, is imperative for an affordable and speedy
take-up of broadband Internet in sSA. In some countries the 2.6 GHz band is also used by other
services and these will need to be migrated. Without release of the necessary spectrum, mobile
broadband will offer only limited capacity and coverage at high prices.
The economic and social benefits of early release of the digital dividend and the 2.6 GHz band are
substantial. Examples of these benefits include more productive farming (e.g. through online access
to key information), a stimulus to the development of local e-commerce businesses, enhancing
delivery of teaching and training materials to rural schools and reducing the cost of health care
delivery by 10-20%. Communication with distant family members will be enhanced – for example
through video communication – and it will be easier to keep in contact through online social networks.
© Plum, 2011 3Early spectrum release will enable mobile operators to upgrade their existing networks for mobile
broadband at relatively modest cost. This should mean affordable prices and strong demand, as
forecast in the figure below. This shows that additional spectrum will support over 250m additional
mobile broadband users by 2025. The stimulus to broadband take up then leads to substantial
economic and social benefits and to a corresponding increase in government tax revenues, as
described above.
Figure 4: Forecast impact of digital dividend and 2.6 GHz band on mobile broadband take-up
The impact of spectrum release on MBB take-up in sub-Saharan Africa
500
Additonal rural demand WITH additional
450 spectrum
Rural demand WITHOUT additional
400 spectrum
Additional urban demand WITH
350
MBB subscriebers (million)
additional spectrum
Urban demand WITHOUT additional
300 spectrum
250
200
150
100
50
0
2011 2012 2013 2014 2015 2016 2017 2018 2019 2020 2021 2022 2023 2024 2025
Source: Plum Consulting
© Plum, 2011 41 Introduction
1.1 The scope of the study
The GSMA asked Plum to carry out an independent study to assess the economic benefits of
releasing additional spectrum for mobile broadband in sub-Saharan Africa. This report presents our
findings.
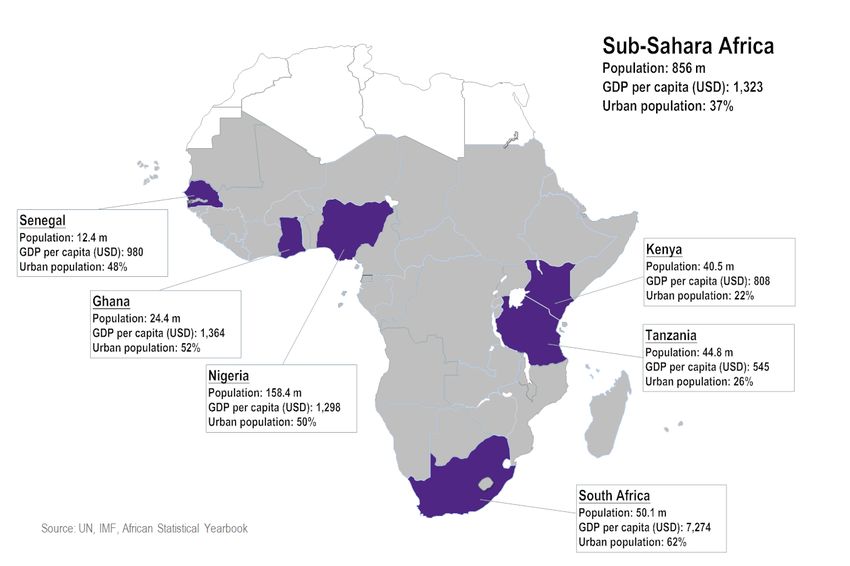
The study focuses on six case study countries - Ghana, Kenya, Nigeria, Senegal, South Africa and
Tanzania. These countries account for around 40% of the population in sub-Saharan Africa and
provide a diversity of situations in terms of incomes and level of urbanisation (see Figure 1-1).
Figure 1-1: The six study countries (2010 data)
1.2 The structure of the report
We have structured the report as follows:
Over the past 10 years use of the broadband Internet has significantly boosted GDP in high-
income countries. There is now an opportunity for a similar boost to GDP in sSA. In Section 2 we
consider, in a qualitative way, how this might happen.
Take-up of the broadband Internet in sSA is limited at the moment. But our analysis indicates that
several of the barriers to take-up should diminish significantly over the next few years. In
© Plum, 2011 5Section 3 we consider these effects and conclude that the supply of broadband access will
remain an important barrier to overcome.
The supply of broadband access will come from mobile rather than fixed networks in sSA.
Whether these networks have sufficient capacity to meet demand for broadband Internet use will
depend on how quickly additional spectrum is released for mobile broadband. Section 4 expands
on these arguments.
If harmonised spectrum is released, especially at 700/800 MHz and 2.6 GHz, then the economic
and social benefits could be substantial. Section 5 sets out our estimates of these benefits for
sSA and specifies the analysis and assumptions which underpin them.
There are then a number of appendices:
Appendices A to D specify our approach to estimating the economic impact of spectrum release
Appendices E to J provide estimates of the impact of spectrum release in each of the six
individual study countries.
© Plum, 2011 62 How broadband Internet use might stimulate economic
development in sSA
2.1 Introduction
There is now a general recognition that use of broadband Internet has the potential to stimulate
economic and social development in low-income countries. For example The UN‘s Broadband
3
Commission for Digital Development has set out a global broadband challenge which calls on world
leaders ―to ensure that at least half the developing world’s population and 40% of households in
developing countries are using broadband Internet by 2015. Consumers in all countries should have
access to affordable broadband Internet services, including in developing countries‖. The prominence
given to these objectives reflects the Commission‘s view that ―broadband infrastructure and services
contribute to economic growth and job creation‖ and should therefore be a policy priority.
In this section we describe some of the ways in which the broadband Internet can stimulate economic
and social development in sub-Saharan Africa, beyond the already considerable benefits that mobile
4
voice and SMS services have already provided in the region . We consider:
General impacts on businesses
Specific impacts on agriculture, education and research, and healthcare
Impacts on the delivery of government services
Impact at the level of individuals and households.
We conclude that:
Rising take-up of access to the broadband Internet over the next 10-15 years will have impacts
across the whole economy, as use of broadband pervades all business and government activities
and becomes an important platform for social interaction and entertainment
Examples of these benefits include more productive farming (e.g. through online access to key
information), a stimulus to the development of local e-commerce businesses, to enhanced
delivery of teaching and training materials to rural schools and to reducing the cost of health care
delivery by 10 to 20%
Communication with distant family members will be enhanced – for example through video
communication – and it will be easier to keep in contact through online social networks.
3
http://www.broadbandcommission.org/Documents/Broadband_Challenge.pdf, 25 October 2011
4
A recent study (African Mobile Observatory: driving economic and social development through mobile services, AT Kearney
for GSMA, 2011) estimates that the mobile industry in Africa contributed US$56 billion to the economy and more than 5 million
jobs.in 2010.
© Plum, 2011 72.2 Business impacts
2.2.1 General impacts
The availability of broadband Internet can enhance and expand the opportunities and capabilities for
businesses. The benefits of broadband to the business environment have been extensively discussed
5
and documented . These include:
Improved firm productivity – more efficient business processes; better supply chain
management; lower costs of accessing suppliers/wholesale markets
Greater access to and use of information – reduced search costs; improved interaction and
coordination among market agents
Extended geographic reach of markets – facilitates e-commerce; enables access to wider
customer base and new ways of delivering products and services
Lower barriers to entry – reduced financial and reputational barriers to trade online (especially
for SMEs), access to web tools and applications makes it easier for businesses to develop a web
presence
Innovation – new business models; eliminating need for intermediaries in some cases
Employment – better search and matching in labour market; job creation in IT-related sectors;
greater flexibility as result of tele-working.
2.2.2 Small and medium enterprises (SMEs) and e-commerce
The arrival of broadband Internet could potentially transform the SME sector and trigger the growth of
the nascent Internet economy in sub-Sahara Africa in a similar way to that witnessed over the past
decade in countries with high broadband penetration and Internet use. For instance:
The Internet contributed an estimated £100 billion (7.2 percent of GDP) to the UK economy in
6
2009
As shown in Figure 2-1 increasing broadband penetration in US and Korea over the past decade
has been accompanied by the rapid growth of e-commerce.
In Ghana developers have come up with applications designed to reflect local needs and boost the
7
prospects of other small businesses. ShopAfrica53 is a web-mall which advertises goods and
services by small businesses and entrepreneurs ranging from artists to hi-fi equipment distributors.
The website also handles logistics like collection and delivery of goods, and takes payment on behalf
8
of the vendors .
5
For example, see OECD Work Party on the Information Economy (2011). The economic impact of internet technologies; ITU-
UNESCO (2011). Broadband: a platform for progress. A report by the Broadband Commission for Digital Development.
6
Boston Consulting Group (2010). The Connected Kingdom: how the internet is transforming the UK economy.
7
http://www.shopafrica53.com/main/Home.aspx
8
AllAfrica.com, Tech revolution gathers pace, 16 June 2011 http://allafrica.com/stories/201106170973.html
© Plum, 2011 8Various factors have been cited for the slow development of SMEs in sub-Saharan Africa including the
lack of money, skills and knowledge, technological infrastructure (e.g. telecommunications, electricity
9
supply) and ―critical mass‖ . However a number of recent developments suggest that such obstacles
are gradually being overcome.
Figure 2-1: Broadband penetration and e-commerce growth in Korea and US
40 800
Korea broadband
35 US broadband 700
Korea e-commerce
Growth of e-commerce (2001=100)
30 600
Fixed broadband penetration
US e-commerce
25 500
20 400
15 300
10 200
5 100
0 0
2001 2002 2003 2004 2005 2006 2007 2008 2009 2010
Source: OECD
The cornerstone of e-commerce is the ability to make purchases over the Internet. While many in
10
sub-Saharan Africa do not have a bank account, the success of the M-Pesa and recent introduction
11
of online transaction services such as Kenya‘s PesaPal should help overcome the lack of financial
services and pave the way for growth of e-commerce.
For small businesses, broadband Internet can improve productivity by allowing them to process large
volumes of transactions in a more efficient and cost-effective manner, and extend traditional
geographic market boundaries so as to reach regional and even global markets. Access to broadband
Internet can also stimulate home-based entrepreneurship and offer opportunities for women to gain
financial independence by starting online businesses.
9
Ifinedo, P (2009). The Internet and SMEs in sub-Saharan African countries: an analysis in Nigeria. Encyclopaedia of
Information Science and Technology (2nd ed.)
10
M-Pesa is a mobile money service launched in Kenya in 2007 which enables cash transfer by text message. As of 2011 it has
more than 14 million customers and is now used for salaries, bills and donations. The service is also available in South Africa
and Tanzania.
11
PesaPal is a payment platform that enables users to buy and sell on the Internet using mobile money and credit cards.
© Plum, 2011 92.2.3 Agriculture
12
Agriculture accounts for 34% of the GDP of sub-Sahara Africa and employs 64% of the labour force .
The majority of the rural population in these countries depend on subsistence farming and face
significant challenges. First, crop yields are highly variable. This can severely strain farmers‘ ability to
feed themselves and their families. Secondly, physical isolation and poor transport infrastructure
make it difficult to access services and markets. This is often compounded by the lack of access to
communication resources and information about markets and prices of crops.
13
The adoption of broadband Internet can help meet these challenges and improve quality of rural life .
Table 2-1 summarises the potential benefits to the agriculture industry in sub-Sahara Africa.
Table 2-1: Potential benefits of broadband Internet in agriculture
Key applications Potential benefits of broadband Internet
Education and awareness Access to information on good cultivation practices, improved crop varieties,
pest and disease management.
Commodity prices and Access to market prices and preferences, which affects planting decisions, not
market information just post-harvest sales
Data collection Applications using mobile devices to collect and/or access agriculture data
Pest and disease outbreak Send and receive data on disease incidence and outbreaks
warning and tracking
Weather information Access to real-time weather data and forecasts (e.g. satellite imagery), facilitate
better planning and use of scarce resources (e.g. water)
Collaboration Better information sharing and collective action among producers through
cooperatives, producer organisations
Complementary services Access to financial services
2.3 Education and research
Education is another area in which broadband Internet can bring major socio-economic benefits. This
is particularly pertinent in sub-Sahara Africa where many countries have low adult literacy rates and
schooling resources are often inadequate in rural areas (see Figure 2-2).
12
World Bank. 2008. World Development Report 2008: Agriculture for Development. Washington, DC: World Bank.
13
Hellstrom, J. 2010. The innovative use of mobile applications in East Africa. Sida Review, 2010:12
© Plum, 2011 10Figure 2-2: Comparison of education statistics
110
100 US
EU27*
Kenya
90 South Africa
BRIC*
Adult literacy rate %
80
Tanzania
70
Ghana
60 Nigeria
50 Senegal Size of circle represents
pupil-teacher ratio:
40 EU27 - 13.3
Tanzania - 53.7
30
2.0 4.0 6.0 8.0 10.0 12.0 14.0
Mean years of schooling
Note: * unweighted
Source: Plum analysis of data in UN Human Development Report 2011
There are two main educational benefits which broadband access can help deliver. First, the Internet
can improve education by enhancing remote communication and the delivery of teaching or training
14
materials . This could help ease perennial problems of the lack of teachers, facilities and resources
and enable students in rural areas to access online learning materials via mobile phones or laptops
outside the classroom.
Second, broadband Internet can improve the quality of education by expanding the range of
synchronous and asynchronous learning opportunities through online services and applications.
These include email, discussion boards, live webcasts, podcasts, wikis, blogs, customisable course
management platforms such as Blackboard, WebCT, Moodle and Sakai.
Around the world many universities have made their classes available online to the public for free.
Having Internet access means tertiary education should become more accessible and affordable and
help sub-Sahara African countries close the gap with the rest of the world in the provision of tertiary
education. This gap is shown graphically in Figure 2-3.
14
OECD (2011).The economic impact of Internet technologies.
© Plum, 2011 11Figure 2-3: Enrolment and literacy rate
120 120
100 100
Gross enrollment ratio %
Primary
Adult literacy rate %
80 80
Secondary
60 60
Tertiary
40 40
Adult literacy rate
20 20
0 0
Source: Plum analysis of data in UN Human Development Report 2011
Apart from general education the Internet can also enhance academic and scientific research. For
example the Internet can improve communication, and exchange of expertise, between researchers
and research centres, as well as facilitate ―virtual laboratories‖ and large-scale collaborative projects
involving specialist researchers and ordinary citizens (e.g. NASA‘s SETI@home project).
Table 2-2: Potential benefits of the broadband Internet for education and research
Key applications Potential benefits of broadband Internet
Telepresence and e- Creates a virtual experience over a converged network, delivering real time
education face-to-face interactions, using advanced visual, audio, and collaboration
technologies
Interactivity and Brings lessons beyond school-based structures enabling teachers to provide
personalisation individual coaching based on specific needs of individual students
E-learning and open source Use of open source e-learning platforms reduces costs of providing education
platforms and training
Crowdsourcing and Online reference databases which pool user-generated information to create
information resources collective knowledge resources e.g. Wikipedia, online dictionary,
encyclopaedia, translation services
Academic research and e- Digitisation and storage of research materials (e.g. JStore, ScienceDirect,
science Google scholar) ; citizen participation and collaboration in science projects
© Plum, 2011 122.4 Healthcare
Healthcare like education is a long-standing problem in sub-Sahara Africa. People in the region have
a life expectancy at birth of just 54.4 years and there is a child mortality rate of 129 per 1,000 live
births according to the 2011 UN Human Development Report 2011. The global average for life
expectancy is 69.8 years and for child mortality is 58 per 1,000 live births. There is also a severe
shortage of healthcare providers, especially physicians, in sSA as illustrated in Figure 2-4.
Figure 2-4: Healthcare providers in sub-Sahara
45
Physicians per 10,000 population
40
35 Nursing and midwifery personnel
per 10,000 population
30
25
20
15
10
5
0
Ghana Kenya Nigeria Senegal South Africa Tanzania Global
Source: World Health Organisation
While broadband alone cannot substitute for doctors, nurses and health care workers, the benefits of
Internet applications in healthcare are potentially large. Appropriate mobile solutions can improve the
quality of life for patients, increase efficiency of healthcare delivery models, and reduce costs for
healthcare providers.
It has been estimated that the use of telemedicine delivered by broadband could achieve cost savings
15
of between 10% and 20% . This would be particularly important for sub-Saharan Africa where a
combination of high population growth and short life expectancies, will see a projected 52 percent
16
increase in health spending from 2005 to 2025.
15
Boston Consulting Group (2011) cited in ITU-UNESCO (2011) Broadband: a platform for progress
16
World Bank (2006). Health Financing revisited: a practitioner‘s guide
© Plum, 2011 13Figure 2-5: Medical uses of broadband
Real time Medium resolution and motion video High definition video, up to 70 Mb/s
Basic cardiology, neurology, Interactive 3D
emergency room consultations High resolution and motion video Tele-presence, brain imaging
emergency room
consultations
Home tele-visits and Gait analysis
tele-monitoring
Low resolution and motion video Cineo-angiography,
echocardiograms
Stethoscope, visual exams
0.01 0.05 0.10 0.40 0.80 2 16 70 70+
Mb/s
Increasing bandwidth requirements
Online health records
Identification
of counterfeit
medications Public health information Professional
tele-education Advanced clinical
decisions support systems
SMS/2G Web browsing
Non-real time
Source: ITU-UNESCO
In Africa mobile health initiatives involving the use of SMS have been used to help increase
awareness of diseases such as HIV/AIDS and to encourage testing, and the use of systems for
17
verifying the authenticity of pharmaceuticals to combat the fake-drug business . The arrival of
broadband could further bolster the development of e-health services and expand their scope into
areas such as visual tele-monitoring and emergency room consultations, as shown in Figure 2-5. A
summary of the benefits is given in Table 2-3.
Table 2-3: Potential benefits of the broadband Internet for healthcare
Key applications Potential benefits of broadband
Education and awareness Websites and social networking to support public health and behavioural
change campaigns. Also helps in information sharing among health workers.
Data collection and health Mobile applications to collect and/or access real-time patient data and records
record access
Monitoring/medication Maintain care giver appointments or ensure medication regime adherence via
compliance one-way or two-way communications
Disease/epidemic outbreak Send and receive data on disease incidence, provide warnings during
tracking outbreaks and public health emergencies
Health/administrative Accessible cloud-based drug inventory management, up-to-minute stock
systems checking, verification of drugs to help combat counterfeit drugs
Analysis, diagnosis and Phone as point-of-care device. Mobile phone-based diagnosis, or microscope
consultation pictures sent to distant reference centres for tele-diagnosis
17
E.g. HP‘s mPedigree mobile service in Ghana and Nigeria.
© Plum, 2011 142.5 Government activities
Just as for businesses, governments in sSA can use the broadband Internet in a number of beneficial
ways to:
Raise the productivity and efficiency of government departments. For example government
departments might reduce basic paper filing, which incurs significant costs in terms of staff,
transportation and resources, especially in rural areas.
Widen the availability and improve the quality of government services. The development of e-
government services, such as online systems for tax filing and public procurement, can give both
citizens and businesses convenient, round-the-clock access to required government services
using a broadband connection. Such e-government processes can help reduce processing times
and improve national competitiveness.
Strengthen governance processes. The Internet provides new channels and possibilities to
promote governance by facilitating citizen to citizen, citizen to government and government to
citizen interactions. Increased interaction with the government and easy access to documentation
can also raise transparency and promote democratisation.
Potential e-government applications include government news/information updates; law
enforcement/safety; elections; disaster and crisis management; data collection and monitoring and
18
employment services .
2.6 Individuals and households
For individuals and households broadband Internet can improve consumer welfare and help deliver
development outcomes in a variety of ways. These impacts are summarised in Table 2-4 below. They
should translate into a significant improvement in individual and household well-being.
Table 2-4: Benefits to individuals and households
Development impacts Potential benefits of broadband Internet
Social Enable easy and speedy communication with family members, friends, business
associates, employees and employers
Social networking and formation of communities of interest
Economic New distribution channels for existing products and services (e.g. e-commerce,
digital music, video or software)
More efficient search mechanisms for locating information and better availability of
assessment of consumer goods which could lead to lower prices
New ways of addressing consumers‘ needs on line, often at very minimal cost (e.g.
e-mail, mobile marketing)
Expanded sources of income, means of employment (e.g. tele-working)
Improved productivity through reduction of travel time and cost
Knowledge Better education, learning opportunities
Greater knowledge access, accumulation and dissemination
18
Hellstrom (2010)
© Plum, 2011 153 The barriers to broadband Internet take-up
3.1 Current barriers
Current take-up of the broadband Internet in Africa, and particularly in sSA is low, as Figure 3-1
illustrates.
Figure 3-1: Broadband penetration by region (2010 estimate)
50%
45% Mobile broadband
40%
Fixed broadband
35%
30%
25%
20%
15%
10%
5%
0%
Europe CIS Americas Arab states Asia Pacific Africa
Source: ITU World Telecommunication/ICT Indicators database
At the moment most Internet users in sSA access the Internet using narrowband access via Internet
cafes. Figure 3-2 illustrates.
Figure 3-2: Points of access for those who use the Internet
100%
90%
80%
70% Cyber/ Internet café
60% Home or another person's home
50% Educational institution/library
40% Mobile phone
At work
30%
20%
10%
0%
Ghana Kenya Nigeria* Senegal South Tanzania
Africa
Source: Research ICT Africa
© Plum, 2011 16At the same time surveys suggest that there are three main reasons, as set out in Table 3-1, why the
vast majority of the population do not use Internet:
They do not have access to a computer
They do not know how to use a computer
They do not have access to the Internet.
19
Table 3-1: Reasons for not using the Internet (among non-users)
Country I do not I do not I do not I have I do not I cannot
have know how want to no one have afford to
access to a to use use the to send access to use the
computer computers Internet email any Internet
to Internet
facilities
Ghana 49.9% 70.8% 6.3% 25.0% 25.9% 7.8%
Kenya 35.0% 40.9% 24.7% 27.9% 37.8% 2.2%
Nigeria* 47.0% 48.4% 3.1% 15.5% 30.2% 1.6%
Senegal 30.3% 54.1% 7.0% 11.7% 18.2% 7.6%
South Africa 53.1% 25.4% 8.0% 10.0% 38.1% 12.9%
Tanzania 64.6% 71.5% 5.6% 18.9% 19.3% 15.4%
Surveys in high-income countries also suggest that there are five main barriers to use of the
broadband Internet:
Lack of availability of broadband services
The relatively high price of broadband services and devices.
An inability to pay for e-transactions.
Low levels of literacy and also digital literacy
Perceptions of the irrelevance of Internet-based services and applications
3.2 Removing these barriers
There is a good chance that market developments will lead to a substantial reduction in some of these
barriers, especially if the broadband Internet is delivered using mobile rather than fixed broadband;
Mobile broadband devices, such as smartphones and tablets, offer an easier way of using the
broadband Internet than traditional PCs. Figure 3-3 illustrates. This means that, while full digital
literacy is still required for an effective workforce to use PCs, the level of literacy required for basic
use of the broadband Internet is much reduced
19
Schmidt, JP and Stork, C (2008). E-Skills. RIA Policy Paper, Vol.1 Paper 3.
© Plum, 2011 17 Mobile broadband devices facilitate shared use of Internet services and applications in a way
which fixed broadband PCs do not. Such sharing is effective in spreading an appreciation of the
value of using the Internet. It is, in effect, a form of viral marketing, which should stimulate
broadband Internet take-up
Mobile operators in low-income countries have successfully developed payment services which
can be adapted to enable e-transactions, and so enhance the value of broadband Internet use.
If analysts forecasts are right, mobile broadband devices will be more available and more
affordable in sSA than laptops and desktops using fixed broadband
This still leaves the availability of broadband services as a barrier. We consider this problem in the
next section.
Figure 3-3: Market developments are lowering requirements for basic digital literacy
PCs - Important for ICT at work Smart phones and tablets - more
but: limited functionality but:
• Complex • Simple (complexity concealed)
• Keyboard and browser-based • Touch screen and Apps based
• Vulnerable • More secure
• Fixed broadband can be • (Mobile) communications included
challenging to set up
© Plum, 2011 184 The need for additional spectrum for mobile
broadband
4.1 Fixed versus mobile broadband
The future availability of the broadband Internet in sSA will depend on access to mobile rather than
fixed broadband networks.
Use of fixed broadband in sSA is likely to be rare. Existing investment in the fixed network is low and
the reach of the fixed network is limited. This severely constrained the opportunity to upgrade fixed
networks for broadband in a cost-effective way. In contrast mobile networks already reached 90% of
the population in many sSA countries and it is relatively simple matter to upgrade them for broadband
use. This difference is reflected in the forecasts for fixed and mobile broadband take-up in sSA. Figure
4-1 illustrates.
Figure 4-1: Forecast fixed and mobile broadband subscriptions in sub-Saharan Africa 2009-
2015
Fixed vs mobile broadband in sub-Saharan Africa
250
200
Fixed broadband
Mobile broadband
Subscriptions (millions)
150
100
50
0
2009 2010 2011 2012 2013 2014 2015
Source: Vodafone Public Policy Series, May 2011 and AT Kearney African Mobile Observatory 2011
4.2 Demand for mobile broadband
Demand for mobile broadband is forecast to grow very strongly in sSA over the next decade as
highlighted in Figure 4-1. There is a danger that the mobile networks will not have sufficient capacity to
meet demand and that the economic development from use of the broadband Internet, described in
qualitative terms in Section 2, will not be realised.
The extent to which this happens will depend on the speed with which the governments of sub-
Saharan African countries release additional harmonised spectrum for mobile broadband services.
Release of such spectrum should:
© Plum, 2011 19 Enable higher-speed broadband for end-users
Lower the unit costs of providing mobile broadband
Enable operators to offer better in-building coverage in urban areas
Enable operators to upgrade their existing radio access networks in rural areas in a cost-effective
way, so as to deliver broadband there and enable rural economic development.
The capacity available to provide mobile broadband services depends on the amount of spectrum
assigned to the operator and the number of base stations in its network. Once the existing spectrum
capacity is fully used operators must, in the absence of suitable additional spectrum, start to add more
base stations to the network to deal with congestion caused by growth in data services. This is
expensive – typically costing five or six times more than adding additional spectrum to existing base
20
stations . Providing additional spectrum is the obvious way to keep costs and prices down.
4.3 The need for more spectrum
4.3.1 The current allocations will become congested
Mobile operators in the six case study countries can use spectrum in a range of bands to supply voice,
SMS and data services. As a general rule the frequency bands at 900 MHz, 1800 MHz and 2100 MHz
21
have been assigned to operators in sSA . Most of the available frequencies have now been
assigned. These provide capacity for continued growth in voice and SMS services.
22,
Most data use in sub-Saharan Africa is currently on Edge networks but mobile broadband services
using EVDO, WCDMA and HSPA technologies have also been launched in the 850 MHz, 900 MHz
and 2100 MHz bands. However, we expect that this capacity will become fully used in urban areas
23
over the next five years as the number of users with significant broadband requirements grows . This
growth is a natural consequence of economic growth, increasing urbanisation and declining costs of
broadband devices and services.
4.3.2 Government recognition of the need for more spectrum
Governments in high-income countries recognise the need for more spectrum to meet mobile
broadband demand at affordable prices. In the EU and US they have already made available around
550 MHz of spectrum to mobile operators, compared with 360 MHz in sSA. They plan to nearly double
this allocation over the next few years. Figure 4-2 illustrates the differences between the EU and US
and sSA in terms of spectrum allocation for mobile use.
20
See http://www.plumconsulting.co.uk/pdfs/Plum_June2011_Benefits_of_1.4GHz_spectrum_for_multimedia_services.pdf
21
Although in some countries (e.g. Nigeria) there is also some use of North American bands at 850 MHz and 1900 MHz
22
Coyle and Williams overview in Making Broadband Accessible to All, The Policy Paper Series, May 2011, Vodafone,
http://www.vodafone.com/content/dam/vodafone/about/public_policy/policy_papers/public_policy_series_12.pdf
23
This is confirmed by the modelling described in Section 5
© Plum, 2011 20Figure 4-2: Current mobile spectrum and possible future allocations
Assigned spectrum Unassigned spectrum Future blocks - 2015
1090
1047
500
500
610 600 613 610 610 610
250 250 250 250 250 250
30 20
547 590 130 128
330 363 340 360
220 232
US EU Ghana Kenya Nigeria Senegal South Tanzania
Africa
Source: Plum Consulting, regulators, operators
In practice demand for additional spectrum in sSA is likely to be even greater than in high-income
countries, where mobile broadband supplements fixed broadband and most broadband traffic uses the
fixed network. In sSA there is little opportunity to use fixed broadband and virtually all the traffic will
use the mobile networks.
4.4 The need for digital dividend and 2.6 GHz spectrum
It is important that any additional spectrum released in sSA is at globally harmonised frequencies, for
which network equipment and end-user devices are manufactured on a global scale. Only in this way
24
are the unit costs and prices for mobile broadband minimised.
Two of the main bands which meet this requirement are:
The digital dividend spectrum at 700 or 800 MHz, which offers 60 MHz or more of additional
spectrum
The 2.6 GHz band, which offers 190 MHz of additional spectrum.
The digital dividend and the 2.6 GHz bands are both internationally harmonised and will support
mobile broadband services using LTE technology. The digital dividend spectrum is at relatively low
frequencies, below 1 GHz, and so is particularly good for providing low cost coverage in rural areas
and indoor coverage in urban areas. The 2.6 GHz band offers much more spectrum than the digital
dividend spectrum and so is well suited to providing capacity in densely populated urban areas where
lack of capacity is a key issue. The complementary characteristics of the two bands mean that many
governments have released them together or in a similar timeframe.
24
http://www.gsmworld.com/documents/Impact_of_spectrum_harmonisation_on_DD_handset_costs.pdf
© Plum, 2011 214.5 Releasing the digital dividend spectrum
4.5.1 The digital dividend options
There are two possible scenarios for release of the digital dividend spectrum in sSA as illustrated in
Figure 4-3:
To adopt the CEPT band plan (790-862 MHz) for Europe which would release 2x30 MHz
To adopt the APT band plan (698-806 MHz) which would release 2x45 MHz.
Figure 4-3: Digital dividend band plans
Region 1 (Europe/Africa)
30MHz 11 MHz 30MHz
Region 3 (Asia/Pacific) 790 MHz 862 MHz
5 45 MHz 10 MHz 45 MHz 3
698 MHz 806 MHz
12 MHz overlap
(791-803 MHz)
Source: GSMA
As part of ITU Region 1, the obvious option for sSA countries is to adopt the CEPT plan.
Harmonisation with Europe would create economies of scale and benefit consumers through lower
costs, interoperability and facilitate cross-border coordination. However, the APT plan for ITU
Region 3 would allow more spectrum to be released and would allow the continued operation of
mobile services at 850 MHz.
25
So far of the six study countries, Ghana and South Africa have indicated a preference for the CEPT
26
plan. So too has the Southern African Development Community . For simplicity in our analysis we
assume that the CEPT plan is adopted.
4.5.2 Releasing the digital dividend spectrum
Whichever digital dividend option is adopted, existing users of the band will need to be migrated to
27
other frequencies. In the study countries digital dividend spectrum is used mainly for analogue TV
25
National Communications Authority (2011). Selection and award procedure for digital terrestrial pay television network
licenses: invitation for comment. http://www.nca.org.gh/downloads/dtt/Public_Consultation_on_DTT_Licences_Oct_2011.pdf
Republic of South Africa Government Gazette (2009). South Africa Final Terrestrial Broadcasting Frequency Plan 2008
http://www.icasa.org.za/Portals/0/Regulations/Regulations/Broadcasting%20Spectrum%20Planning/Final%20Terrestrial%20Bro
adcast%20Frequency%20Plan%2032728.pdf
26
South Africa and Tanzania are SADC members. SADC Roadmap for Digital Broadcasting Migration, November 2010
www.crasa.org/download.php?doc=doc_pub_eng66.pdf
27
Mobile broadcasting services (DVB-H) have also been deployed in the band27 (e.g. in the main metropolitan areas in Ghana,
Kenya, Nigeria and South Africa)27 and several countries (e.g. Kenya, Nigeria, South Africa) have allocated some of the
frequencies mobile services, specifically in the frequency range 824-849/869-894MHz.
© Plum, 2011 22broadcasting. However, all countries have plans to introduce digital terrestrial TV (digital terrestrial
TV) and to shut down analogue TV services so as to release the ―digital dividend‖. These plans are
set out in Table 4-1. So far none of the countries has achieved nationwide deployment of digital
terrestrial TV but many of the national plans envisage a two to three year switchover process from
analogue to digital transmission.
Table 4-1: Broadcast TV landscape and digital migration targets for the 6 study countries
South
Country Ghana Kenya Nigeria Senegal Tanzania
Africa
Total households
5,432 8,605 31,636 1,446 12,422 8,537
(thousands), 2009
TV households,
47% 41% 41% 48% 72% 10%
2009
TV weekly reach 68% 58% 80% Not known 90% 41%
Analogue terrestrial (1) (3) (5)
2 1 1 6 4
channels (national) At least
(4)
Analogue terrestrial 3
(1) (2) (3) (6)
18 18 est. 150 2 21
channels (regional)
Proposed analogue
Dec-14 2012 Jun-12 Not known Dec-13 Dec-13
TV switch off date
Notes: (1) Assumption of 1 channel per company licensed, includes another 10 licensed services which are not yet on air;
excludes 2 analogue terrestrial pay TV licences (DSTV, Crystal TV) which have expired. (2) Based on station ID, KBC
regional stations not included. (3) One national network, NTA, which has about 100 stations; 37 state-owned stations; 14
private stations. (4) Public broadcaster RTS has 2 nationwide TV channels (RTS1 and RTS2); private channel 2sTV. (5)
Includes pay terrestrial channel M-Net. (6) Regional channels SABC 4 and SABC 5 planned but not yet launched.
Sources: ITU, AudienceScapes, Nielsen, mediareach OMD, Open Society Foundations
4.5.3 Digital switchover – more TV plus spectrum for mobile broadband
Digital switchover offers a potential win-win outcome – more capacity for additional TV channels plus
more spectrum for mobile broadband.
The greater spectrum efficiency of digital terrestrial TV means television pictures can be transmitted in
a fraction of the bandwidth required by an equivalent analogue TV signal. The capacity depends on
the technology used. But, with majority of the six study countries proposing to adopt the latest DVB-
T2 and MPEG4 standards, there is likely to be plenty of capacity for broadcasting services post-
switchover. While one 8 MHz frequency channel can carry only one analogue TV service, the same
spectrum bandwidth can accommodate a multiplex of digital services with up to 22 standard definition
digital TV services plus digital radio and text-based services using the latest transmission and
compression standards (see Table 4-2).
© Plum, 2011 23You can also read