MASTERARBEIT / MASTER'S THESIS - Climod.eu
←
→
Page content transcription
If your browser does not render page correctly, please read the page content below
MASTERARBEIT / MASTER’S THESIS

                     Titel der Masterarbeit / Title of the Master’s Thesis

Ensembles of flooding occurrences driven by
different pathways of mankind until 2100 and
     decision theory for forward-planning
            sustainable protection

                                 verfasst von / submitted by

                              Fabian Georg Frank, BSc

 angestrebter akademischer Grad / in partial fullfilment of the requirements for the degree of

                              Master of Science (MSc)

Wien, 2018 / Vienna, 2018

Studienkennzahl lt. Studienblatt/
degree programme code as it appears on
the student record sheet:                      A 066 614
Studienrichtung lt. Studienblatt/
degree programme as it appears on
the student record sheet:                      Masterstudium Meteorologie
Betreut von / Supervisor:                      Priv.-Doz. Mag. Dr. Christoph Matulla
                                               (ZAMG, Universität Wien)
Mitbereut von / Co-Supervisor:                 Min.Rat Dipl.Ing. Franz Schmid (BMNT)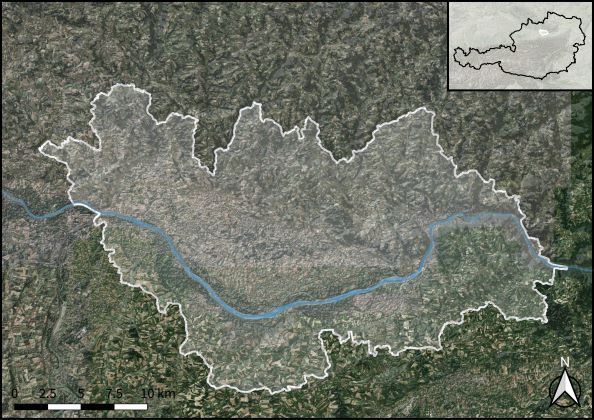
i

„Climate change increasingly poses one of the biggest long-term threats to
                             investments.“
              Christiana Figueres on Climate Change; secretary of the UNFCCC
ii                                          Abstract

Abstract

All over the world, an increasing number of weather-induced damage events can be ob-
served. They are due to enhanced frequencies and intensities of previously scarce weather
patterns. This development raises consciousness among federal officials and industry exec-
utives responsible for public protection as it increases the risk of casualties and losses to so-
ciety, ecosystems, socio-economics, infrastructure and therefore poses the question of how
the actual level of protection can be sustained in the decades to come.
This study investigates the use of decision theory techniques to support decision-making
processes actually used by the authorities responsible for civil protection. In order to ac-
complish these tasks, we apply the Bernoulli Principle in conjunction with a set of rules to a
very comprehensive and complex case study in which the standard decision-making proce-
dures of the authorities have not yielded a clear result.
By employing protection-strategies used by the authorities (retention strategies, linear as
well as retention measures) under coherently compiled assumptions concerning their po-
tential future evolution, we employ decision theory methods to address the challenge of how
to sustain present-day protection-levels under enhanced flooding-occurrences derived from
ensembles of downscaled climate-change projections associated with different future path-
ways of mankind.
Achieved results highlight the significance of this approach in forward-planning sustainable
public protection-strategies and safeguarding critical infrastructure. This is of far-reaching
importance because presented approaches allow for the consistent integration of decisive
future threat-levels. Anticipatory planning is in fact urgently needed in this context because
by now the maintenance of structures in place already makes up a substantial part of the
total budget available for public measures.
The achived findings of this study have already caused discussions by authorities in charge
of civil protection on so far utilized decision-making processes. In addition, the intense co-
operation with European transport, freight and logistics leaders has allowed us to estimate
the implementation of presented strategies with regard to their future cost development.
Apart from that results correspond to the recommendations of the Federal Ministry for Sus-
tainability and Tourism (BMNT) regarding the Flood Directive and the publications of the
European Union on flood protection.

iii

Zusammenfassung

Weltweit gesehen lässt sich eine immer größer werdende Anzahl an wetterinduzierten Scha-
dereignissen beobachten. Diese basieren auf der mit der Klimaänderung einhergehenden
Erhöhung der Frequenz und Intensität bisher seltener Extremwetterereignisse. Durch diese
Entwicklung hat sich das Bewusstsein der für den öffentlichen Schutz verantwortlichen poli-
tischen und ökonomischen Entscheidungsträger erhöht. Die Frage die sich hierbei stellt ist,
wie es gelingen kann, das gegenwärtig hohe Schutzniveau in den kommenden Jahrzehnten
aufrechtzuerhalten.
Die vorliegende Arbeit entstammt einer Kooperation mit Verantwortungsträgern im öster-
reichischen Bevölkerungsschutz und beschreibt die Etablierung eines, auf Entscheidungs-
theorie beruhenden, Verfahrens zur vorrausschauenden Planung nachhaltiger Strategien mit
dem Ziel der Schadensvermeidung. Die hier gezeigte Anwendung im Zivilschutz soll die Ver-
antwortlichen bei der Wahl jener Maßnahmen unterstützen, die optimal die Erhaltung des
gegenwärtigen Schutzniveaus in den kommenden Jahrzehnten gewährleistet.
Dieses Verfahren basiert auf (i) dem, auch aus dem Portfoliomanagement bekannten, Ber-
noulli Prinzip, welches die Behandlung des Nutzens von Handlungsoptionen anstatt nur de-
ren monetäre Aspekte gestattet, sowie (ii) einem Set an Entscheidungsregeln. Dieser, jeden-
falls im vorliegenden Kontext, neue Ansatz wird durch Anwendung auf eines der ressour-
cenintensivsten und umfangreichsten Bevölkerungsschutzprojekte in Österreich (für das die
herkömmlichen Verfahren keine Unterstützung im Entscheidungsprozess boten) evaluiert.
Dabei geht es um Hochwasserschutz, zu dessen nachhaltiger Gewährleistung drei Maßnah-
men (Lineare Verbauung, Retention, Absiedelung) zur Verfügung stehen.
Da bereits jetzt ein Großteil der Mittel im Bevölkerungsschutz für die Erhaltung bestehen-
der Infrastruktur aufgewendet wird, ist der vorausschauenden Planung nachhaltiger Kon-
zepte besonders hoher Stellenwert beizumessen. Eine notwendige Voraussetzung für eine
derartige Planung ist die Ableitung künftiger Gefahrenpotentiale in der Projektregion. Daher
werden die Entwicklungen des künftigen Hochwasserrisikos für drei Ensembles downges-
calter Klimaprojektionen, die verschiedenen Entwicklungspfaden der Menschheit (van Vu-
uren et al., 2011) entsprechen, physikalisch konsistent berechnet. Diese Analysen beruhen
auf Wetterprozessen, die Hochwasserereignisse auslösen (Enigl et al., 2018).
Resultierende Risiko-Entwicklungs-Korridore bis zum Ende des Jahrhunderts sowie zu er-
wartende Aufwendungen für die Schutzmaßnahmen werden von dem hier gezeigten Ver-
fahren verarbeitet. Die erzielten Ergebnisse zeigen ein klares Ranking der Maßnahmen hin-
sichtlich ihrer Eignung, das aktuelle Schutzniveau auch in den kommenden Dekaden zu ge-
währleisten. Gegenwärtig werden am, für den Bevölkerungsschutz verantwortlichen, Minis-
terium die für die Integration des Verfahrens notwendigen Anpassungen erhoben. Mit dem
Forum der ‚European Freight and Logistics Leaders‘ wird, angesichts der in den letzten Jah-
ren wiederholten Ausfällen intermodaler Verbindungen, die Anwendung des Verfahrens auf
Europäische Transportkorridore diskutiert.
iv                                              List of Tables

Contents
     Abstract . . . . . . . . . . . . . . . . . . . . . . . . . . . . . . . . . . . . . . . . . . . . . .                                        ii
     Zusammenfassung . . . . . . . . . . . . . . . . . . . . . . . . . . . . . . . . . . . . . . .                                              iii

1. Introduction                                                                                                                                  1

2. Data and Methods                                                                                                                              4
   2.1. Representative Concentration Pathways - RCPs                .   .   .   .   .   .   .   .   .   .   .   .   .   .   .   .   .   .   .    4
   2.2. ÖKS15 . . . . . . . . . . . . . . . . . . . . . . . . .     .   .   .   .   .   .   .   .   .   .   .   .   .   .   .   .   .   .   .    5
   2.3. Project based data . . . . . . . . . . . . . . . . .        .   .   .   .   .   .   .   .   .   .   .   .   .   .   .   .   .   .   .    5
        2.3.1. Cost-benefit analysis - KNU . . . . . . . .          .   .   .   .   .   .   .   .   .   .   .   .   .   .   .   .   .   .   .    5
        2.3.2. BMNT fact sheet catalog . . . . . . . . . .          .   .   .   .   .   .   .   .   .   .   .   .   .   .   .   .   .   .   .    6
        2.3.3. State audit office collection . . . . . . . .        .   .   .   .   .   .   .   .   .   .   .   .   .   .   .   .   .   .   .    6
   2.4. Methods . . . . . . . . . . . . . . . . . . . . . . .       .   .   .   .   .   .   .   .   .   .   .   .   .   .   .   .   .   .   .    7
        2.4.1. Bernoulli Principle . . . . . . . . . . . . .        .   .   .   .   .   .   .   .   .   .   .   .   .   .   .   .   .   .   .    7
        2.4.2. Decision rules . . . . . . . . . . . . . . . .       .   .   .   .   .   .   .   .   .   .   .   .   .   .   .   .   .   .   .    9

3. Results                                                                                                                                      12
   3.1. History of the public protection project ‘Machland’
        (case study) . . . . . . . . . . . . . . . . . . . . . . . . . .                . . . . . . . . . . . . . .                             12
   3.2. Potential future risk development corridors . . . . . . .                       . . . . . . . . . . . . . .                             13
   3.3. Estimation of path-probabilities in the near and
        far future . . . . . . . . . . . . . . . . . . . . . . . . . . . .              . . . . . . . . . . . . . .                             14
   3.4. Estimation of required investment sustaining current
        protection . . . . . . . . . . . . . . . . . . . . . . . . . . .                . . . . . . . . . . . . . .                             14
   3.5. Anticipatory planning sustainable protection strategies                         . . . . . . . . . . . . . .                             16

4. Results and discussion                                                                                                                       18

5. Outlook                                                                                                                                      21

Bibliography                                                                                                                                    23

6. Acknowledgment                                                                                                                               26

7. Appendix A: Cooperation University of Vienna - ZAMG, KLFOR/CIT - BMNT                                                                        29

8. Appendix B: Participation in conferences and
   presentations                                                                                                                                42

List of Tables

     1.   ÖKS15 data set for daily precipitation in Austria. In all there are 5 GCMs (rows)
          combined with 7 RCMs (columns). Subsequently, the signal is downscaled on
          a grid of 1 km using statistical methods. . . . . . . . . . . . . . . . . . . . . . . . .                                              5
List of Figures v
2. Typical ‘result matrix’ appearing in decision theory: columns contain ‘envi-
ronmental conditions’ E j , rows ‘alternatives’ A i amongst which the most suit-
able is to be identified. In case there are values for probabilities p j on hand,
these indicate likelihoods with which corresponding E j are to be expected. u k
stands for utility-functions associated with three function-families (k= 1, 2, 3)
of Bernoulli’s Principle (as outlined in the text). e i j finally signify investments,
amounts of resources (e.f. money). . . . . . . . . . . . . . . . . . . . . . . . . . . . 8
3. DΘ’s ‘result matrix’ depicting in its columns six ‘environmental conditions’,
which in anticipatory decision-making refer to the three pathways of mankind
in two distinct future periods (2035–2065 and 2071–2100). The second line
shows the future state’s probabilities. Rows contain DΘ’s ‘alternatives’ reflect-
ing three authoritie’s protection-strategies A, L and R, respectively. ‘u k ’ indicate
different risk-attitudes (’utility-functions’ in DΘ) dominating final findings. . . 16
4. Evaluation of protection-strategies based the ‘Machland’ project, on climate-
change induced flooding development-corridors until 2100, and DΘ techniques.
The table’s upper half refers to (2035–2065) while findings in the bottom half
are based on (2035–2065) and (2071–2100). Rankings to be used in forward-
planning sustainable protection-strategies are shown in the rightmost column.
Unlike other decision rules those in brackets refer to a decisively more opti-
mistic view. Rankings based on them too are presented in brackets (rightmost
column). . . . . . . . . . . . . . . . . . . . . . . . . . . . . . . . . . . . . . . . . . . 18
List of Figures
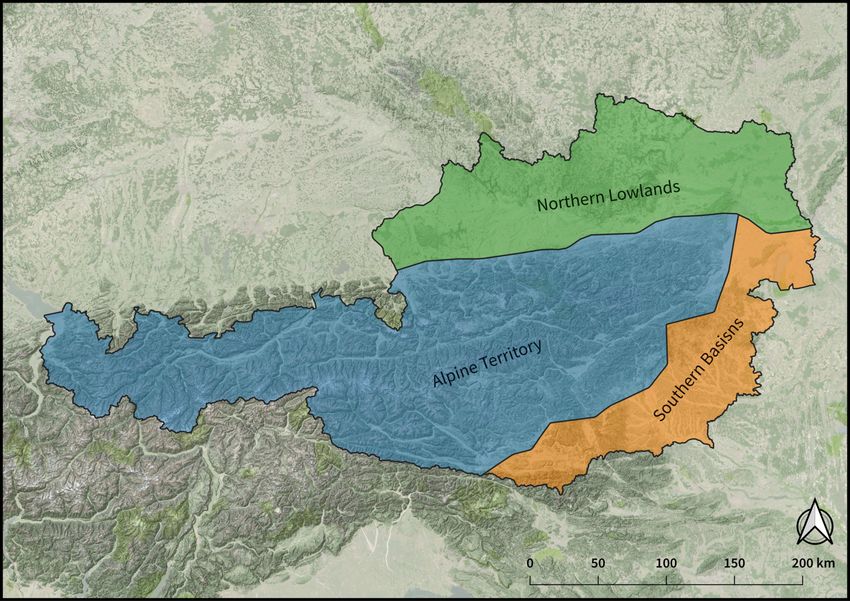
1. Orographically distinct precipitation regions within the European Alps (left,
e.g. Matulla et al. (2003)) and the ‘Machland’ project region. . . . . . . . . . . . 7
2. RCP2.6 (green), RCP4.5 (blue) and RCP8.5 (red) development-corridors for flood-
ings in the Northern Lowlands (see Figure 1) and the ‘Machland’ project region
until 2100. Bold lines indicate averages derived from associated ensembles.
Light colored ranges illustrate the ensemble’s spreading around their averages.
Near and remote future periods are identified by boxes and light yellow shading. 14
1

1.     Introduction

Extreme weather events and corresponding natural hazards have always been major threats
to people all over the globe. By now, it is a common scientific consensus that climate-
change comes along with increases in both the frequency and intensity of extreme weather
events (IPCC, 2013). Consequently, this development will go hand in hand with an increasing
amount of corresponding natural hazard events triggered by certain adverse meteorological
phenomena.
Therefore, when assessing the expected impacts of these changes on societal, ecological or
economic systems, it has to be taken into account that the underlying probability density
functions associated with single climate elements or compositions thereof are more prone
to altered probabilities prevailing within the tails of the distributions.
While this enhanced importance of variance, fortunately, seems to be broadly acknowledged
by now, its actual consideration by experts and decision-makers in ministries and civil pro-
tection associations is a highly complicated issue. Naturally, events corresponding to high
percentiles of the distributions are inherently seldom, thus exhibiting a considerable amount
of uncertainty. These levels of uncertainty are caused by highly complex interactions on all
spatio-temporal scales of various forcings and processes within and between the spheres of
the climate system. This is even aggravated by the unpredictable nature of humanity con-
cerning potential future developments.
At the same time, the population expects to be protected comprehensibly against various
hazards in an efficient, effective and sustainable way. Consequently, executives and experts
in administration, particularly within departments in charge of civil protection, face partic-
ularly challenging tasks. While they would require robust, concise information on future
changes in order to coordinate the implementation of economically feasible measures, the
high degree of uncertainty associated with the evolution of future climate threats is currently
the greatest obstacle to the implementation of sustainable protection measures. In addition
to climatic changes, occasional imprudence in spatial planning and effects of soil sealing
contribute negatively to a constantly rising magnitude of extreme events. This entails that
the design basis of protection measures against extreme events – which is usually linked to
a certain return period – does increase accordingly. Thus, even today protective structures
from the past do no longer necessarily provide the initially intended protection against nat-
ural hazards. In addition, about a quarter of the annual budget of the federal funds for the
protection against natural hazards is spent on maintenance measures. Therefore, it is crucial
to address aspects of climate-change as well as economic ones, like the cost-benefit concept,
in the decision-making process.
Based on ensembles of downscaled climate-change projections driven by several pathways
of manhood, we determine future risk evolutions for hazard-triggering processes described
by so-called Climate Indices (CIs) (Guzzetti et al., 2007; Brunetti et al., 2010; Gariano et al.,
2015; Matulla et al., 2017; Schlögl and Matulla, 2018). CIs representing floodings in Austria’s
Northern Lowlands (see Figure 1) are taken from Enigl et al. (2018). Resulting states depend
2                                        Introduction

on selected combinations of period and pathway (e.g. the state of risk referring to the near
(2035-2065) and remote future (2071-2100), driven by the ‘business as usual’ – RCP8.5, ‘first
measures’ – RCP4.5 and the ‘climate friendly’ – RCP2.6 scenarios).
Having data on possible future triggers of extreme events as derived from these large en-
sembles at hand is the first major step towards comprehensive protection of the population
against natural hazards. However, this data can be refined further by embedding it into a
context of decision theory in order to facilitate the implementation of efficient and effective
long-term adaptation measures.
Currently, the Austrian Federal Ministry of Sustainability and Tourism (BMNT), which is
in charge of civil protection measures, uses cost-benefit analysis (CBA, in German: KNU
– ‘Kosten Nutzen Untersuchung’) for comparing benefits and costs of different protection
measures (Rudolf-Miklau, 2005). The CBA-approach used is a standardized method based
on specific hazard maps and is standardly applied for the assessment of all protective struc-
tures against floods and landslides over one million Euro. This leads to an economic assess-
ment of whether (i) the project is economically viable (absolute profitability) and (ii) whether
the project is more viable than other projects (relative profitability). The evaluation of the
benefit of a project is based on the ‘4 account model’ by Maniak (2001), which comprises
economic, ecological and social benefit as well as a benefit for regional development.
In this thesis, we propose to enrich this procedure by applying methods from decision theory
to support the choice of protection measures against future hazard-occurrences. By apply-
ing decision theory we strive to include the aspect of changing climate conditions into an
evaluation procedure for protective measures for the first time. Specifically, the added value
provided by additional information on climatic changes is investigated with respect to as-
sisting decision-makers in obtaining clearer messages on protective measure projects in the
future.
Resulting future CI-corridors obtained from the above-mentioned ensembles of climate-
change projections comply with so-called ‘environmental conditions’ in decision-theory,
making its calculus applicable to the complex issues facing those responsible for public pro-
tection. In fact, choices under uncertainty or risk such as ‘Which bundle of protection mea-
sures safeguards citizens best against climate-driven future hazard challenges?’ (whereby
‘best’ means ‘sustainable, cost-effective, modularly extendable, cheap to maintain and pro-
viding sufficient protection to those in danger’) represent the core of decision theory as em-
ployed in this study.
The overarching hypothesis is that the implementation of these steps supplies valuable in-
formation to decision-makers in charge of public protection. We claim that these analyses
valuably add to the current knowledge decision-makers rely on by identifying suitable strate-
gies withstanding future hazard frequencies and intensities (i.e. decision-theory techniques
applied to future hazard development corridors determined by objectively identified CIs). At
the same time, we would like to emphasize that the proposed approach should not replace
existing structures, but rather provide additional support for stakeholders in their decision-
making process.
3

Therefore, goals of the present work are twofold. First, state-of-the-art climate-change pro-
jection ensembles are used to obtain CI corridors for the near and far future, thereby demon-
strating a new method for obtaining expected future natural hazard-occurrence frequencies.
Second, this thesis aims at supporting existing decision-making methods regarding the se-
lection of the best alternative from a set of flood protection measures by providing based on
decision theory. Here we postulate that the different RCP scenarios correspond to different
environmental states as used in expected utility theory. Corresponding utility assessments
are carried out for the different CI corridors obtained for the near and far future, thus pro-
viding additional information in a decision-making context.
4                                      Data and Methods

2.     Data and Methods

The hypothesis (I) that decision-theory techniques (DΘ) applied to different adaption-strate-
gies depending on various current and potential future risk-levels can provide useful deci-
sion support (by comparing strategies and ranking them) to those in charge of public protec-
tion. This is examined here by the use of selected datasets described hereinafter. Therefore
we employ DΘ in a particularly extensive and complex case study in which the authoritie’s
usual decision-making procedures did not come to a unambiguous result and were there-
fore not helpful. Apart from this, we test (II) whether it is possible to consider the resilience
of adaption-strategies to future changes in threats within decision-making processes. First,
however, an introduction to data and background information is given.

2.1 Representative Concentration Pathways - RCPs

The Intergovernmental Panel on Climate Change (IPCC), and scientists around the world
having contributed to the IPCC 2007 Assessment Report, received the Nobel Price for their
endeavors. Amongst many climate-change related efforts, the IPCC periodically issues new
scenarios (so-called ‘pathways’ or ‘story-lines’) concerning mankind’s future evolution, which
have so far been based on assumptions regarding e.g. population growth, advances in tech-
nology, resource consumption, economic development and global networking. All these de-
termine the temporal course of e.g. the atmosphere’s greenhouse gas concentration and,
thus, the amount of energy available to the climate-system over the decades ahead.
Current IPCC ‘story-lines’ called ‘Representative Concentration Pathways’ (RCPs) are assem-
bled somewhat differently. They assume given amounts of available energy in 2100 repre-
senting increases compared to levels of the 19th century’s second half. These amounts are
indicated as numbers in their labeling: RCP8.5, for instance, means that around 2100 the
climate-system will have 8.5 Wm−2 more energy available than around 1880. And that is a
lot. This is perhaps not obvious at first sight, because the planet receives approximately 342
Wm−2 from the sun and, hence, 8.5 Wm−2 represent ‘only’ 2,5%. However, considering, for
instance, that the sun’s output, which is by far the most important source fueling all pro-
cesses of the Earth’s system, varied just slightly (very few Wm−2 ) over the Holocene (starting
in stone-age), the potential impact induced by a sudden change of 8.5 Wm−2 from 1880 to
2100 gives – based on what has been experienced by now already – makes perhaps 8.5 Wm−2
better to grasp.
As many future-related statements are fraught with uncertainties, it became common in
climate-impact research to use at least RCP8.5, which represents ‘business as usual’ and
RCP2.6 standing for a ‘climate friendly’ future in line with COP21 (Paris 2015, the interna-
tional agreement to keep global warming well below 2°C). Here, however, we take into ac-
count RCP4.5 too, since this pathway (henceforth ‘first measures’), is cut-quantity of the two
extreme and allows for complexity above minimum requirements.
ÖKS15                                          5

2.2 ÖKS15

The ÖKS15 dataset (Chimani et al., 2016) has been established within a project called ‘ÖKS15
Climate scenarios for Austria’ and has been completed recently. The project’s goal was to
provide the Austrian climate and climate-impact community with a common dataset on re-
gional scale climate-change projections driven by the above discussed RCPs. Thereby e.g.
the problem is that methods of research-groups couldn’t be compared, because different re-
sults could have been due to the data used. Based on ÖKS15 methods are now comparable
and different outcomes easily allocatable to divergences between models.
ÖKS15 has been derived from projections of the CMIP5 initiative (Taylor et al., 2012) car-
ried out within the framework of the fifth IPCC Assessment Report (IPCC, 2013). CMIP5 data
comprise regional-scale climate-change RCP scenarios, generated by Regional Climate Mod-
els (RCMs) from Global Climate Model (GCMs) runs at a 12 km grid. CMIP5 runs for Europe
are subsumed under the label EURO-CORDEX (Jacob et al., 2014). By the application of ‘bias
corrections’ methods, detailed in Chimani et al. (2016), EURO-CORDEX realizations have
been brought onto the so-called SPARTACUS grid (1 km resolution, Hiebl and Frei (2016)) all
over Austria’s territory. ÖKS15 data cover the period 1971–2100, feature daily precipitation
totals, minimum, mean and maximum temperatures as well as solar radiation values. For
the present study we have retrieved 8 projections referring to RCP2.6 and 11 each for RCP4.5
and RCP8.5, respectively.

                              ALADIN   CCLM   HIRMAM5   RACMO   RCA   REMO   WRF
                CNRM-CM5        •       •                        •
                 EC-EARTH               •        •        •      •
                HadGEM2-ES              •                        •
               IPSL-CM5A-MR                                      •            •
                MPI-ESM-LR              •                        •     •

Table 1: ÖKS15 data set for daily precipitation in Austria. In all there are 5 GCMs (rows) com-
bined with 7 RCMs (columns). Subsequently, the signal is downscaled on a grid of 1 km using
statistical methods.

2.3 Project based data

2.3.1 Cost-benefit analysis - KNU

As for data on public protection, sheltering structure as well as safeguarding measures brought
in place and into effect, we exploit three main sources, processed in the usual decision-
making processes applied by the authorities (e.g. by means of KNU) and in this work here of
course too, to test this study’s hypotheses (DΘ in I and II above).
6 Data and Methods The first of theses databases is the so-called BMNT’s ‘KNU database’, which comprises de- tailed data on large and expensive public-protection projects carried out and documented by federal authorities. These are shield structures of various sorts and safeguarding measures of all kinds, which are by officials grouped into three categories: ‘Linear measures L’, ‘Re- tention measures R’ and relocations, which are labeled by an A (for German ‘Absiedelung’). More concisely, dam-constructions, mobile flood protection walls, landslide-breakers, bar- riers of various kinds, road galleries in mountainous terrain, etc. are grouped under ‘Linear measures L’ while flood basins, flood plains, remote barrier woodlands, discharge reservoirs, etc. are summarized as ‘Retention measures R’. KNU comprises 145 detailed documented projects, whose construction costs exceed a lower bound of a Mio. Euro, which excludes tens of thousands smaller scale protective structures and shielding measures that have been put in place since more than seven decades by now each for less than one Mio. Euro. These projects have been realized more often in the Northern Lowlands (NL) and the Southern Basin Chain (SB) than in the Alpine Territory (AT, see Figure 1). 2.3.2 BMNT fact sheet catalog Second, a ‘project fact sheet catalog’ maintained by BMNT and openly accessible (in Ger- man) at the website of the ministry (BMNT, 2018c) contains rather scattered, but perhaps more complete data dating farther back in time in municipalitie’s archives. The ‘project fact sheet catalog’ provides detailed information on the conductance of the entire protection ventures and causal factors (together with stories about catastrophes, impacts, casualties, overcoming and coping). The costs of such endeavors generally do not exceed one Mio. Euro. 2.3.3 State audit office collection Finally there is the ‘state audit collection of material’ for realized projects, provided by the Austrian state audit offices (each federal province has its own branch). This ‘collection of material’ contains an in-depth breakdown of the costs of each construction and measure (Linear measures L, Retention measures R and relocations A) by municipality. In this thesis we evaluate DΘ for decision-making (hypotheses I and II) on a very prominent case that resulted from a thoroughly and extensive research of datasets accomplished by the federal officials. The ‘Machland’ project was identified as most challenging. ‘Machland’ (ML) is amongst the most expensive and complex projects. It combines all strategies (L, R, A) in measures and shielding constructions of various kinds and shapes and took about three decades to be finished. This project is one in which the KNU (see above) has come to no clear result and, thus, was of no support in decision-making.
Methods                                            7

Figure 1: Orographically distinct precipitation regions within the European Alps (left, e.g.
Matulla et al. (2003)) and the ‘Machland’ project region.

2.4 Methods

This section introduces decision theory techniques (DΘ, von Neumann and Morgenstern,
1945)) we are using to address the ‘Machland’ case study. These techniques are applied in
chapter Results, to figure out whether they allow for (I) a comparison and ranking of the
authoritie’s adaption-strategies (A, L, R, see subsection Cost-benefit analysis - KNU above)
as well as (II) setting up sustainable, anticipatory protection-policies by integrating future,
climate-change driven hazard-levels into the assessment. In our case that means, the imple-
mentation of near (2035–2065) and remote (2071–2100) future average risk-levels regarding
floodings driven by three different pathways of mankind (RCPs, see subsection Representa-
tive Concentration Pathways - RCPs).

2.4.1 Bernoulli Principle

In order to briefly mention crucial aspects of DΘ (von Neumann et al., 2007) we make use
of in this study, we follow amongst all possible paths, of which there are many, a perhaps
(at first sight) strange one. First we thought about starting from a class of utility-functions
(known by the designation ‘Hyperbolic Absolute Risk Aversion - HARA’, Breuer et al. (2006))
that finds wide application in portfolio-management, which as a starting point would make
obviously sense. HARA’s flexible functional appearance allows for the treatment of different
utility-functions and probability distributions; the evaluation of diverse rational investment
behaviors and preferences; assessing the advantages of separation and the optimization of
investment-strategies in terms of portfolios made up by complex asset structures in depen-
dence on invested volumes and on actual rates.
All these characteristics are suitable for our application and can be translated into protection-
strategies (A, L, R) reflecting diverse bundles of safeguarding constructions and protection
measures under different scenarios of human behavior within two distinct future periods.
Even more, HARA can be rather elegantly reduced to ‘Bernoulli Principle’ that we actually
apply (Breuer et al., 2004). This path would be self-contained and follow a logical sequence.
8                                        Data and Methods

However, it would also be extensive, laborious and touching on a number of topics we ac-
tually don’t use here. Therefore and for brevity we confine ourselves to just mention and
conveniently arrange most significant aspects DΘ as seen from the viewpoint of our appli-
cation. As such the course below is efficient and hoped to be traceable.
The idea of applying decision theory to problems emerging in public protection and safe-
guarding critical infrastructure is to attain objectively derived suggestions to see, how to
compare and rank different protection-strategies (so-called ‘alternatives’ in DΘ’s terms) to
ensure civil security in face of threat occurrences (so-called ‘environmental conditions’ in
DΘ). This situation is best represented by a matrix called ‘result matrix’ (Breuer et al., 1999).
Table 2 depicts a typical example of a ‘result matrix’ having in its rows the ‘alternatives’ and
in its columns ‘environmental conditions’ together with associated probabilities weighting
their actual occurrence.

                          env. condition         E1            E2            E3
                            probability          p1            p2            p3
                                  A1          u k (e 11 )   u k (e 12 )   u k (e 13 )
                                  A2          u k (e 21 )   u k (e 22 )   u k (e 23 )
                                  A3          u k (e 31 )   u k (e 32 )   u k (e 33 )
Table 2: Typical ‘result matrix’ appearing in decision theory: columns contain ‘environmental
conditions’ E j , rows ‘alternatives’ A i amongst which the most suitable is to be identified. In
case there are values for probabilities p j on hand, these indicate likelihoods with which corre-
sponding E j are to be expected. u k stands for utility-functions associated with three function-
families (k= 1, 2, 3) of Bernoulli’s Principle (as outlined in the text). e i j finally signify invest-
ments, amounts of resources (e.f. money).

The goal is to determine by objective methods the most suitable ‘alternative’ under given
‘environmental conditions’. Matrix elements e i j are in business management rather often
amounts of money (here we prefer, because of wider generality, speaking of resources) that
can be earned in various portfolio assets. We apply techniques appearing in cases called
‘decision under risk’. This is one of two variants of ‘decision under uncertainty’ and the other
one is labeled ‘decision under unawareness’. While in the latter case there is no notion on
probabilities with which different ‘environmental conditions’ may appear, we have estimates
on ‘environmental conditions’ available (p j see Table 2 and chapter Results).
In civil protection and various other applications amounts of money are not sufficient (or un-
suited) to adequately define the problem under investigation and hence, it generally makes
much more sense to consider utility instead of just money or resources as unit (we have
heard that e.g. the first million Euro earned carries more value than the tenth). That has
been obvious to Bernoulli (1954), who introduced therefore ‘utility’ instead of money. So
Bernoulli’s Principle translates money or resources (e i j ) into its utility. Now the next ques-
tion to worry about refers to the curvature of utility-functions. Bernoulli’s Principle offers
three families of utility-functions (u k , k= 1, 2, 3; in Table 2). In case the utility-function’s cur-
vature is concave then the utility of the resource considered increases with the uptake of one
Methods 9
unit stronger when there is little of it available compared to the rise in utility if many units
are already there (e.g. the money example above). Concave functions reflect ‘risk aversion’,
linear functions ‘neutrality’ and convex ones ‘risk affine attitudes’ (Breuer et al., 2006). So,
by changing ‘utility’-functions the effect of various attitudes towards risk on rankings of the
‘alternatives’ can be made visible. In civil protection and safeguarding critical infrastructure
Bernoulli’s Principle offering the aforementioned families of utility-functions is appropriate
while ‘just money’ is not.
2.4.2 Decision rules
Let us assume we have filled resources (e i j ) into our ‘result matrix’ decided which utility-
function type to apply (i.e. setting up our ‘result matrix’ is completed) – how to proceed from
there? How to detect which ’alternative’ is the ‘best’? In decision theory there are many ‘de-
cision rules’ on hand to solve this situation. These rules tell where and what to look for in
‘result matrices’ (e.g. smallest or largest values, differences from maxima or minima, within
rows and columns, building averages and compare deviations of elements from that or from
previously singled out maximum and minimum values, etc.). These rules lay out how to
proceed when comparing rows and columns to finally arrive at rankings concerning various
alternatives. Here we will just mention those rules which are indispensable in our applica-
tion.
von-Neuman-Morgenstern rule
The von-Neuman-Morgenstern rule calculates for each ‘alternative’ A i (rows in Table 2) the
sum of its utilities u k (e i j ) weighted with their probabilities p j . The selected alternative ‘A c ’ is
the one exhibiting the largest outcome (von Neumann and Morgenstern, 1945). k indicates
the decision maker’s attitude towards risk (adversion, neutrality or affinity). Since we focus
on risk-adversion, which is considered in most applications and naturally in civil protection,
we omit this index below. Here and in the following i ∈ {1, 2, 3} referes to the alternatives and
j ∈ {1, ..., 6} corresponds to the environmental conditions, which are in our case A, L, R and
RCP2.6, 4.5, 8.5 in the near and far future, respectively.
N
X
u(e i j ) → p j · u(e i j ) → p j · u(e i j ) := U (A i ) (1)
j =1
A c = max[U (A i )] (2)
i
In short:
N
X
A c = max[ p j · u(e i j )] (3)
i j =110 Data and Methods
Maximax and Maximin rule
The so-called Maximax rule reflects ‘optimistic expectations’ of the decision-maker. In the
first step it identifies for each ‘alternative’ A i the maximum value amongst all environmental
conditions. Then the alternative showing the largest value is chosen. The ‘Maximin’ rule
(also called ‘rule of least regret’) proceeds as ‘Maximax’ but selects the ‘alternative’ having
the smallest value in the second step.
u(e i j ) → max[u(e i j )] := U (A i ) (4)
j
A c = max[U (A i )] (5)
i
Maximax in short: ½ ¾
A c = max max[u(e i j )] (6)
i j
u(e i j ) → max[u(e i j )] := U (A i ) (7)
j
A c = min[U (A i )] (8)
i
Maximin in short: ½ ¾
A c = min max[u(e i j )] (9)
i j
Hurwicz rule
This rule combines the idea behind Maximax and Maximin by multiplying maximum and
minimum values of rows with λ ∈ {0, 1} and (1 − λ), respectively. Afterwards both terms are
summed over. The ‘alternative’ exhibiting the largest result is the one to be selected. λ’s value
corresponds to the decision-maker’s attitude in-between an optimistic (λ close to 1) and a
pessimistic view (λ close to 0) on the problem.
u(e i j ) → max[u(e i j )] · λ + min[u(e i j )] · (1 − λ) := U (A i ) (10)
j j
A c = max[U (A i )] (11)
i
In brief: ½ ¾
A c = max max[u(e i j )] · λ + min[u(e i j )] · (1 − λ) (12)
i j jMethods 11
Savage-Niegans rule
The alternative to be selected is the one resulting from the following procedure: (i) deter-
mine maximum values for each environmental condition E j (i.e. identify each column’s
maximum); (ii) built for each column the (positive) difference between the (just determined)
maximum and the column’s u k (e i j )s; (iii) identify for each alternative (row) the maximum
and (iv) select the alternative providing the smallest outcome.
½ ¾
u(e i j ) → max[u(e i j )] → max[u(e i j )] − u(e i j ) → max max[u(e i j )] − u(e i j ) := U (A i ) (13)
i i j i
A c = min[U (A i )] (14)
i
In brief: ½ ¾
A c = min max[max[u(e i j )] − u(e i j )] (15)
i j i
Please note that DΘ presumes ‘rational behavior’ of decision-makers. This means, that less
of a resource is never better than more of it. This applies (e.g.) for all of Bernoulli’s utility-
functions no matter which type. Utility-functions just express how much ‘better’ it is to have
one unit more of a resource in dependence on the amount of the resource already on hand
(see e.g. our ‘one Mio. Euro’ example above). In this study, however, we deal with costs
that have to be paid according to different protection-strategies (A,L,R, see subsection Cost-
benefit analysis - KNU) in order to maintain current levels of protection in the future. Hence,
‘more’ is in our case not better, because when, for instance, strategy A provides the same
level of safety at less cost then strategy L then no responsible decision-maker would chose
the more expensive offer. So, in order to stay with DΘ assumption: ‘more is better’, we will
reverse the order of costs (’less to pay is better’, see below).12 Results
3. Results
Here we demonstrate the applicability of the above introduced techniques for decision-
making (Breuer et al., 2006) by examining the ‘Machland’ (ML) project, in which KNU (see
subsection Cost-benefit analysis - KNU) has not attained a distinct result concerning the au-
thoritie’s protection-strategies (A,L,R; see subsection Cost-benefit analysis - KNU too) and,
thus, was of no help in decision-making. As lined out already ML was selected through a
thoroughly carried out assessment of the ‘KNU database’ and the other two datasets detailed
above.
3.1 History of the public protection project ‘Machland’
(case study)
The region Machland in upper Austria, crossed by the river Danube, is characterized by flat
orography at low altitudes, a natural retention area and, hence, prone to floodings. The se-
vere flooding in summer 1991, which severely impacted seven municipalities (Mauthausen,
Naarn, Mitterkirchen, Baumgartenberg, Saxen, Grein and St. Nikola) was the final, decisive
impetus to actually take action by identifying two particularly vulnerable areas and imple-
menting a protection-strategy according to the danger zone principle (i.e. partitioning a re-
gion into zones of different risk-levels). Zone 1, approximately 35 km located along the river
Danube’s northern bank was assigned to the highest risk-level, 33 inhabitants were relocated
(A) and compensated (by 8,35 Mio. Euro in total). Zone 2, farther inland, should have been
shielded by a flood protection dam system (L) consisting of two flood control-lines with dif-
ferent protection capacities for flood-runoffs (geared to withstand HQ30 and HQ100) which,
however, have not been realized before 2002.
After the ‘flood of the century’ hit in August 2002, a new risk-reassessment led to a halt in
the implementation of the above described undertakings and initiated another phase of the
protection-project ‘Machland (ML)’, called ‘Machland North’. This project phase was actu-
ally realized from 2008 to 2015 for a total of 265.9 Mio. Euros (Landesrechnungshof, 2014).
Overall, all types of the authoritie’s protection-strategies were brought into effect: 220 set-
tlements (in Baumgartenberg, Mitterkirchen, Saxen, Grein and St. Nikola) were relocated.
Compensation payments amounted up to a total of 85.3 Mio. Euro (protection-strategy
A); 36.2 km of linear flood protection measures (earth dams, walls, mobile protective walls:
strategy L), have been realized for a total of 165,4 Mio. Euro and a 8.7 km long flood depres-
sion in Naarn and Mitterkirchen (protection-strategy R) incurred costs of 15.2 Mio. Euro.
In the following, the thesis focuses on Naarn and Mitterkirchen for which we have avail-
able detailed information on expenses from the Landesrechnungshof (2014) report, BMNT’s
‘project fact sheet catalog’ and the ‘KNU database’ for all three protection-strategies L, R and
A. 15.2 Mio. Euro have been devoted to protection-strategy R; 48.8 Mio. Euro to strategy L
and 23.3 Mio. Euro to strategy A, which consisted of the relocation of 60 settlements (Mit-Potential future risk development corridors 13 terkirchen). Figure 1 depicts the affected region, the river Danube’s course and their location within the Northern Lowlands and Austria. 3.2 Potential future risk development corridors Based on that and in order to examine our hypotheses we analyze and assess future threat levels induced by floodings in the Machland area (contained in the Northern Lowlands, see Figure 1). As for the hypotheses: let us assume hypothesis II works, meaning it turns out that DΘ allows for the implementation of future risk-levels in two future periods (e.g. the near future, ‘nf’: 2035–2065 and the remote future period, ‘ff’: 2071-2100) into decision-making processes. Then in fact the hypothesis I also works, because it results from II: by renaming ‘nf’ by ‘actual’ and ‘ff’ in ‘future period’. Floodings in the Northern Lowland of Austria (NL) are identified by special sequences of daily precipitation totals within 8-day sequences (called Climate Indices, Schlögl and Laaha (2017); Matulla et al. (2017)), that are objectively determined by multivariate techniques by von Storch and Zwiers (1999) and discussed in detail by Enigl et al. (2018). In order to derive future climate-change driven projections of hazard-occurrences in terms of floodings (in the Northern Lowlands and the Machland region, see Figure 1) until 2100, we apply these CIs (derived by Enigl et al. (2018)) to the ÖKS15 data by Chimani et al. (2016) presented in the ÖKS15 subsection. This way we generate ensembles of future hazard-occurrences (risk- levels) pertaining to floodings for the Machland region associated with three pathways of mankind (RCP2.6 ‘climate friendly’, RCP4.5 ‘first measures’ and RCP8.5 ‘business as usual’) throughout two distinct future periods (‘nf’ and ‘ff’). Results of this analyses are shown in Figure 2. Figure 2 depicts, for the Northern Lowlands containing the Machland region, development corridors of potential future threat-occurrences in terms of floodings corresponding to the different pathways of mankind: ‘climate friendly’ RCP2.6 (green), ‘first measures’ RCP4.5 (blue) and ‘business as usual’ RCP8.5 (red). Bold lines show the run of ensemble averages, while shaded areas depict ensemble’s spreads around, comprising approximately 70% of the projections contained in the ensembles. These future temporal developments match at the transition from the past to the future very well with those of the past (indicated by a bar in the leftmost part of Figure 2). Near and remote future periods are indicted by boxes and light yellow shading. In ‘nf’ RCP2.6 and 4.5 feature different runs, but more importantly, when considering three decades (i.e. climate) they exhibit only a slight difference in terms of addi- tional hazard-occurrences: +3 and +4 more occurrences in 2035-2065 than in the past 1980- 2010. However, their behavior is rather different from that of RCP8.5, which exhibits +8 flood- ings on average. In ‘ff’ the development-corridor of RCP8.5 continues to increase depicting a rise in additional threat-occurrences of +16, while in case of RCP4.5 increases are weak: +6, which is less than RCP8.5’s change in the near future period, and its development-corridor seems to run into saturation. RCP2.6, other than the others, shows decreases compared to ‘nf’, meaning hazard-occurrences return in case of RCP2.6 to past (1980-2010) levels.
14                                            Results

Figure 2: RCP2.6 (green), RCP4.5 (blue) and RCP8.5 (red) development-corridors for floodings
in the Northern Lowlands (see Figure 1) and the ‘Machland’ project region until 2100. Bold
lines indicate averages derived from associated ensembles. Light colored ranges illustrate the
ensemble’s spreading around their averages. Near and remote future periods are identified by
boxes and light yellow shading.

3.3 Estimation of path-probabilities in the near and
        far future

Table 3 depicts in its top row DΘ’s ‘environmental conditions’ (see Table 2) which are here fu-
ture threat-levels corresponding to the three pathways of mankind within near and far future
periods (‘nf’, ‘ff’). The second row refers to their probabilities (a prerequisite for applying ‘de-
cision under risk’ - see subsection Bernoulli Principle), which we have derived from different
sources. These are: expert interviews (e.g. climate research scientists of the Potsdam Insti-
tute for Climate Impact Research, Feulner, PIK (2018), Austrian governmental programs con-
cerning reduction of greenhouse gas emissions, BMNT (2018a) and an IPCC web-application
designed by the MIT, Climate Interactive (2018). Taken together, various evaluations result
in the following probabilities (arranged from left to right - RCP2.6/4.5/8.5 in the near future
period followed by the same order in the remote future period): 8%, 30%, 62%; 30%, 60% and
10%.

3.4 Estimation of required investment sustaining current
        protection

Below analyses carried out by the application of DΘ’s techniques, rely on assumptions and
concepts resulting from round table discussions with government officials and represen-
Estimation of required investment sustaining current
protection 15
tatives of Europe’s leading transport, freight an logistics industries (Freight and Logistics,
2018). Based thereupon we assume that an increase in hazard events requires efforts, which
equal in degree squared increases, in order to maintain current protection-levels. This is (up
to certain amounts of changes) the answer to - ‘What is the extent of investments required
to sustain present levels of safety for the public and for business operation?’ Now briefly a
thought experiments referring to the efforts required to keep present day safety-levels. We
found that on climate average for the period 1980–2010 floodings, which generally happen
in the warmer half of the year, occur about 8 times per year. That gives a small probability for
a ‘double hit’, meaning two events on the same day. The average of 8 floodings increases up
to 16 floodings by the end of this century (2071–2100, RCP8.5, see Figure 2). The probability
of a ‘double hit’ is then large. In fact a ‘double hit’ is to be expected more often than every
second year. This problem is well known in statistics (from low to medium probabilities of
hazard-occurrences - i.e. occurrences of floodings per year) and the curvature showing in-
creasing probabilities of ‘double hits’ follows a parabola corresponding to squared efforts,
which we have just introduced above. In the past the risk for a ‘double hit’ was regarded as
an acceptable ‘restriction risk’ because the amount of resources required for defense struc-
tures withstanding unlikely ‘double hits’ is very large. In the future, however, this ‘restriction
risk’ becomes exceedingly high. So, what happened seldom in the past is expected to oc-
cur at least every second year in the future. Therefore it is understandable that maintaining
present day protection-levels comes with truly large efforts (of second order) in the future.
From thoroughly data evaluations we know present values for costs associated with A, L and
R, which are 23.3 Mio. Euros, 48.5 Mio. Euros and 15.2 Mio. Euros respectively. The appli-
cation of DΘ to the three protection-strategies under six future ’environmental conditions’
(RCP2.6/4.5/8.5 in 2035–2065 and 2071–2100), however, requires assumptions on their fu-
ture evolution. Please note that the evaluation of our hypotheses does not depend much on
the structure of the utility-functions, compiled in the following. In this regard the decisive
aspect is the accomplishment of their compilation and not their actual form. Anyway, all
(in the following) carefully compiled estimates concerning future behaviors are meaningful
results according to round table discussions and data on public protection (see chapter Data
and Methods). As for strategy A we assume compensation payments for resettlements to de-
crease with time, meaning that residents of heavily endangered domiciles are not profiting
from disregarding resettlement calls until their domiciles are devastated; in case of strategy
L expertise of ministry and industry officials suggests an exponential like grow of expenses
because the percentage of attainable protection increases quickly at the beginning but slows
down logarithmically with already reached protection-levels. That behavior is well known
from growth simulations of various kinds and shapes, which are generally approximated by
first order ordinary differential equations. Thereby gains in height per time unit are linked
inversely to e.g. the third power of elapsed time. Finally, in case for R, it is evident to set
forward equal costs for each excavated cubic square meter and thus effort grow linearly with
the amount of m3 to be excavated in order to provide proper safeguarding.16 Results 3.5 Anticipatory planning sustainable protection strategies Now that we have described the assembly of costs in the various cases, we want to highlight the following issue that refers to the very prerequisites of DΘ, within which the ‘reasonable’ decision-maker is always the central assumption. In the context of Bernoulli’s Principle that means it is reasonable to never value large amounts (of money) lower than smaller amounts. That is the case in all three families of utility-functions considered in the Bernoulli’s Principe: for risk-aversion, risk-neutral and risk-affine utility-functions. In the present case, however, large values refer to large costs and so we have to reverse the order. Hence, (i) we take a Supremum of all costs; (ii) multiply costs with (-1) to reverse their order; and (iii) add the Supremum to all of them (shifting all values along the x-axis until all are positive again). Table 3: DΘ’s ‘result matrix’ depicting in its columns six ‘environmental conditions’, which in anticipatory decision-making refer to the three pathways of mankind in two distinct future periods (2035–2065 and 2071–2100). The second line shows the future state’s probabilities. Rows contain DΘ’s ‘alternatives’ reflecting three authoritie’s protection-strategies A, L and R, respectively. ‘u k ’ indicate different risk-attitudes (’utility-functions’ in DΘ) dominating final findings. Table 3 depicts the ‘result matrix’ (see DΘ in subsection Bernoulli Principle) combining ‘en- vironmental conditions’ (which we associate here with future threat-levels in near and re- mote future periods caused by three different pathways of mankind) with ‘alternatives’ (that are the authoritie’s protection strategies in our case). Values within brackets are costs linked to particular ‘alternatives - environmental condition’ combinations, and required to main- tain current protection-levels. They are made up of the efforts, which are reasoned by dif- ferent hazard development-corridors depict in Figure 2 and by the future behavior of the protection-strategies, assembled through round table discussions with government officials and representatives of Europe’s leading transport, freight an logistics industries (see discus- sion above). So, Bernoulli’s utility-functions contain costs (given in Mio. Euro) that are made up of (i) current pricing regarding A, L and R, derived from data (ii) their future evolutions as just laid out in the above discussion and (iii) of efforts needed to compensate climate-change driven increases in threat-occurrences pertaining to different floodings development-corridors (see Figure 2). Based on this ‘result matrix’ it shall be possible to implement future states into decision-making, which would then allow for anticipatory developing sustainable protection- strategies urgently required, but not attained so far.
Anticipatory planning sustainable protection strategies                      17

The ’uk (e i j )’s (k= 1, 2, 3) in all rows and columns of Table 3 highlight different types of utility-
functions available in Bernoulli’s Principle (see subsection Bernoulli Principle, Bernoulli (1954)).
These are:

                                                                                                p
   – ‘risk aversion - av’ expressed by concave utility-functions represented here by             ei j ,
     featuring (E means ‘expectation value’) E(uav (ei j )) < u av (E(ei j ))

   – ‘risk neutrality - ne’ defined by linear utility-functions, e.g. k ∗ e + d and hence giving
     E(une (e i j )) = une (E (e i j ))

   – ’risk-affinity - af’ described by convex utility-functions, e.g. e 2 resulting in E(uaf (e i j ))
     > uaf (E (e i j ))
18 Results and discussion 4. Results and discussion Table 4 presents DΘ’s final assessment of our case study ‘Machland’, which here is based on Bernoulli’s ‘risk-aversion’ that in nearly all practical cases (except from casino visitors, per- haps) - particularly in those of public-protection and industrial matters - reflects the proper attitude of responsible decision-makers. Aside, we attained very similar outcomes when ap- plying utility-functions, which are associated with ‘risk neutrality’. Table 4: Evaluation of protection-strategies based the ‘Machland’ project, on climate-change induced flooding development-corridors until 2100, and DΘ techniques. The table’s upper half refers to (2035–2065) while findings in the bottom half are based on (2035–2065) and (2071–2100). Rankings to be used in forward-planning sustainable protection-strategies are shown in the rightmost column. Unlike other decision rules those in brackets refer to a deci- sively more optimistic view. Rankings based on them too are presented in brackets (rightmost column). Anyway, the first column of Table 4 lists the authority’s protection-strategies, the second dis- plays results when applying the ‘von Neumann-Morgenstern’ rule, followed by the ‘Hurwicz’ rule, which combines ’Maximax’ and ‘Maximin’ rule and, thus, allows for two views on the problem - one is rather pessimistic (’Hurwicz-’, left values) and the other rather optimistic (’Hurwicz+’, values in brackets). The fourth column comprises the outcome of the ‘Savage- Niehans’ rule and the rightmost column presents the overall ranking (please find descrip- tions of all rules in subsection Decision rules). The table’s upper half bears on the near future while its lower part refers to both future peri- ods. As such, results contained in the upper half are based on analyses of threat development- corridors during the near future period (2035–2065) solely, while findings provided in the bottom part rely on the run of these corridors in both periods (i.e. 2035–2065 and 2071– 2100). Thus, results of the latter analyses are founded on all six ’environmental conditions’ determined by future hazard-occurrences corresponding to different pathways of mankind. Evaluations regarding near future challenges (Table 4, upper half) based on the ‘von Neumann- Morgenstern’ decision rule yields the same ranking as ’Savage-Niehans’ which is (beginning with the most suitable strategy): R, A, L. ‘Hurwicz-’ also identifies R as most suitable, but
You can also read